Copyright
©The Author(s) 2020.
World J Stem Cells. Jun 26, 2020; 12(6): 500-513
Published online Jun 26, 2020. doi: 10.4252/wjsc.v12.i6.500
Published online Jun 26, 2020. doi: 10.4252/wjsc.v12.i6.500
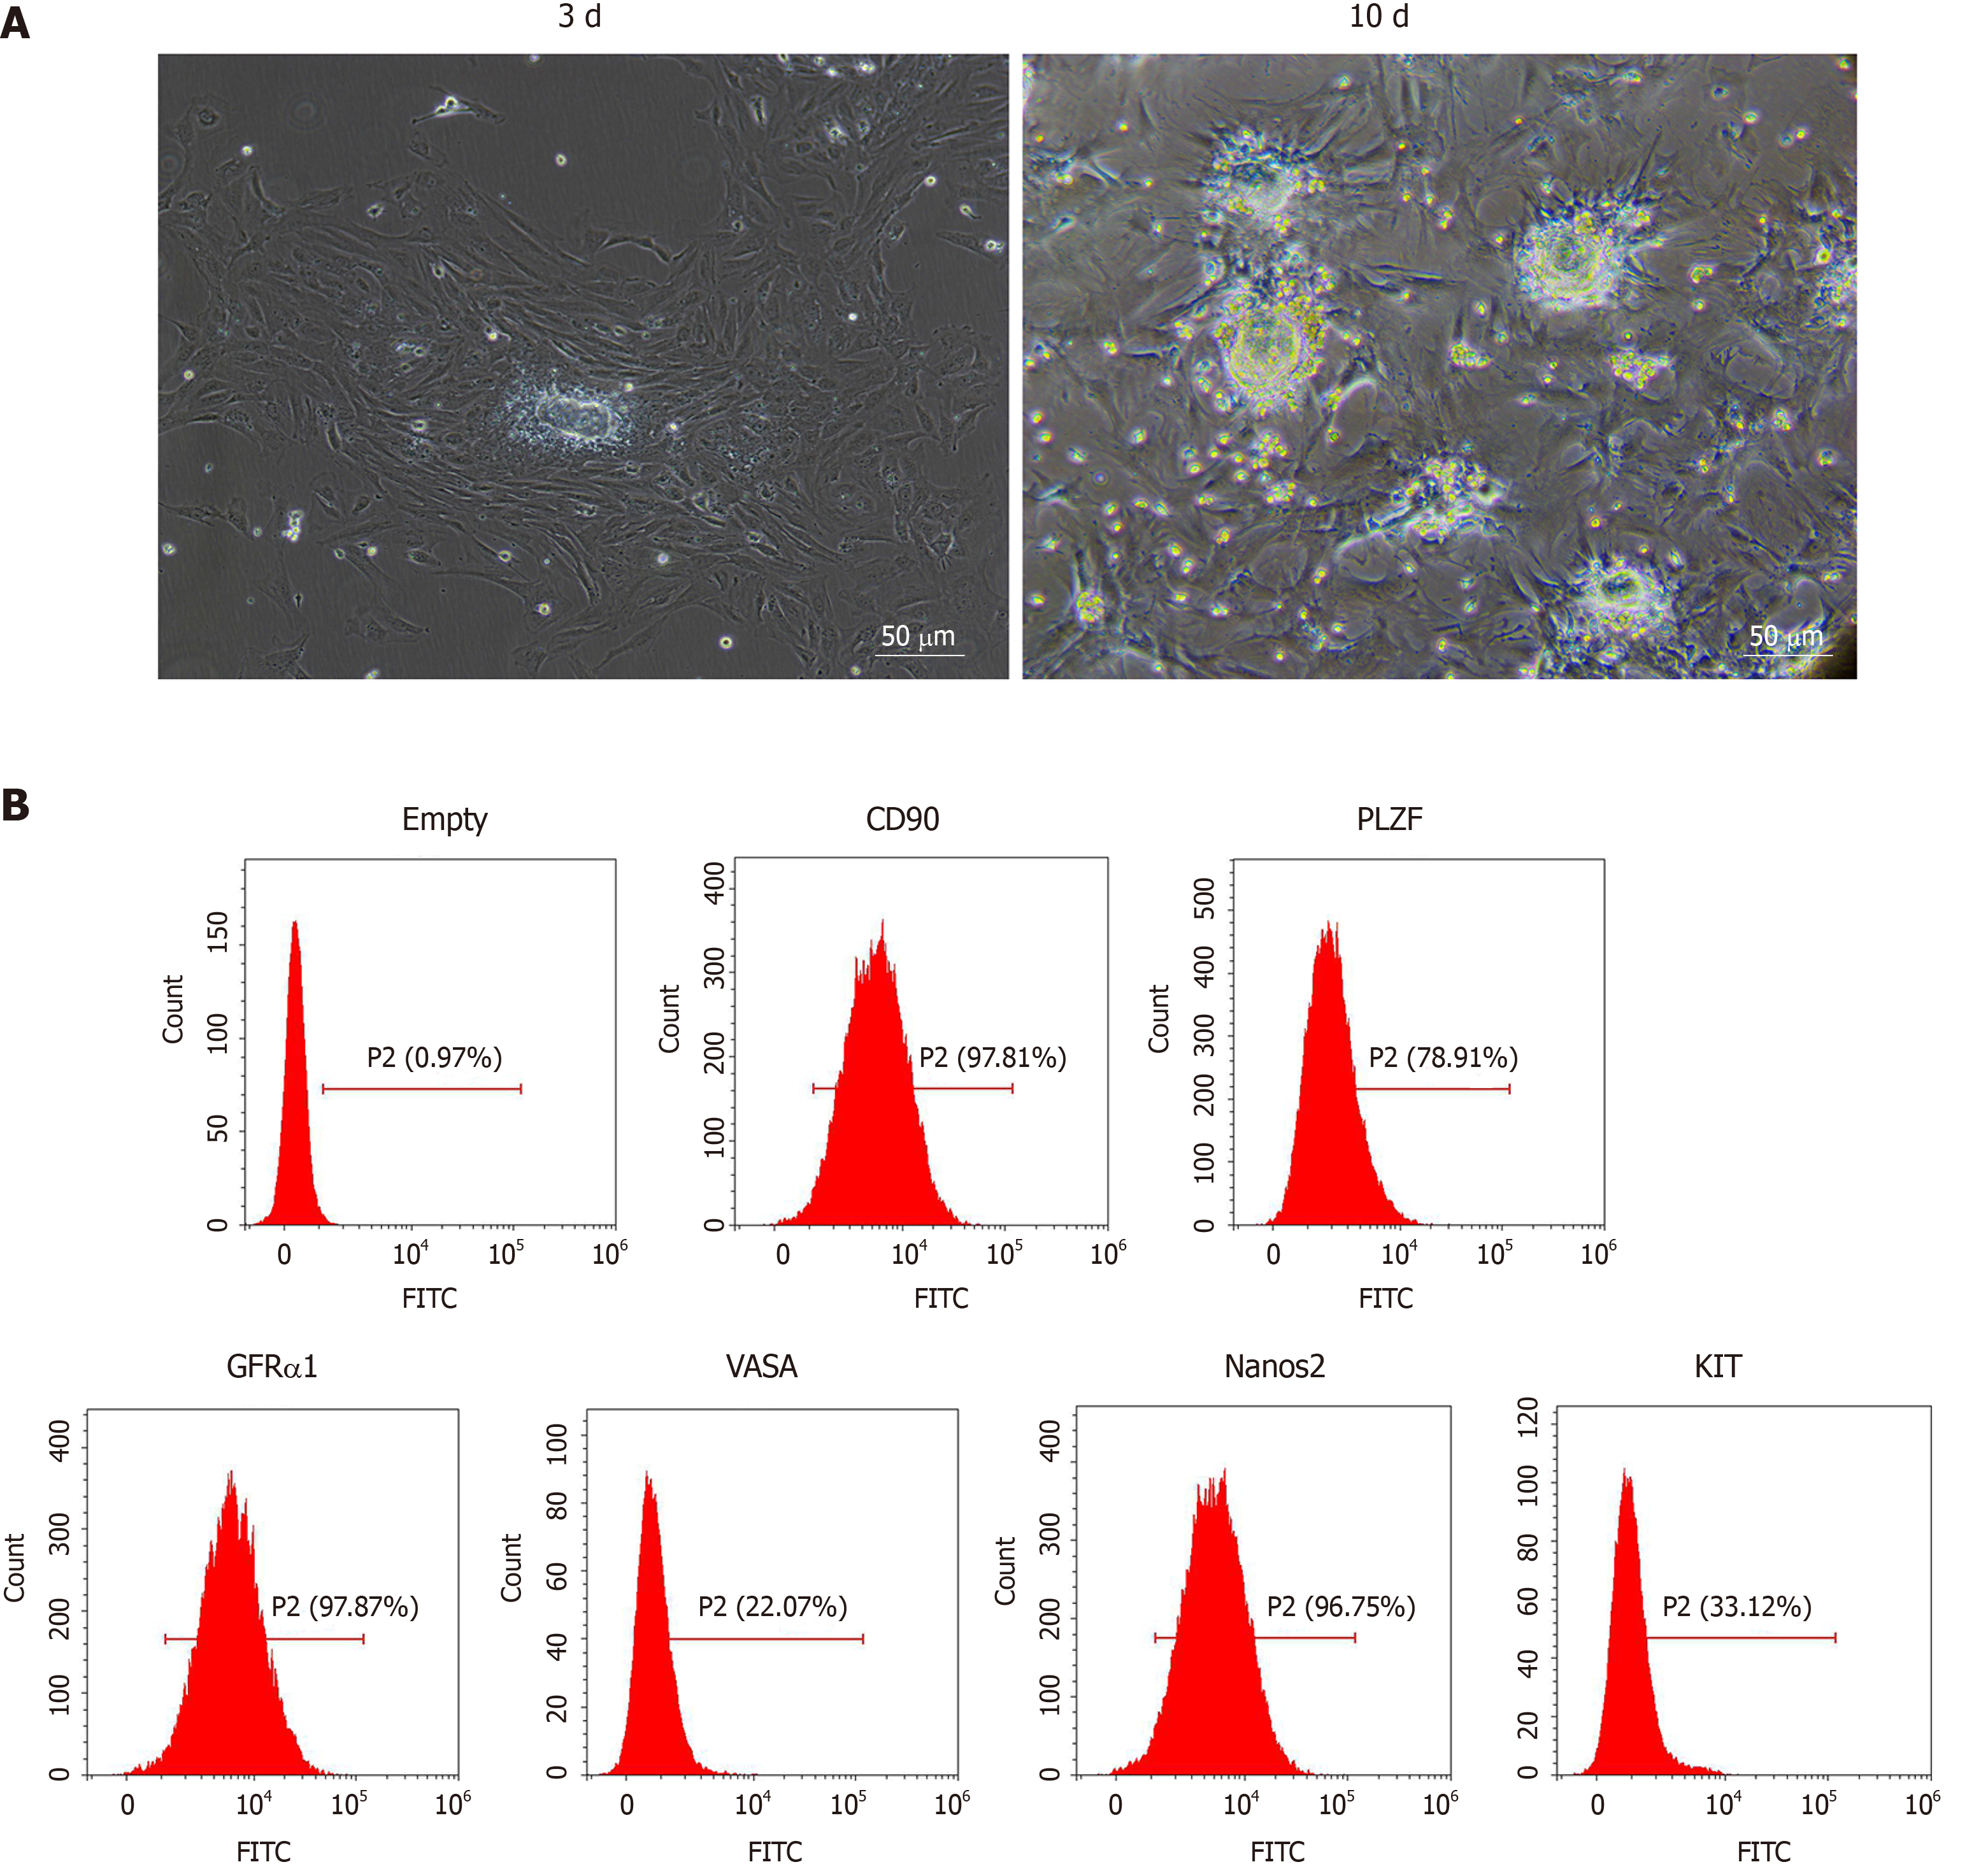
Figure 1 Culture and identification of spermatogonial stem cells.
A: Light microscopy of spermatogonial stem cells cultured for 3 d and 10 d (scale bar = 50 μm); B: Identification of spermatogonial stem cells by flow cytometry.
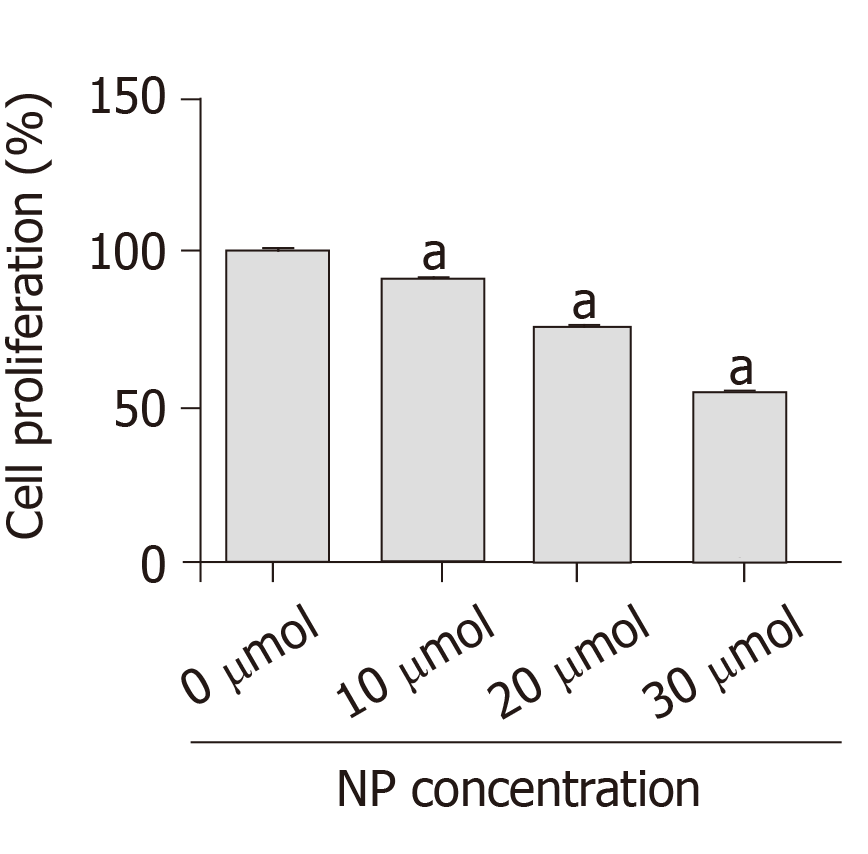
Figure 2 MTT assay of cell proliferation.
The results are presented as the mean ± standard deviation, n = 3. aP < 0.05 vs 0 μmol nonylphenol. NP: Nonylphenol.
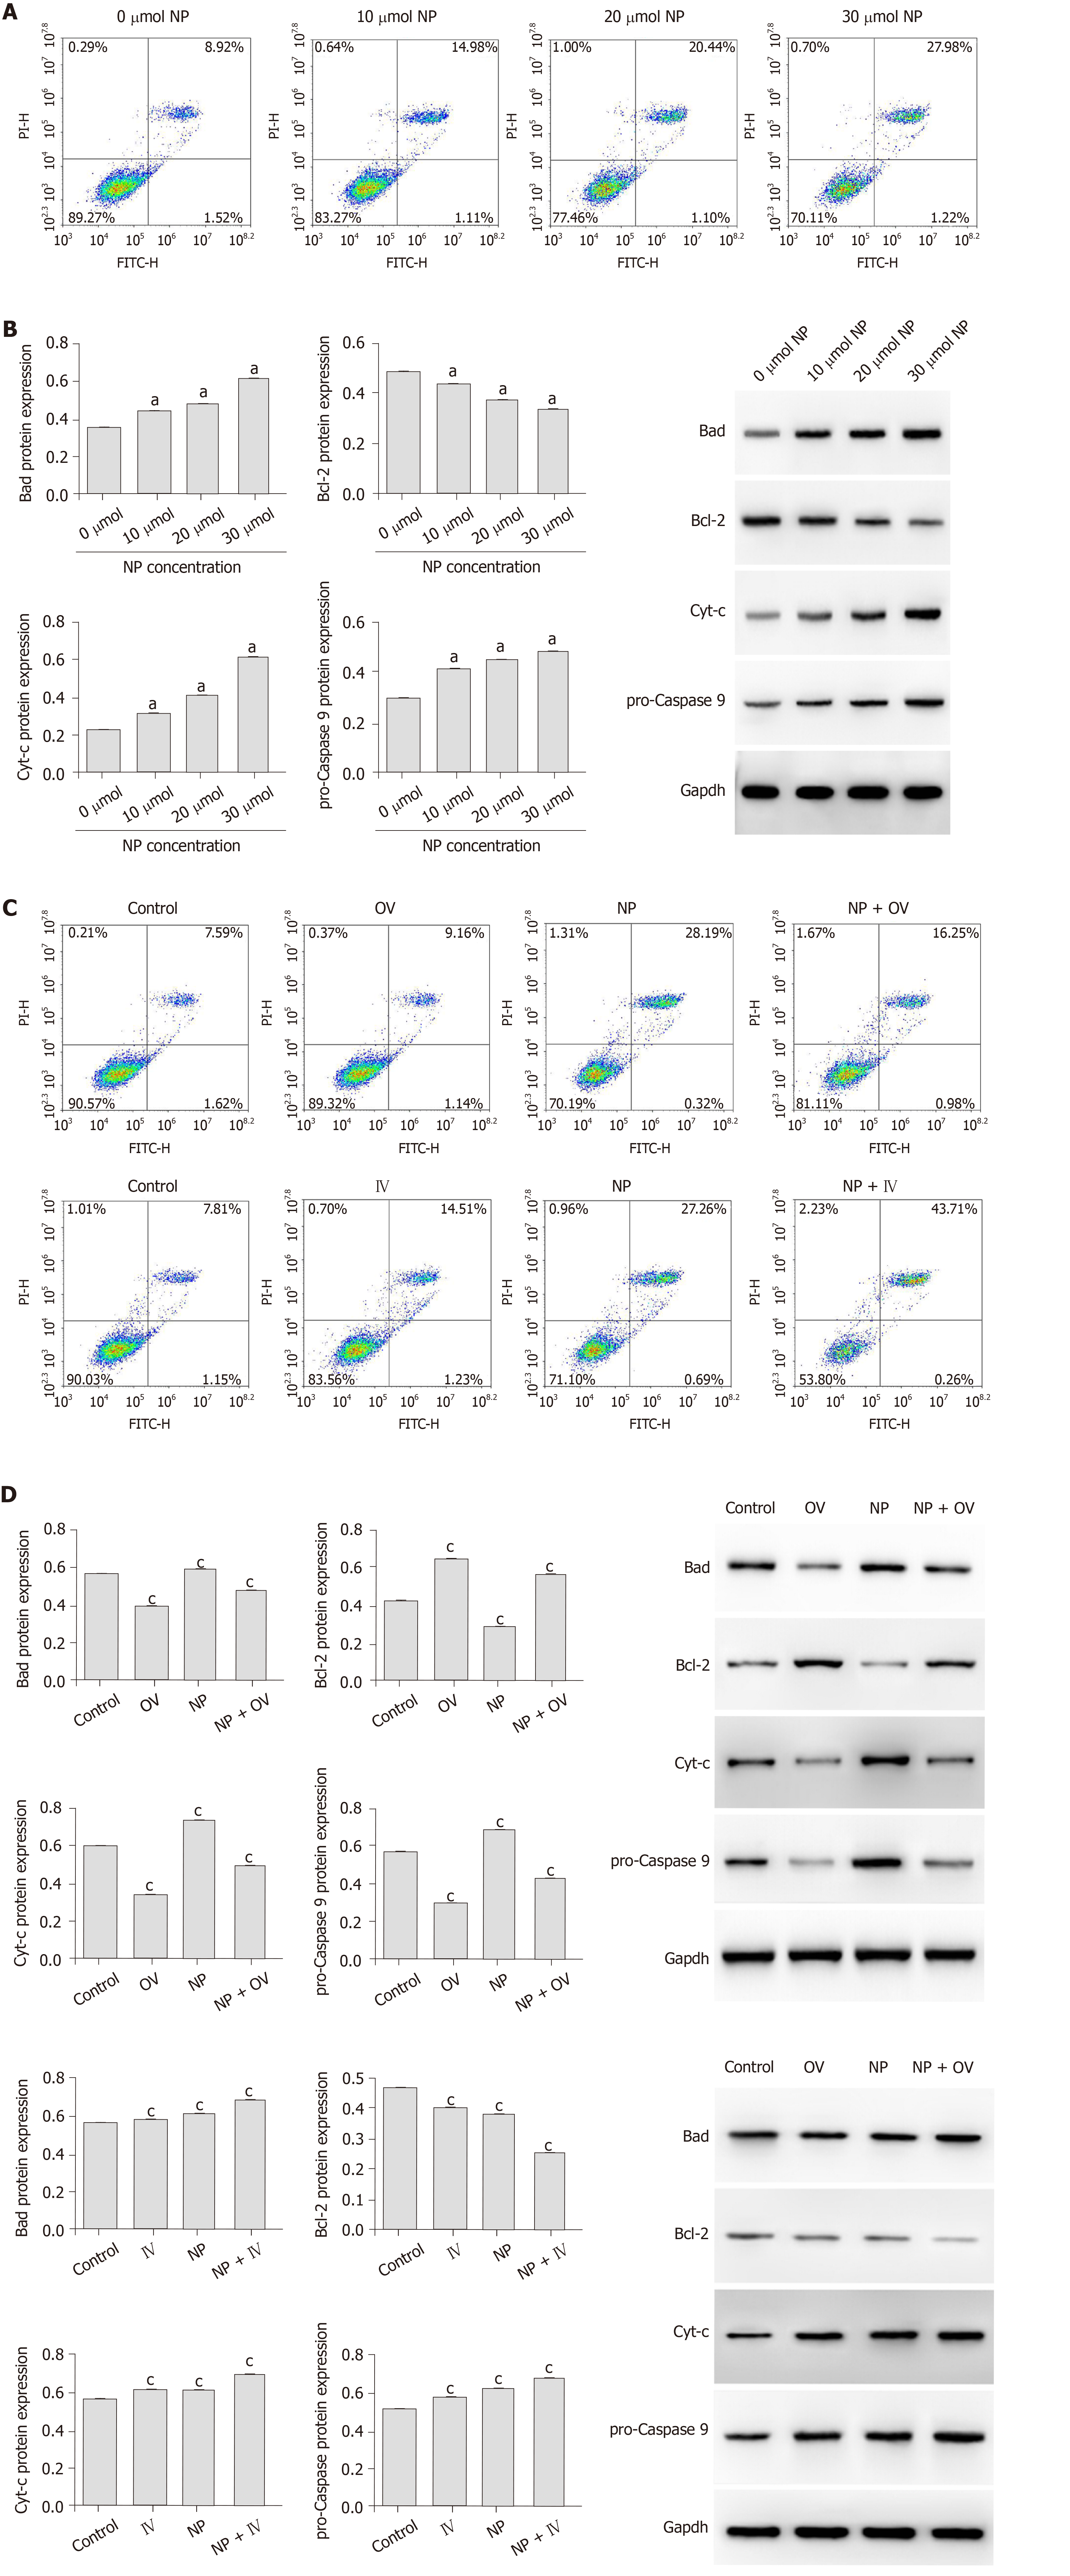
Figure 3 Effect of nonylphenol on apoptosis and oxidative stress in spermatogonial stem cells.
A: Detection of apoptosis by flow cytometry; B: Western blot of the protein expression of Bad, Bcl-2, Cyt-c, and pro-Caspase 9. The results are presented as the mean ± standard deviation, n = 3. aP < 0.05 vs 0 μmol NP; C: Effect of nonylphenol on spermatogonial stem cell apoptosis after mammalian target of rapamycin activation or inhibition; D: Expression of apoptosis-related protein detected by western blot. The results are presented as the mean ± standard deviation, n = 3. cP < 0.05 vs control. NP: Nonylphenol; Control: Control group, not subjected to any activator or inhibitor; NP: Nonylphenol group; OV: Mammalian target of rapamycin activator group; OV + NP: OV + NP group.
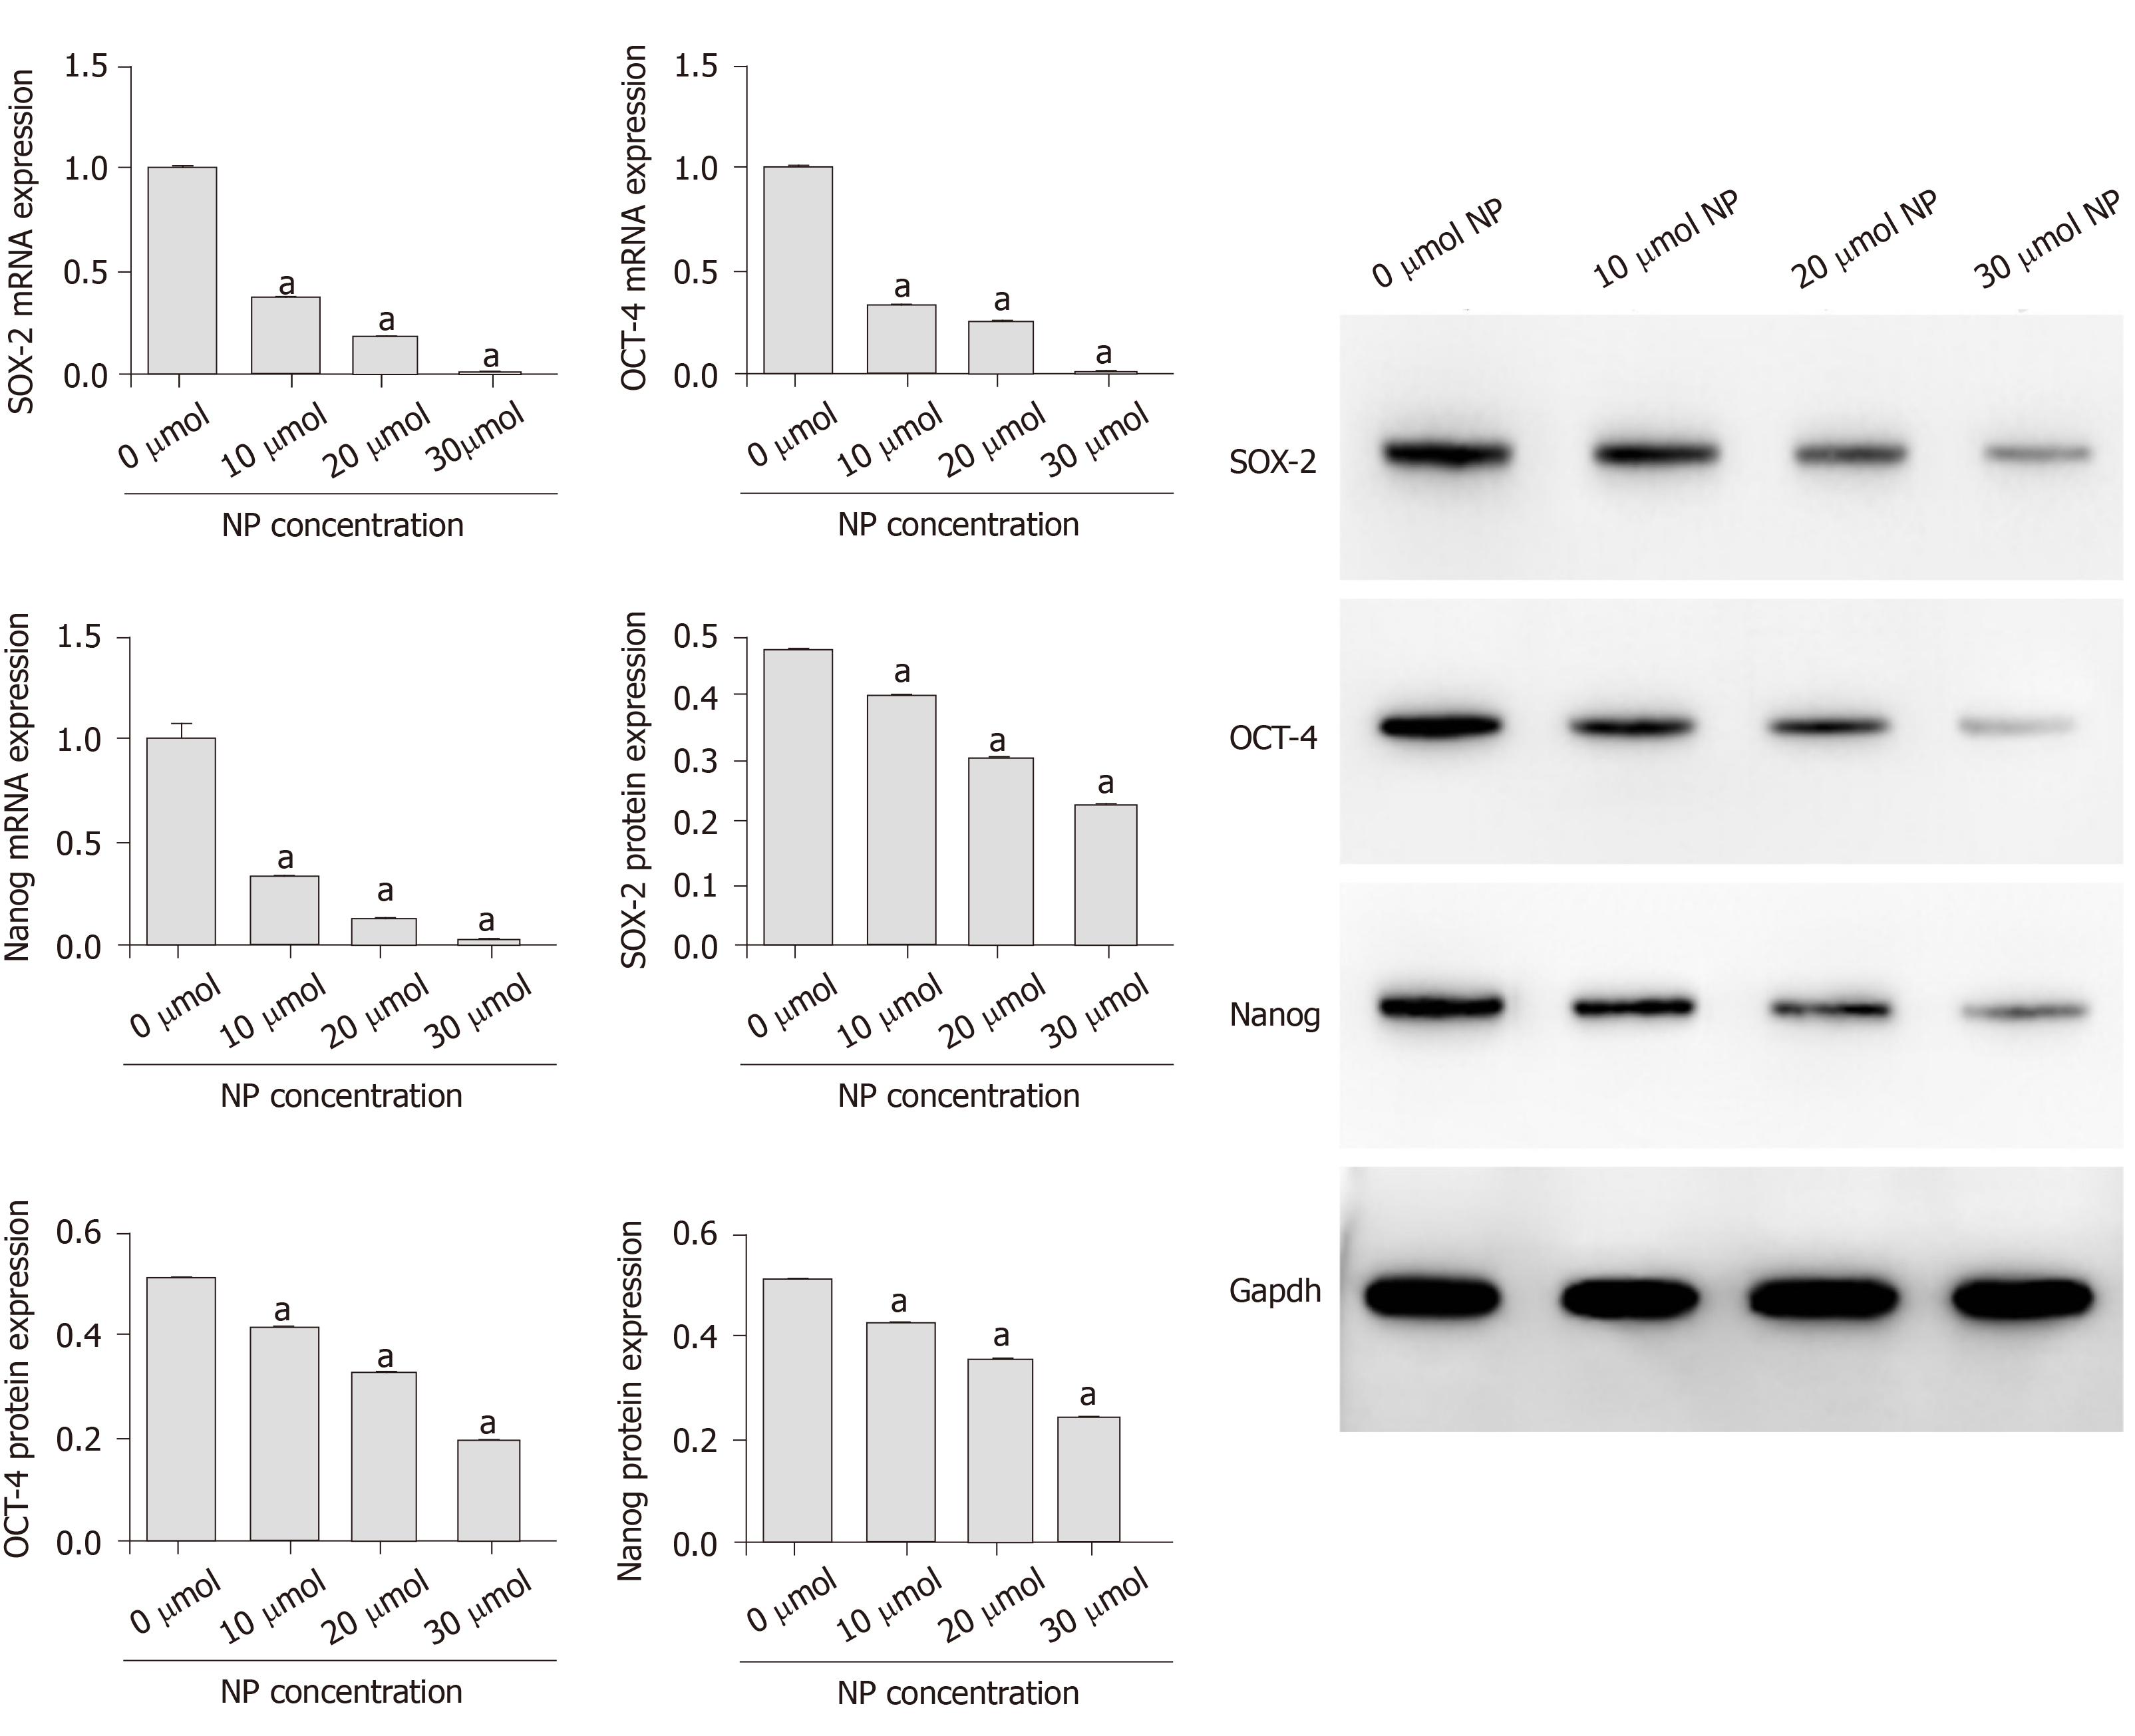
Figure 4 Effect of nonylphenol on stemness maintenance of spermatogonial stem cells.
mRNA and protein expression of SOX-2, OCT-4 and Nanog were measured by quantitative reverse transcription polymerase chain reaction and western blot, respectively. The results are presented as the mean ± standard deviation, n = 3. aP < 0.05 vs 0 μmol nonylphenol. NP: Nonylphenol.
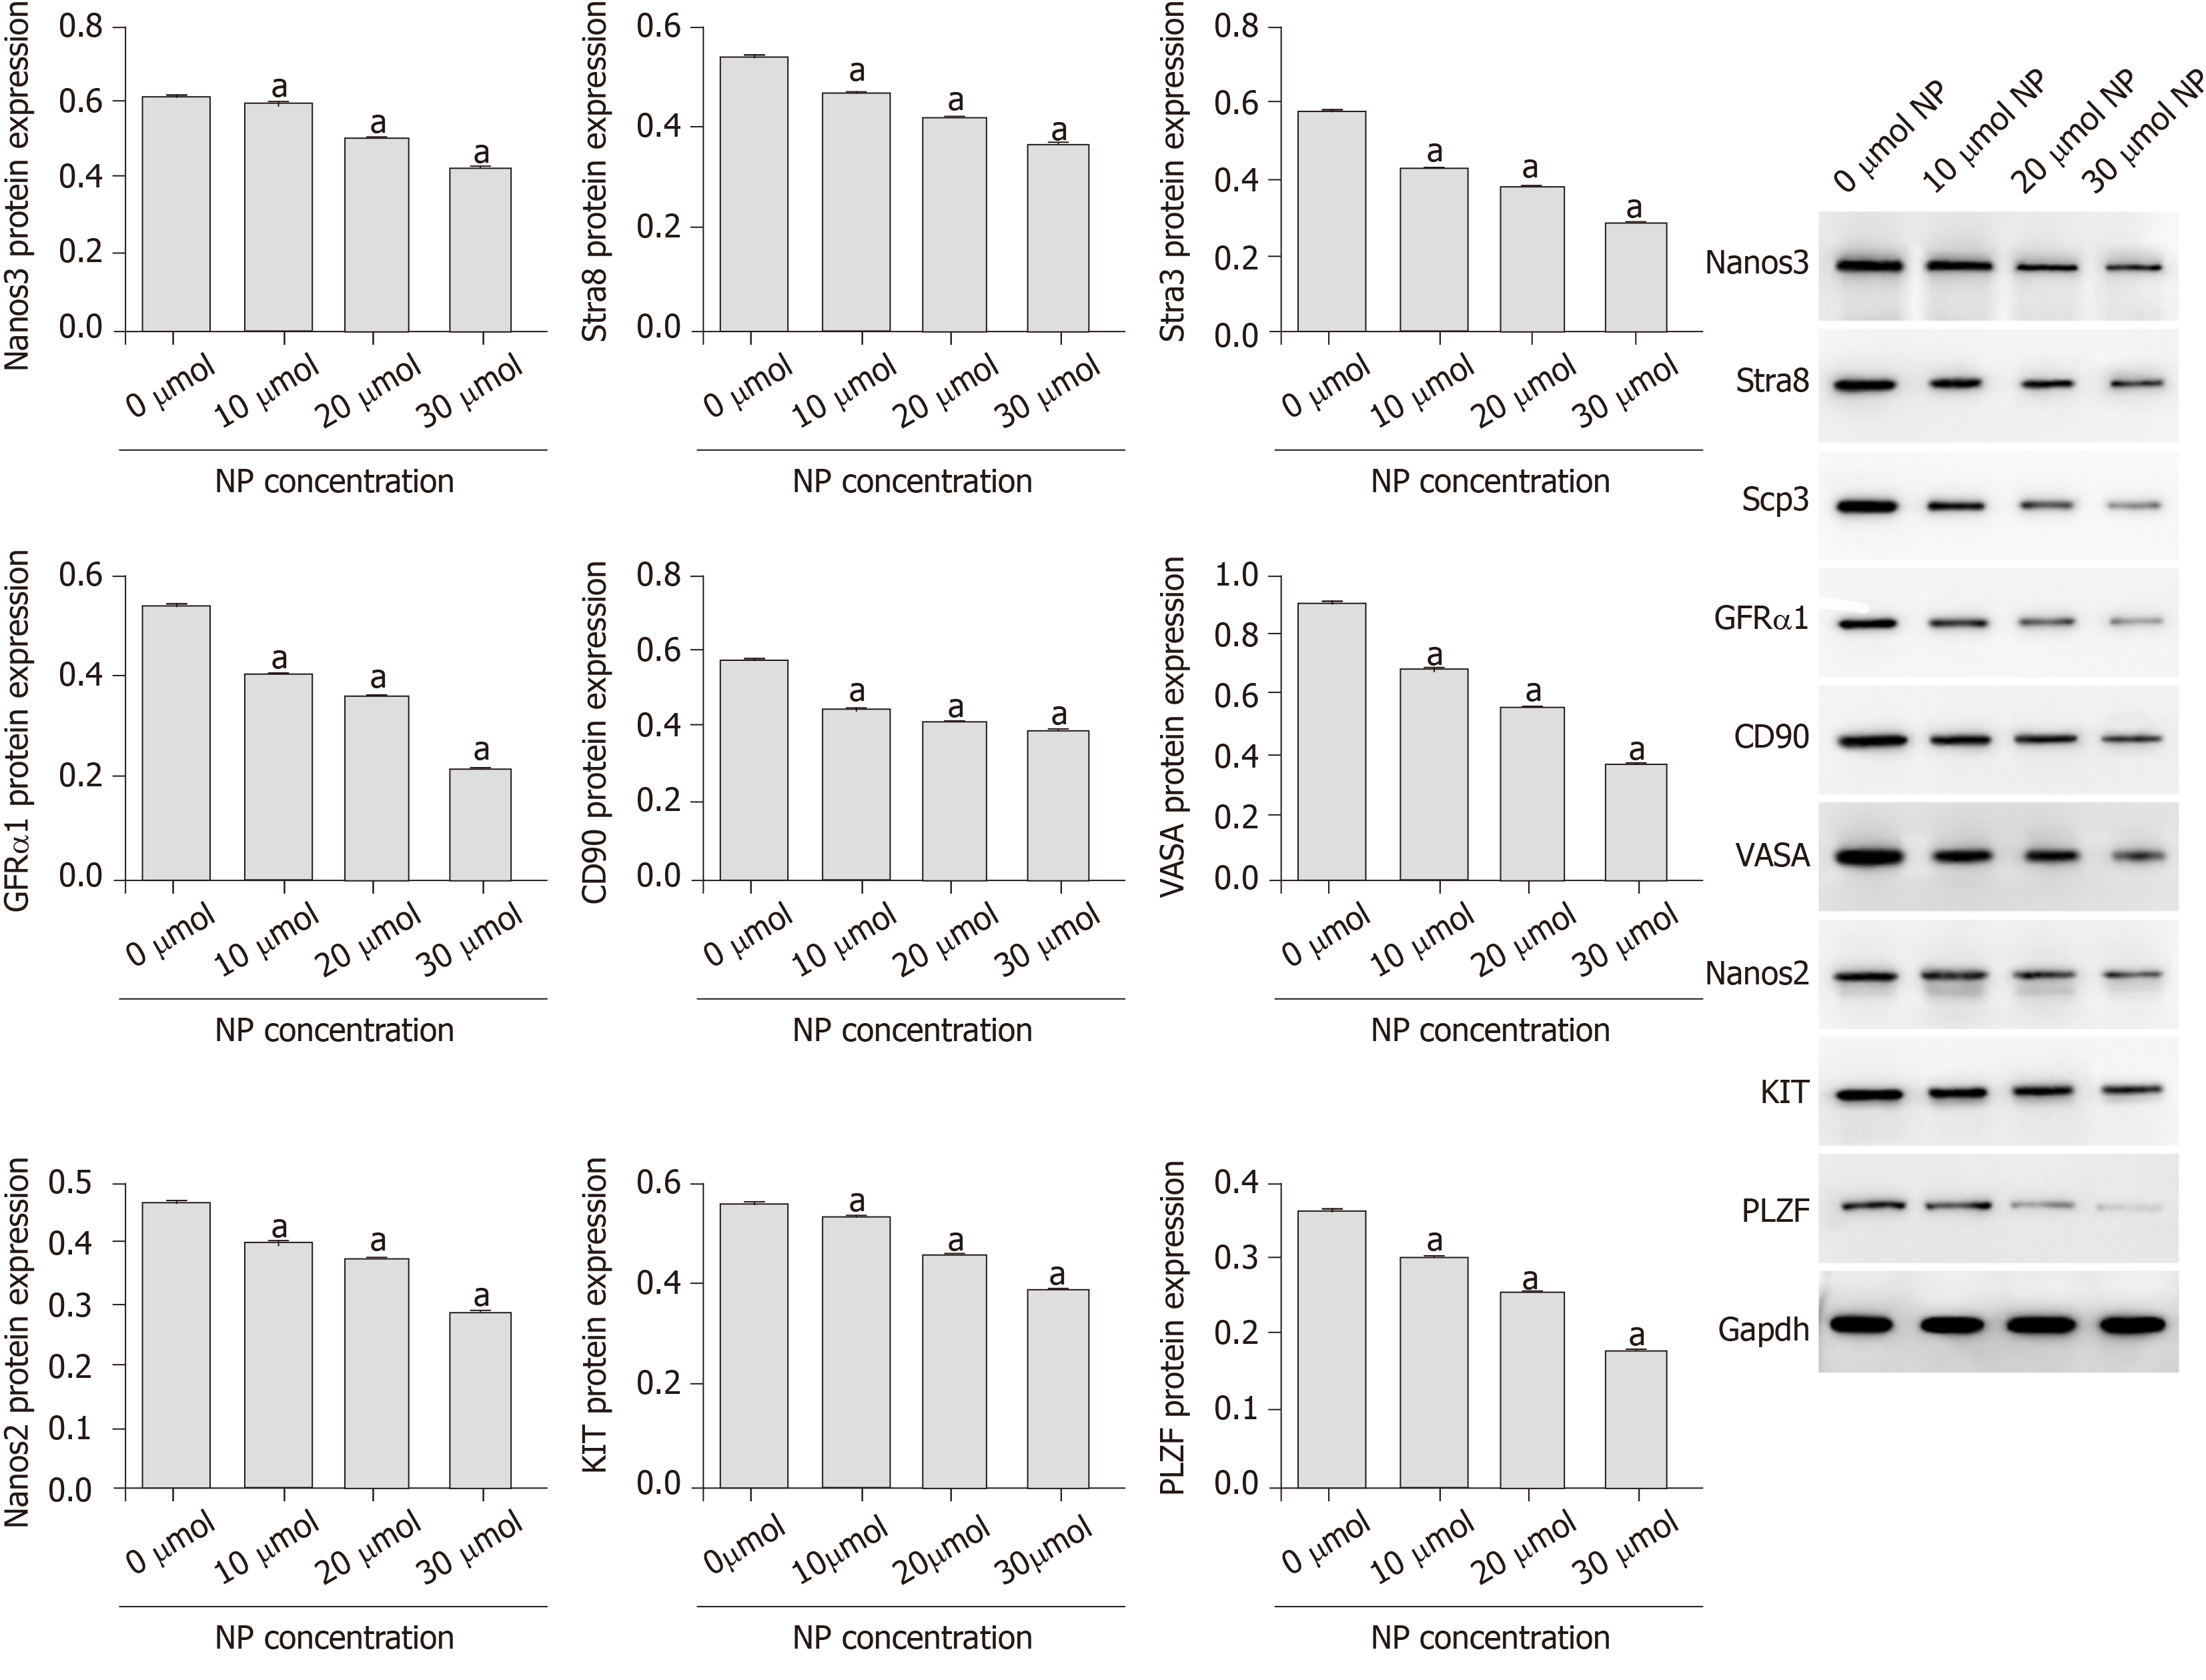
Figure 5 Effect of nonylphenol on differentiation of spermatogonial stem cells.
Protein expression of Nanos3, Stra8, Scp3, GFRα1, CD90, VASA, Nanos2, KIT and PLZF was measured by western blot. The results are presented as the mean ± standard deviation, n = 3. aP < 0.05 vs 0 μmol nonylphenol. NP: Nonylphenol.
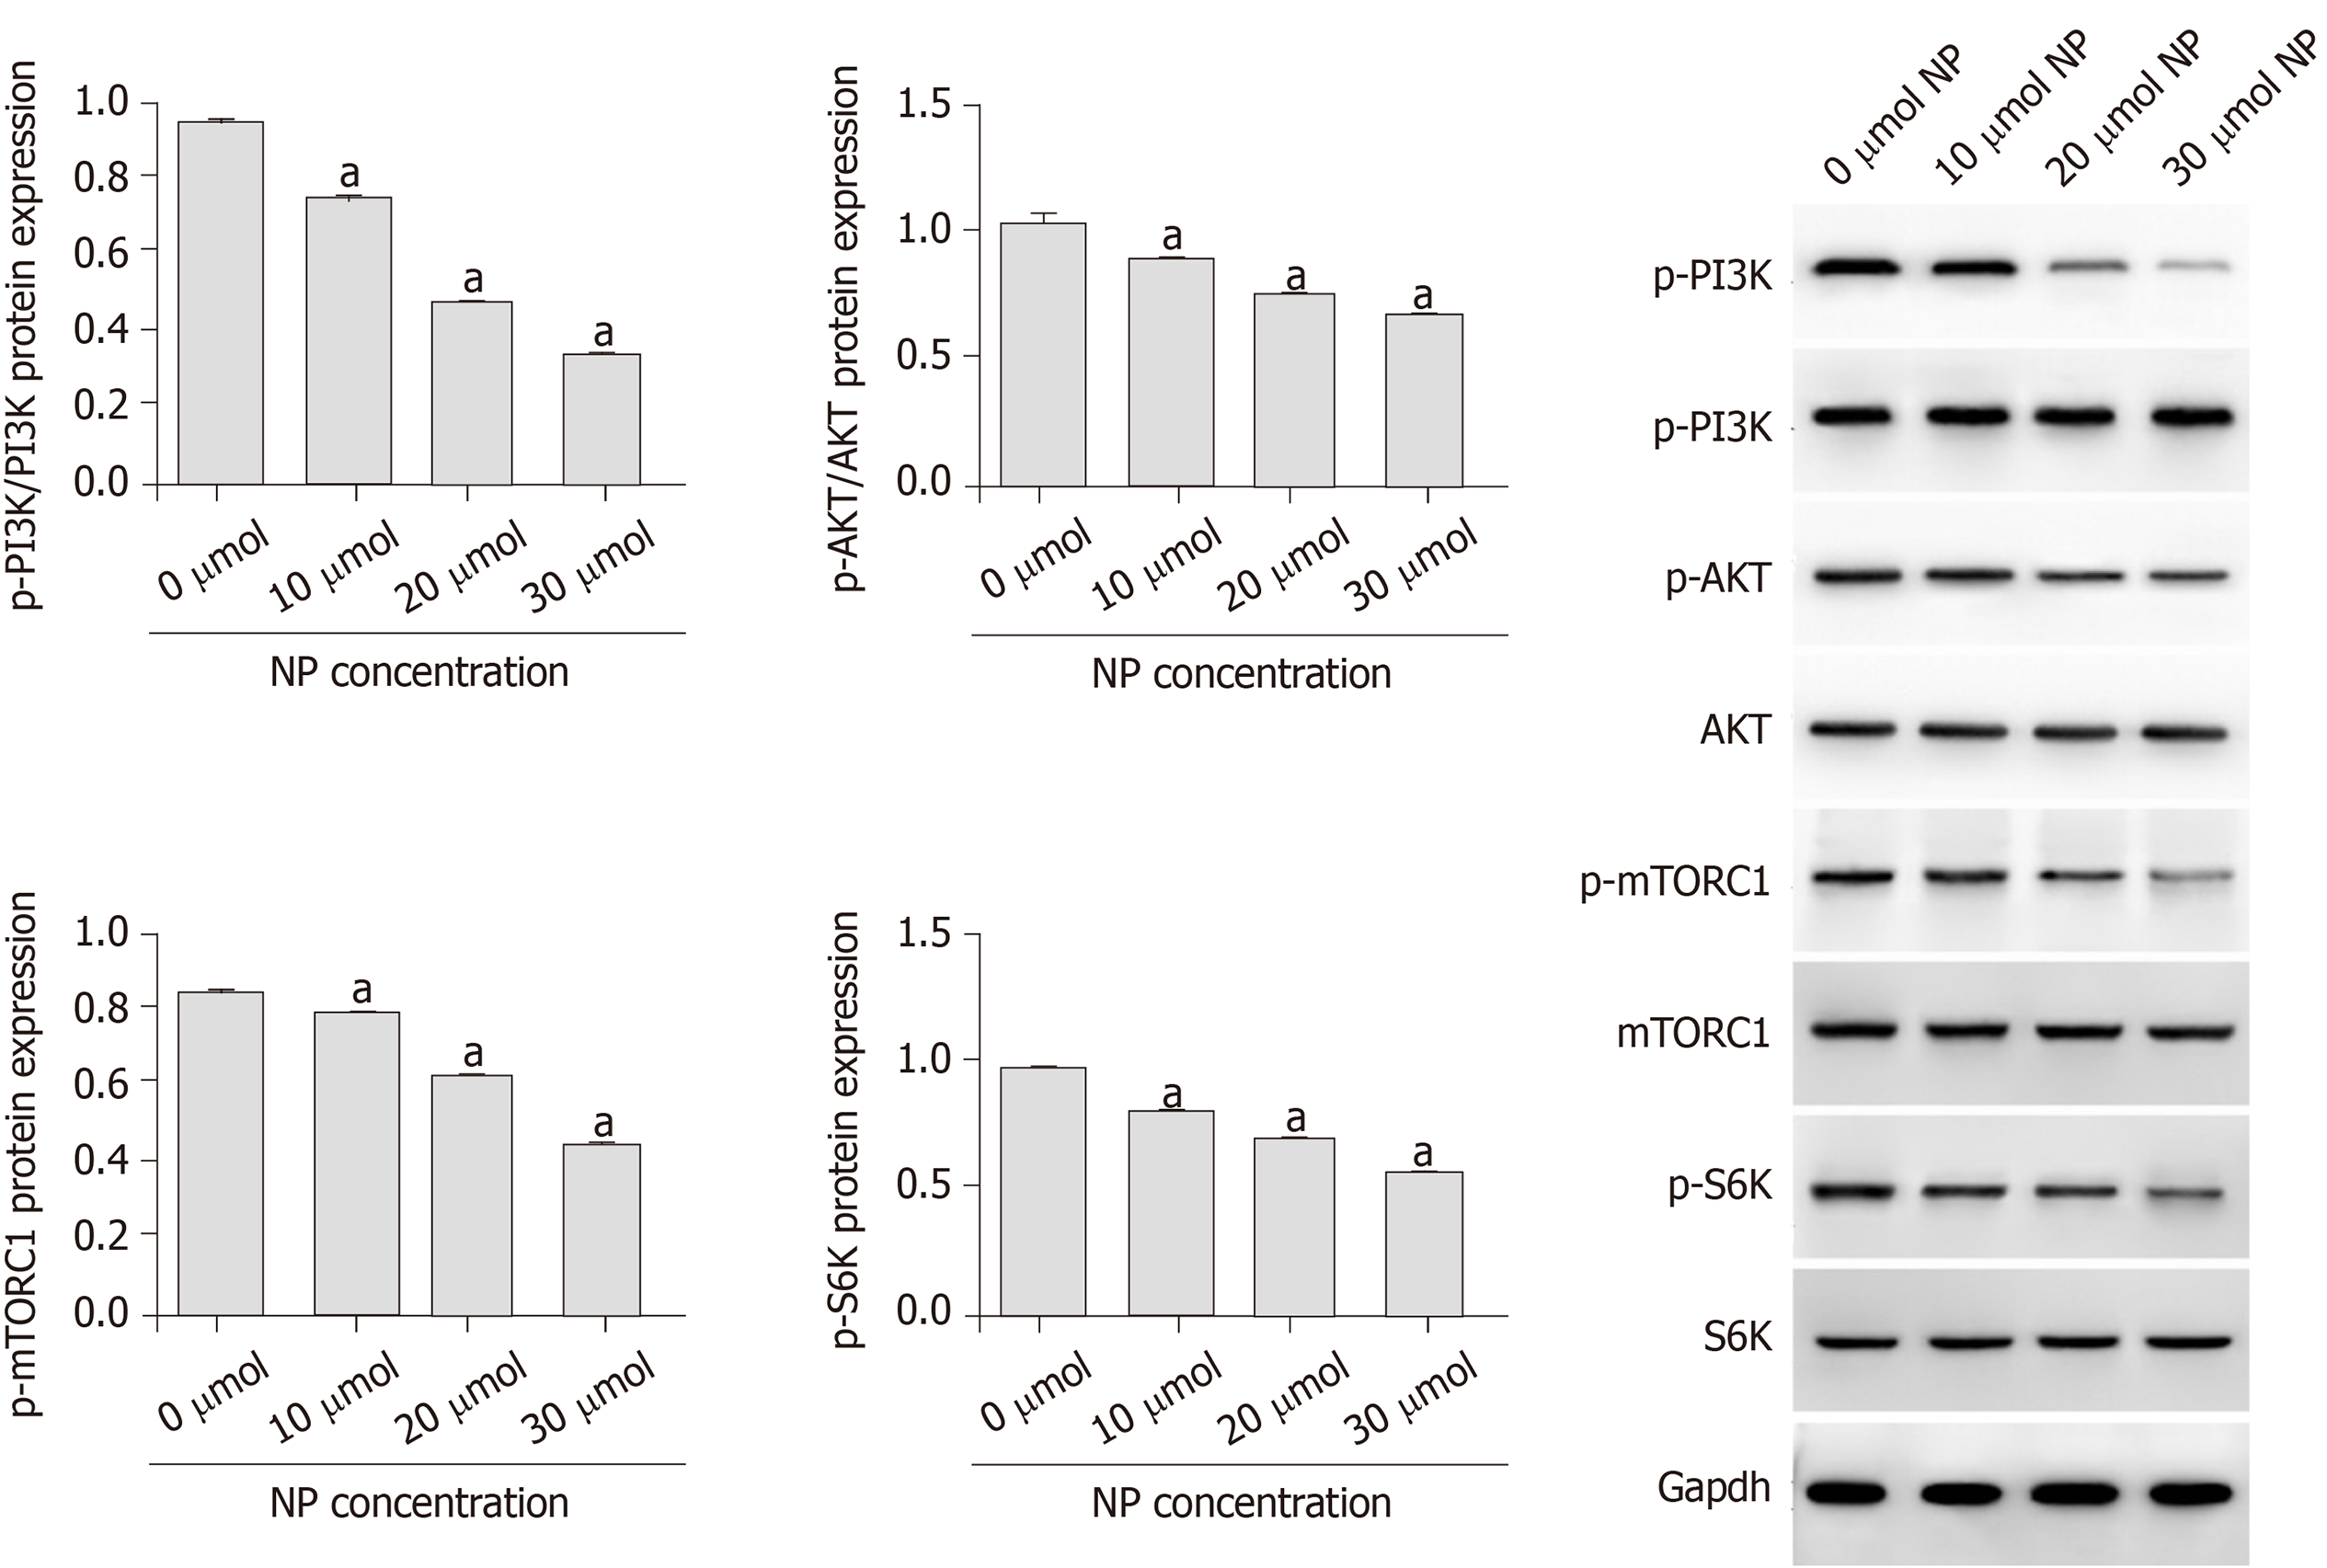
Figure 6 Effect of nonylphenol on the expression of proteins associated with phosphatidylinositol-3-kinase/protein kinase B/mammalian target of rapamycin signaling.
The results are presented as the mean ± standard deviation, n = 3. aP < 0.05 vs 0 μmol nonylphenol. NP: Nonylphenol.
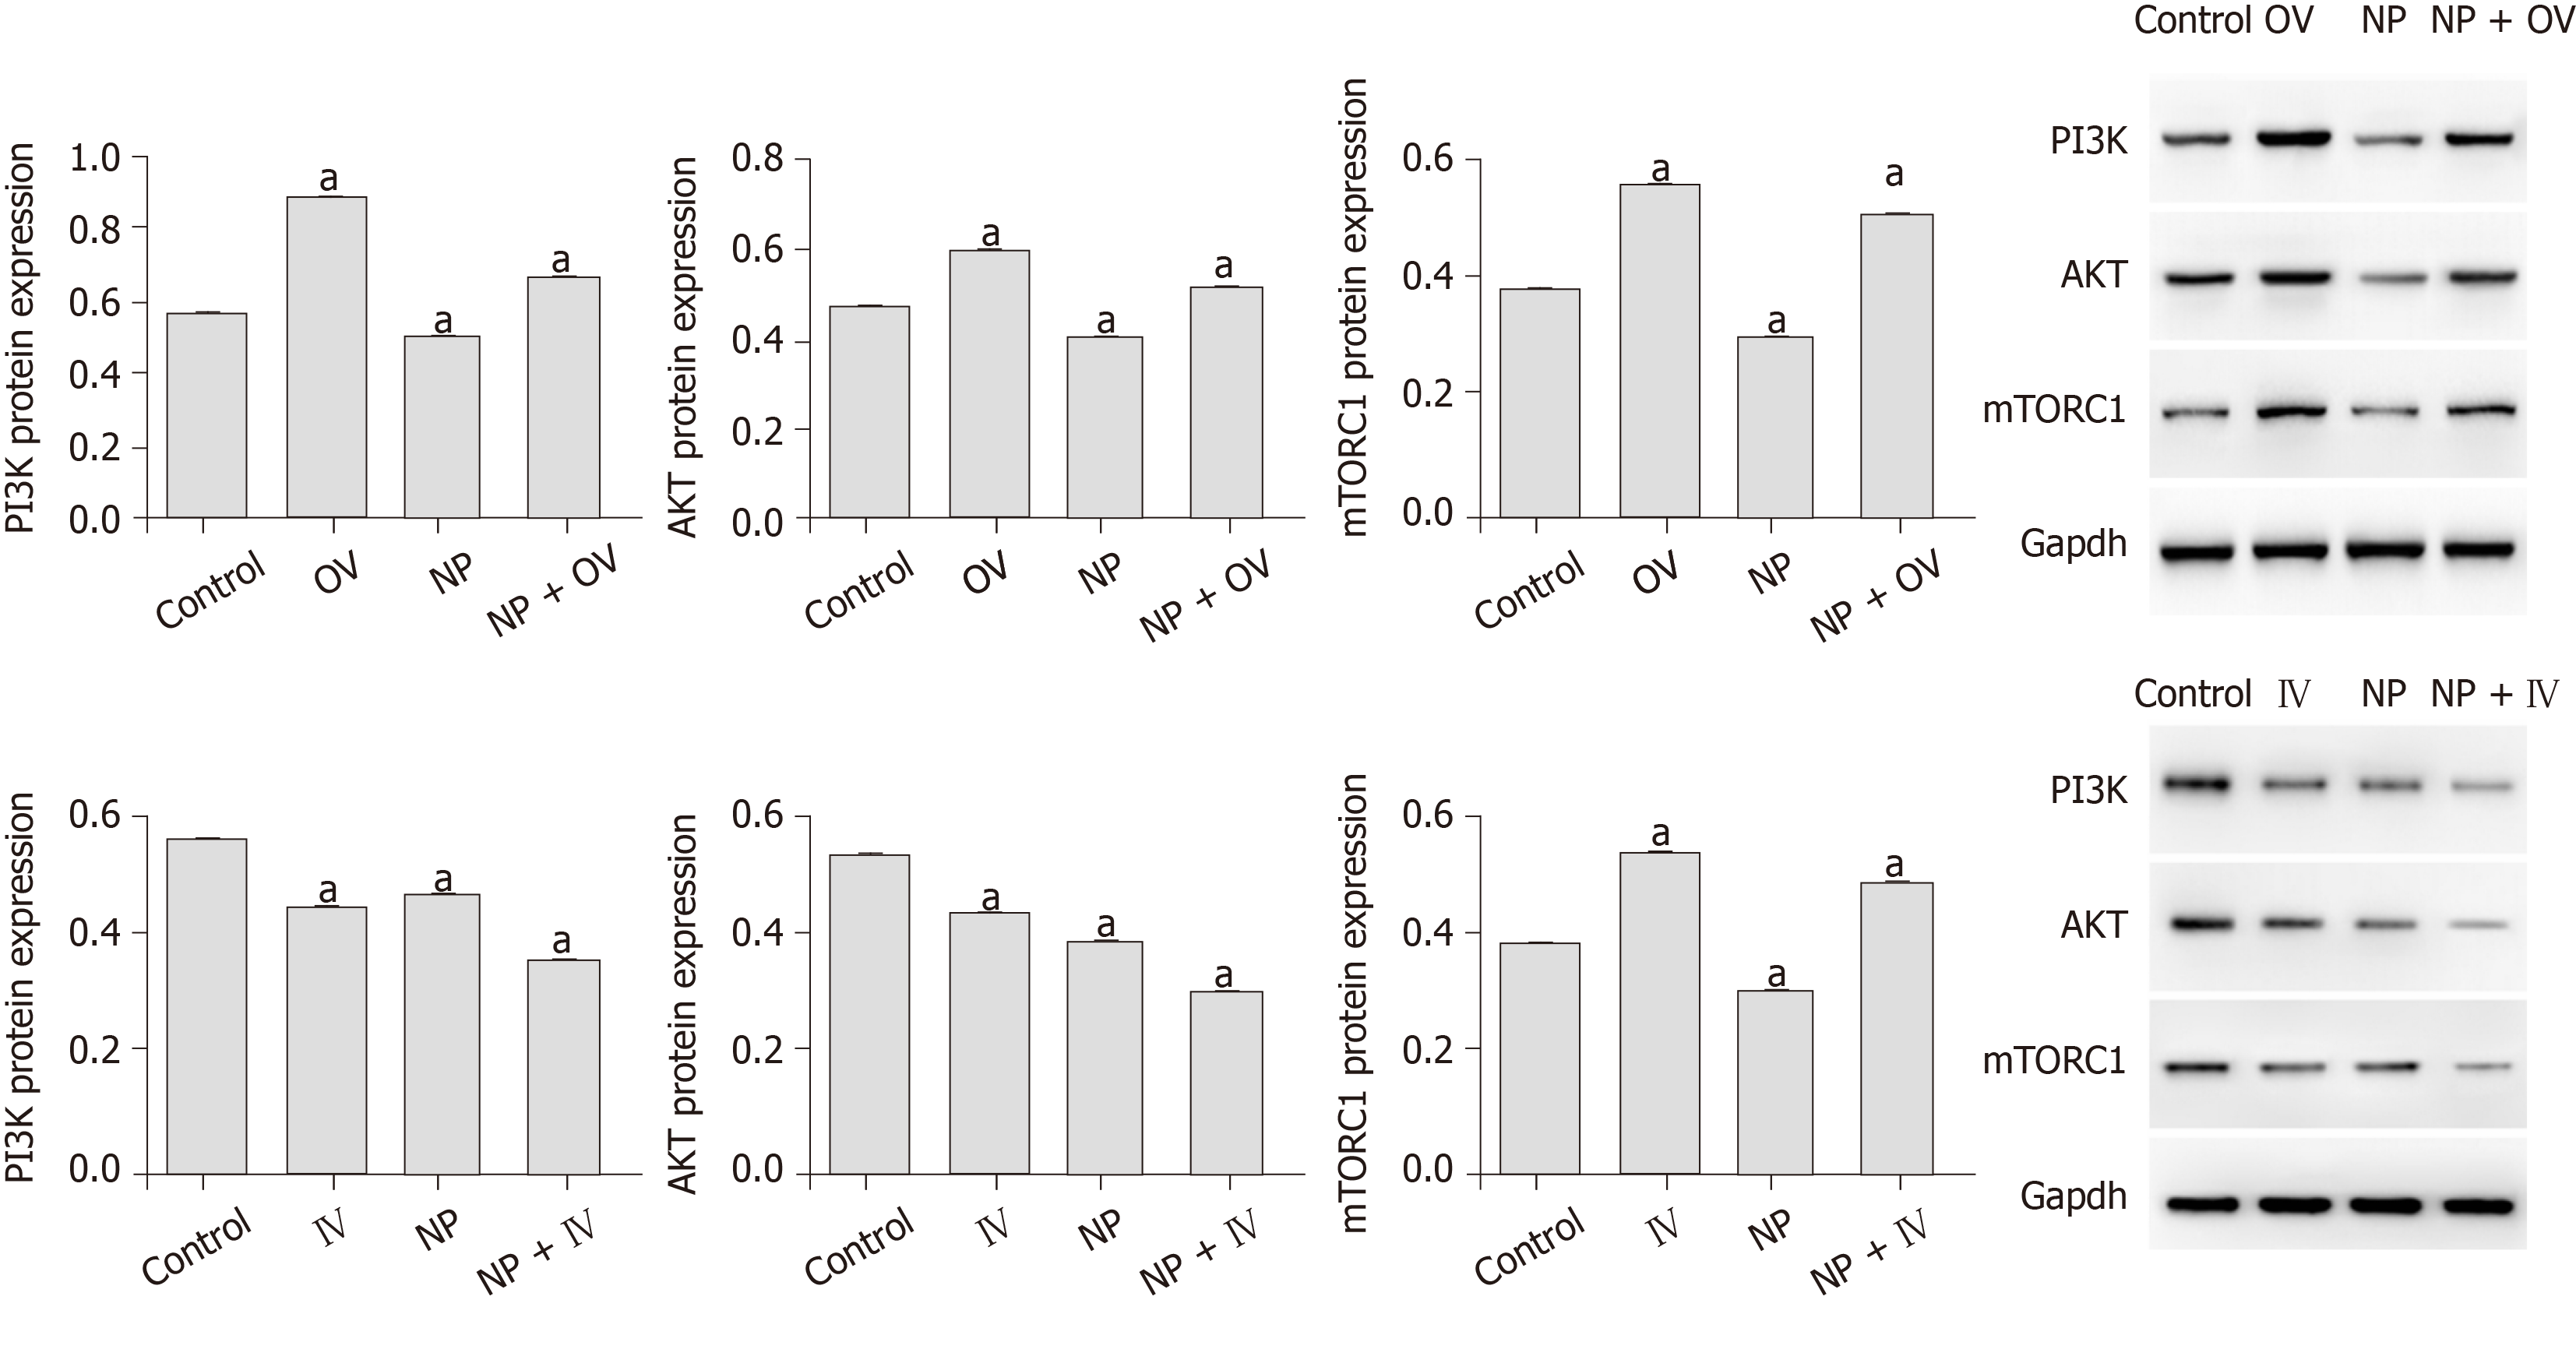
Figure 7 Effects of nonylphenol on phosphatidylinositol-3-kinase/protein kinase B/mammalian target of rapamycin signaling pathway after mammalian target of rapamycin activation or inhibition.
The results are presented as the mean ± standard deviation, n = 3. aP < 0.05 vs Control. Control: Control group, not subjected to any activator or inhibitor; NP: Nonylphenol group; OV: Mammalian target of rapamycin activator group; IV: Mammalian target of rapamycin inhibitor group; OV + NP: OV + NP group; IV + NP: IV + NP group.
- Citation: Lei JH, Yan W, Luo CH, Guo YM, Zhang YY, Wang XH, Su XJ. Cytotoxicity of nonylphenol on spermatogonial stem cells via phosphatidylinositol-3-kinase/protein kinase B/mammalian target of rapamycin pathway. World J Stem Cells 2020; 12(6): 500-513
- URL: https://www.wjgnet.com/1948-0210/full/v12/i6/500.htm
- DOI: https://dx.doi.org/10.4252/wjsc.v12.i6.500


