Copyright
©The Author(s) 2020.
World J Stem Cells. Dec 26, 2020; 12(12): 1640-1651
Published online Dec 26, 2020. doi: 10.4252/wjsc.v12.i12.1640
Published online Dec 26, 2020. doi: 10.4252/wjsc.v12.i12.1640
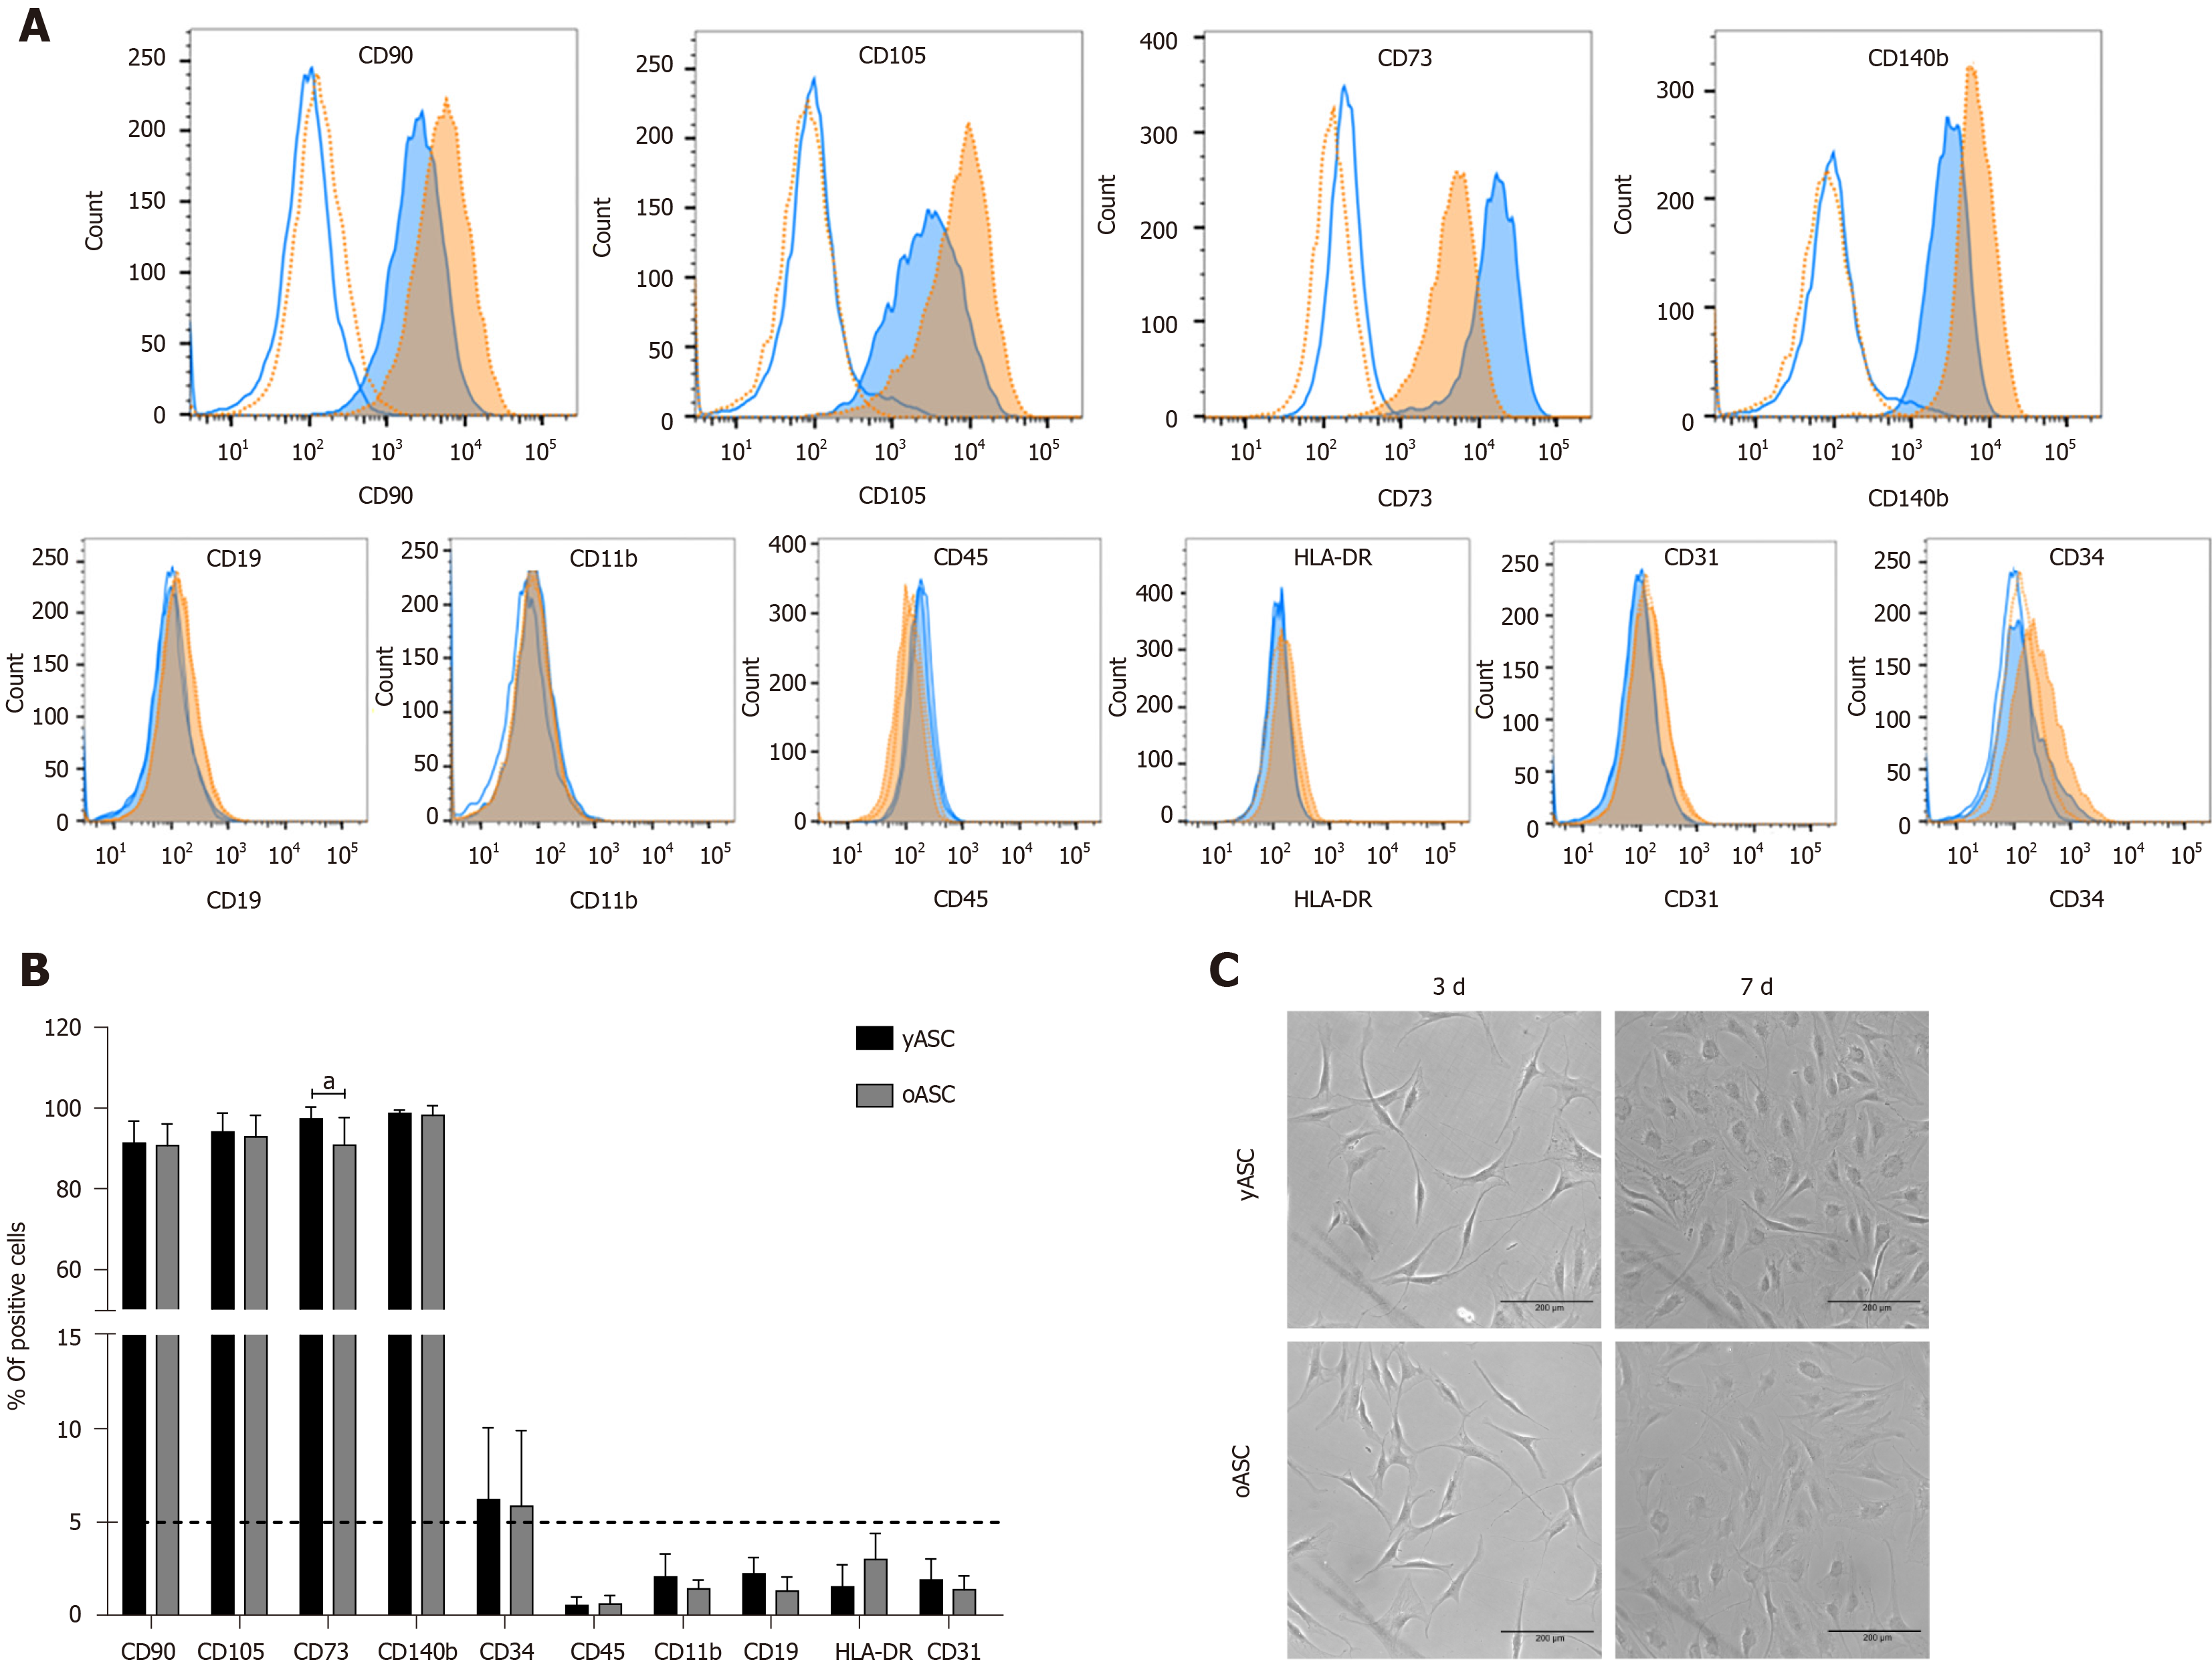
Figure 1 Immunophenotypic characterization of young and old human adipose-derived stromal/stem cells.
A: Representative flow cytometry histograms of surface markers in human adipose-derived stromal/stem cells (hASCs) derived from young and old donors. Blue lines represent the young hASCs (yASCs) results, in which blue tinted histograms represent the stained cells and single lines represent specific isotype controls. Orange-dotted lines represent the old hASCs (oASCs) results, in which orange tinted histograms represent the stained cells and single dotted lines represent specific isotype controls; B: Quantification of the percentage of positive cells for each surface marker (yASCs: n = 9, oASCs: n = 9). Each bar represents the mean ± SD, aP < 0.05; C: Representative images of yASC and oASC morphology after 3 d and 7 d of culture. Scale bar = 200 µm.
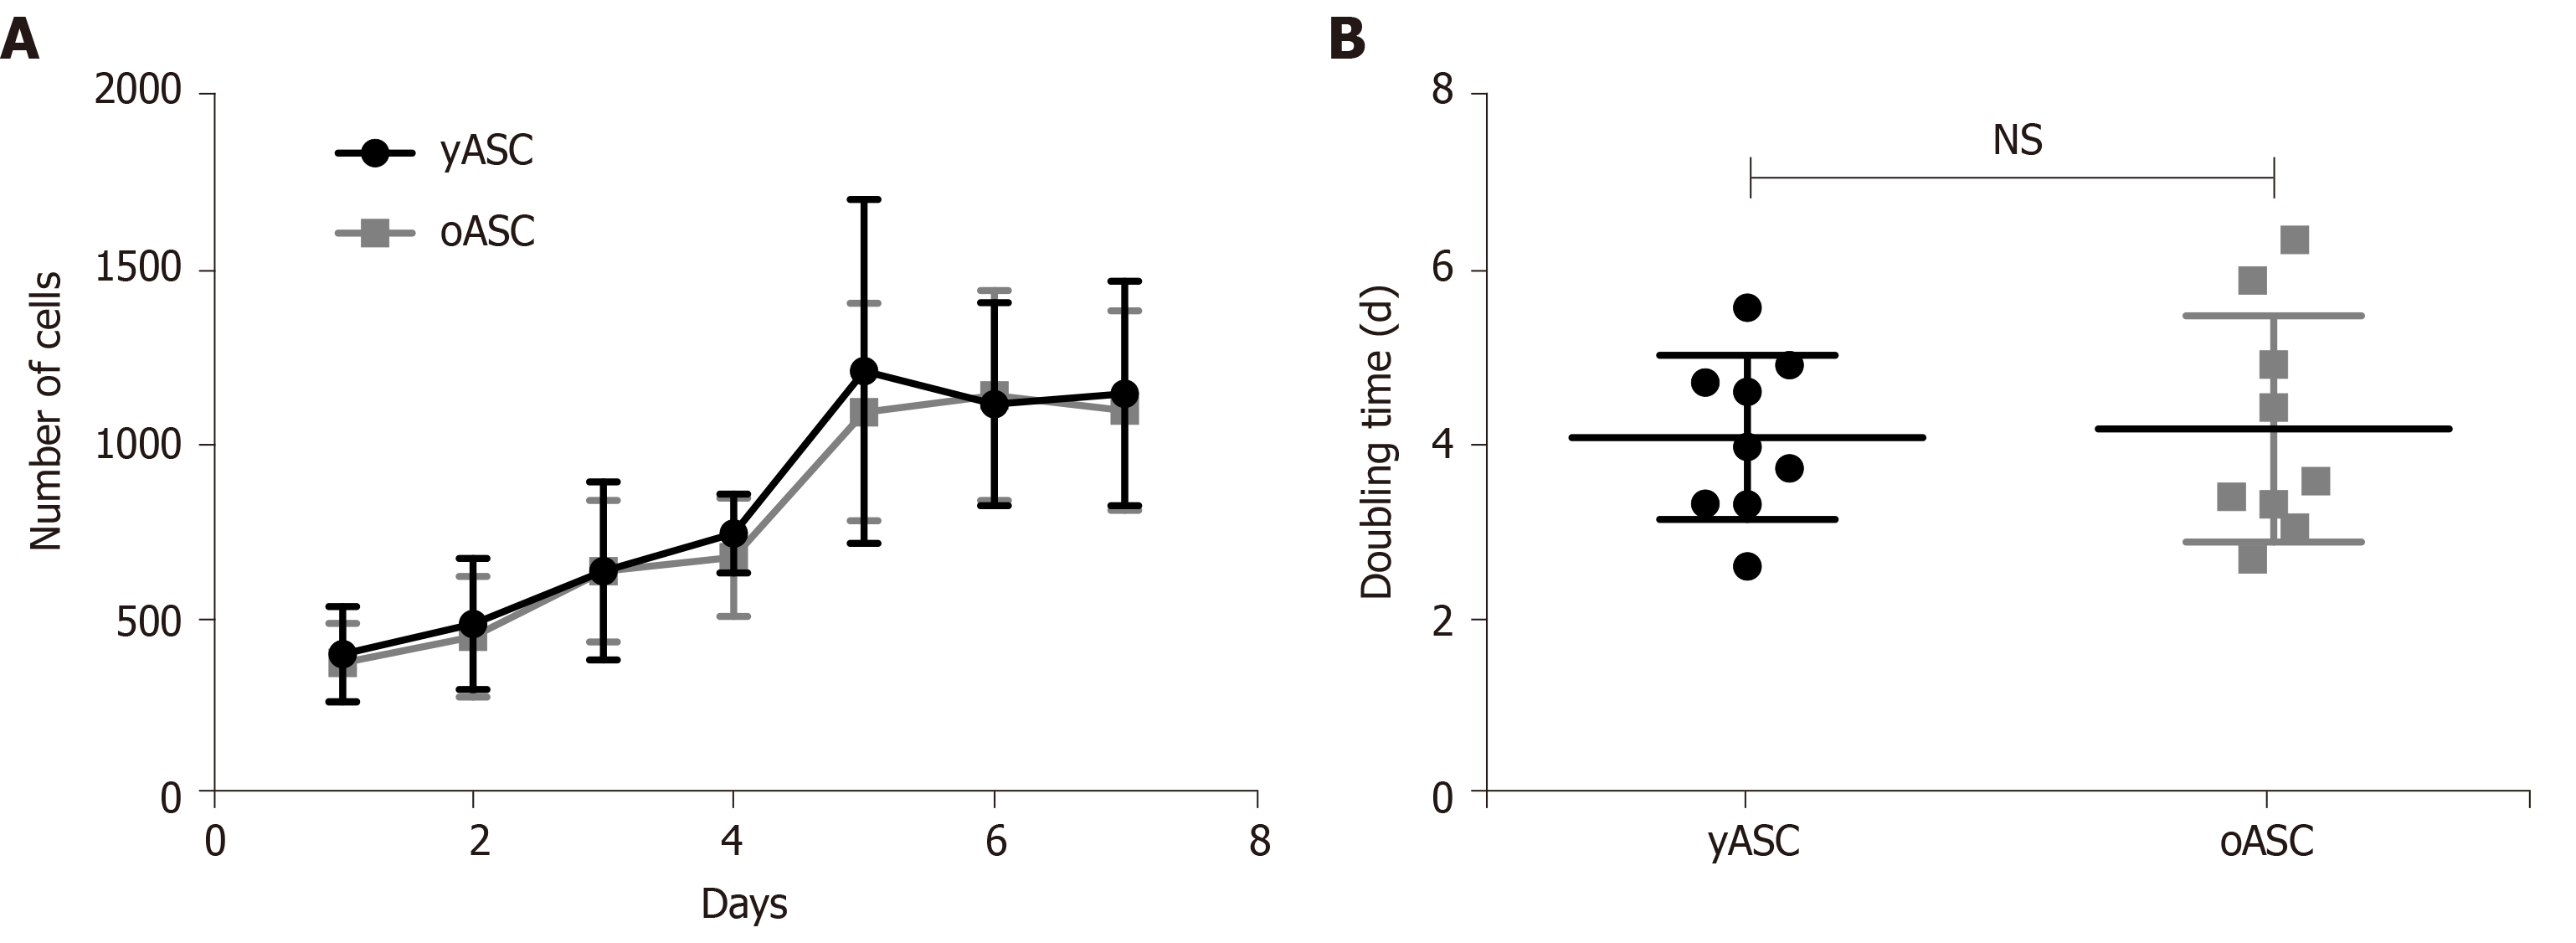
Figure 2 Growth kinetics of human adipose-derived stromal/stem cells from different age groups.
A: Determination of cell growth curves of human adipose-derived stromal/stem cells (hASCs) from both age groups over seven days of cell culture; B: Population doubling time of hASCs from both age groups over seven days of cell culture. The results are expressed as the mean ± SD. In Figure 2B, data were compared using a t test. NS: Nonsignificant differences.
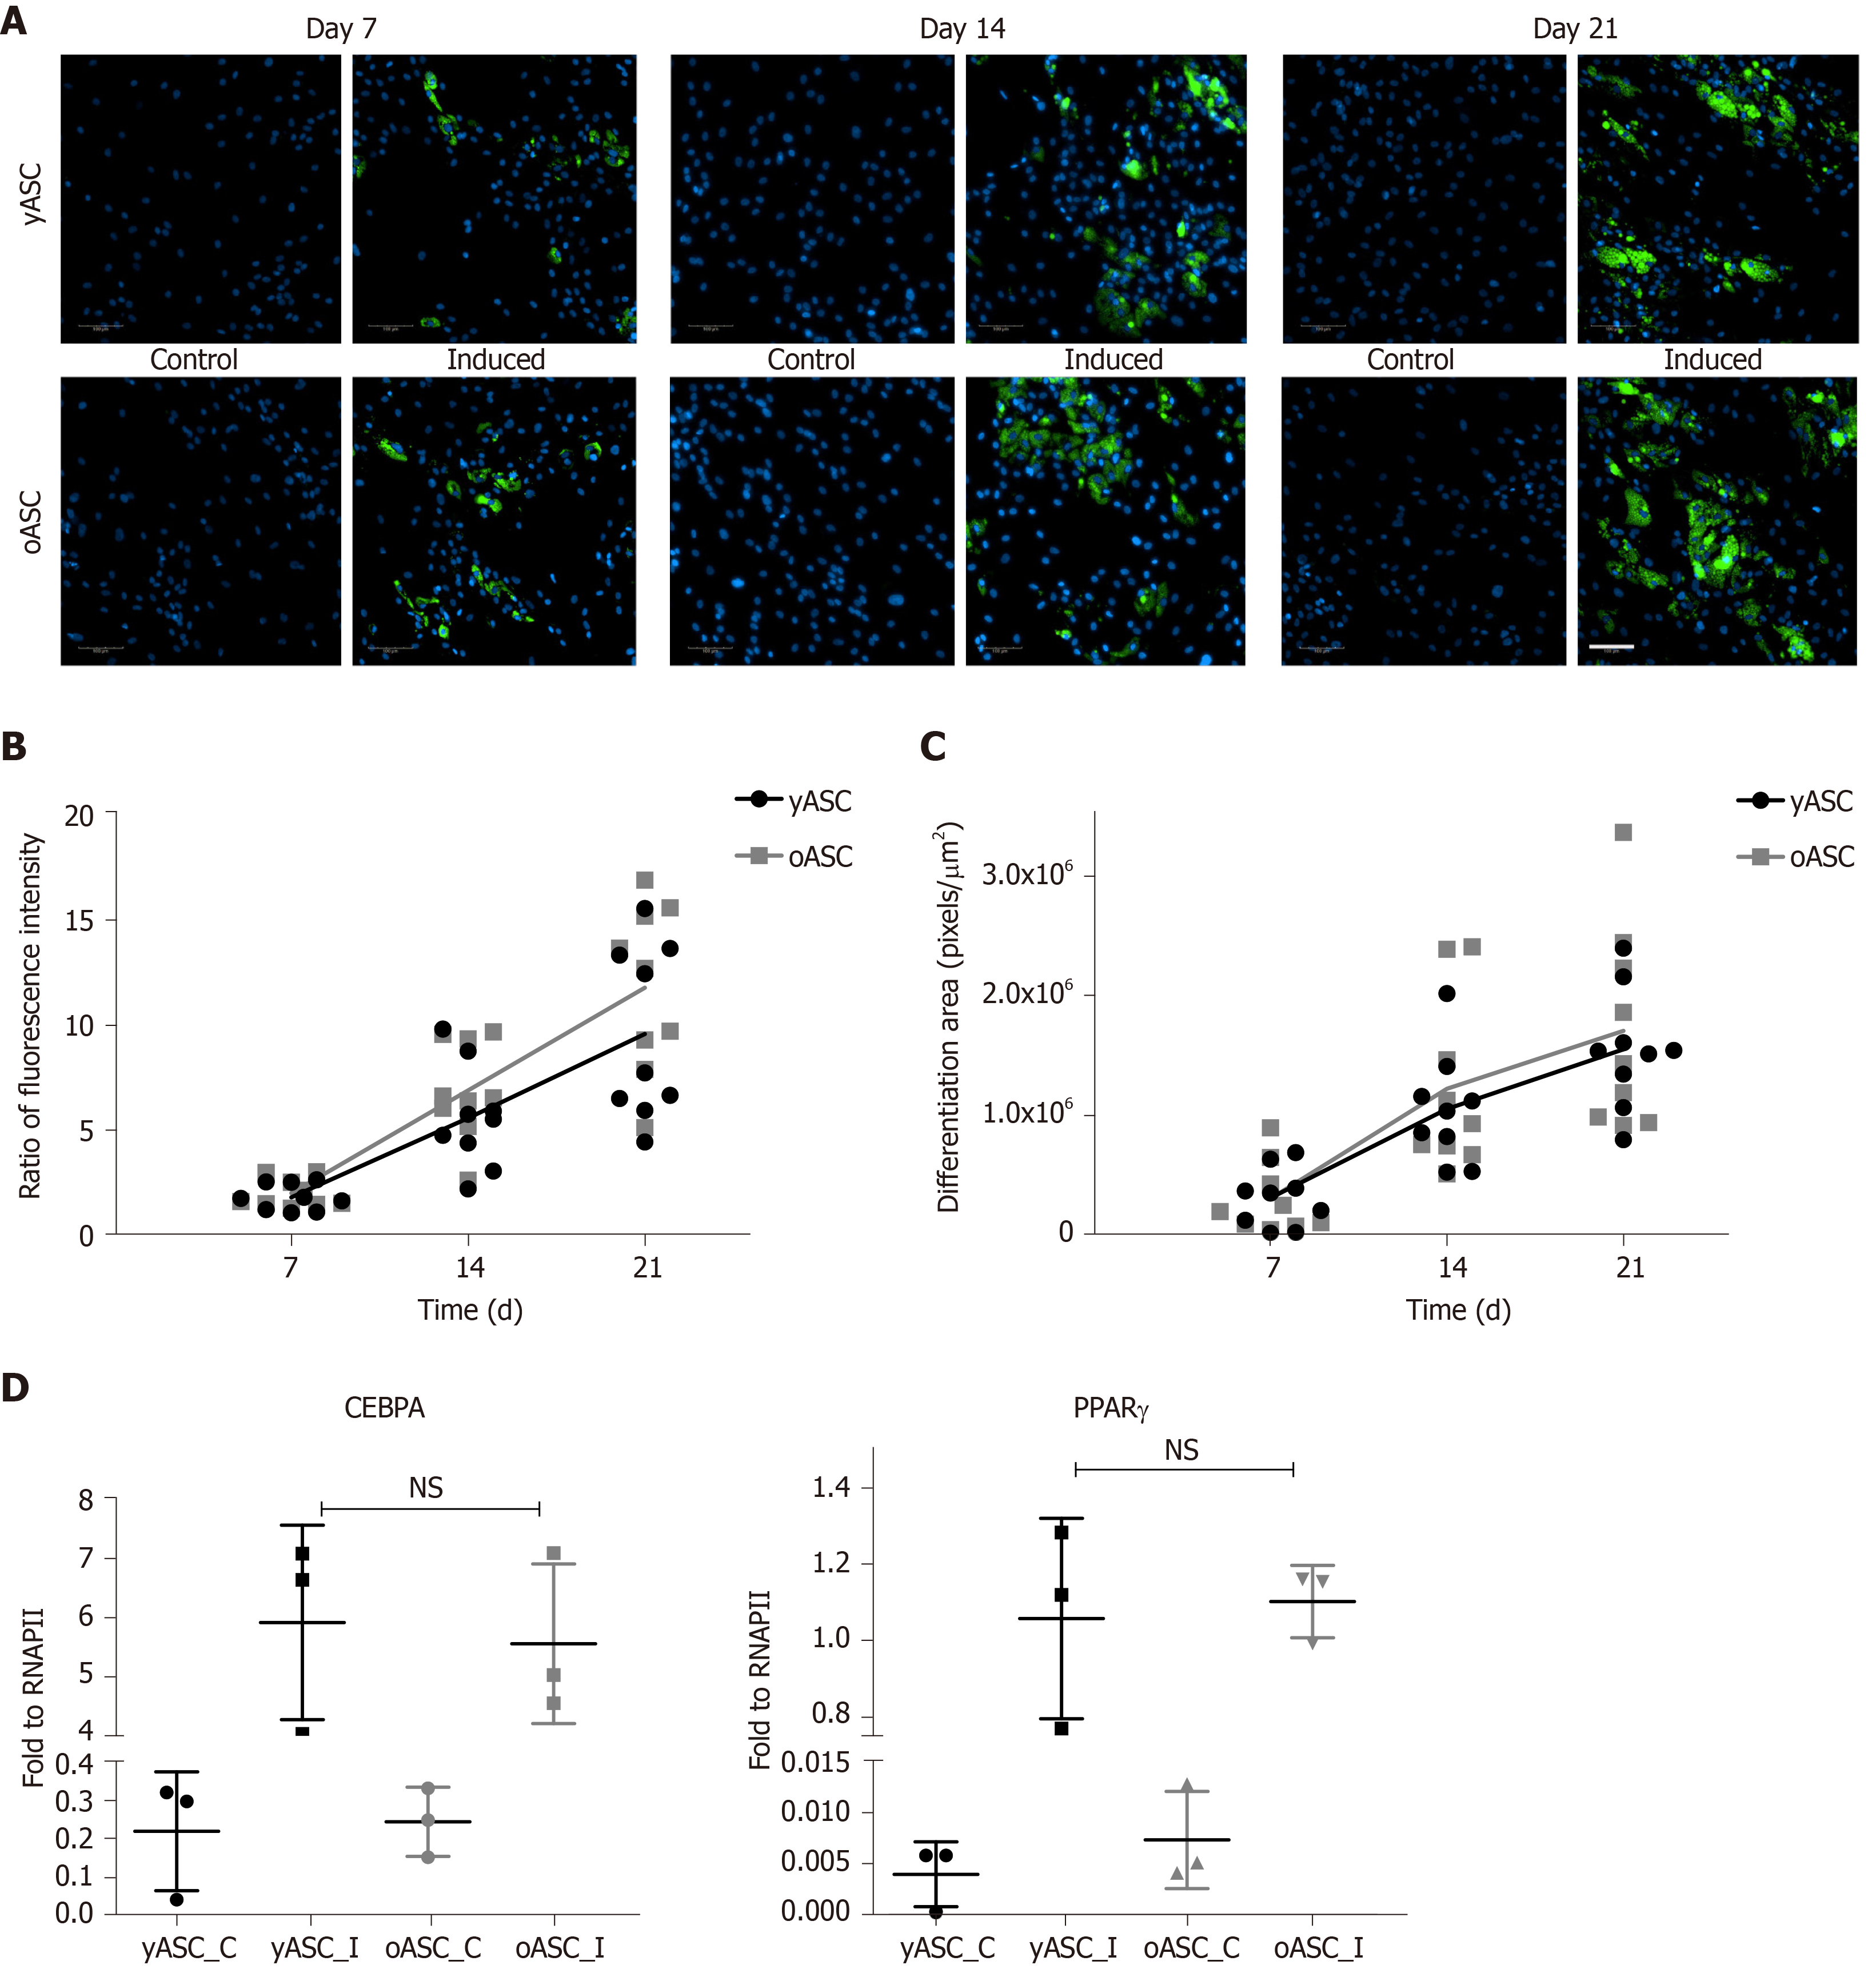
Figure 3 Adipogenesis differentiation analysis.
A: Representative images of noninduced (control) and adipogenic-induced human adipose-derived stromal/stem cells (hASCs) from young hASC (yASC) and old hASC (oASC) donors for 7 d, 14 d and 21 d. Lipid droplets were stained green with Nile red fluorescent dye, and nuclei were stained blue by DAPI (Scale bar: 100 μm). B: Quantitative analysis was performed by measuring the fluorescence of Nile red stain (fluorescence microplate reader); C: Quantitative analysis was performed by measuring the intracellular stained area with Nile red (Operetta®); D: Expression levels of CEBPA and PPARγ2 mRNA after adipogenic induction of yASCs and oASCs. Data are represented as the mean ± SD and are compared using a t test. NS: Nonsignificant differences.
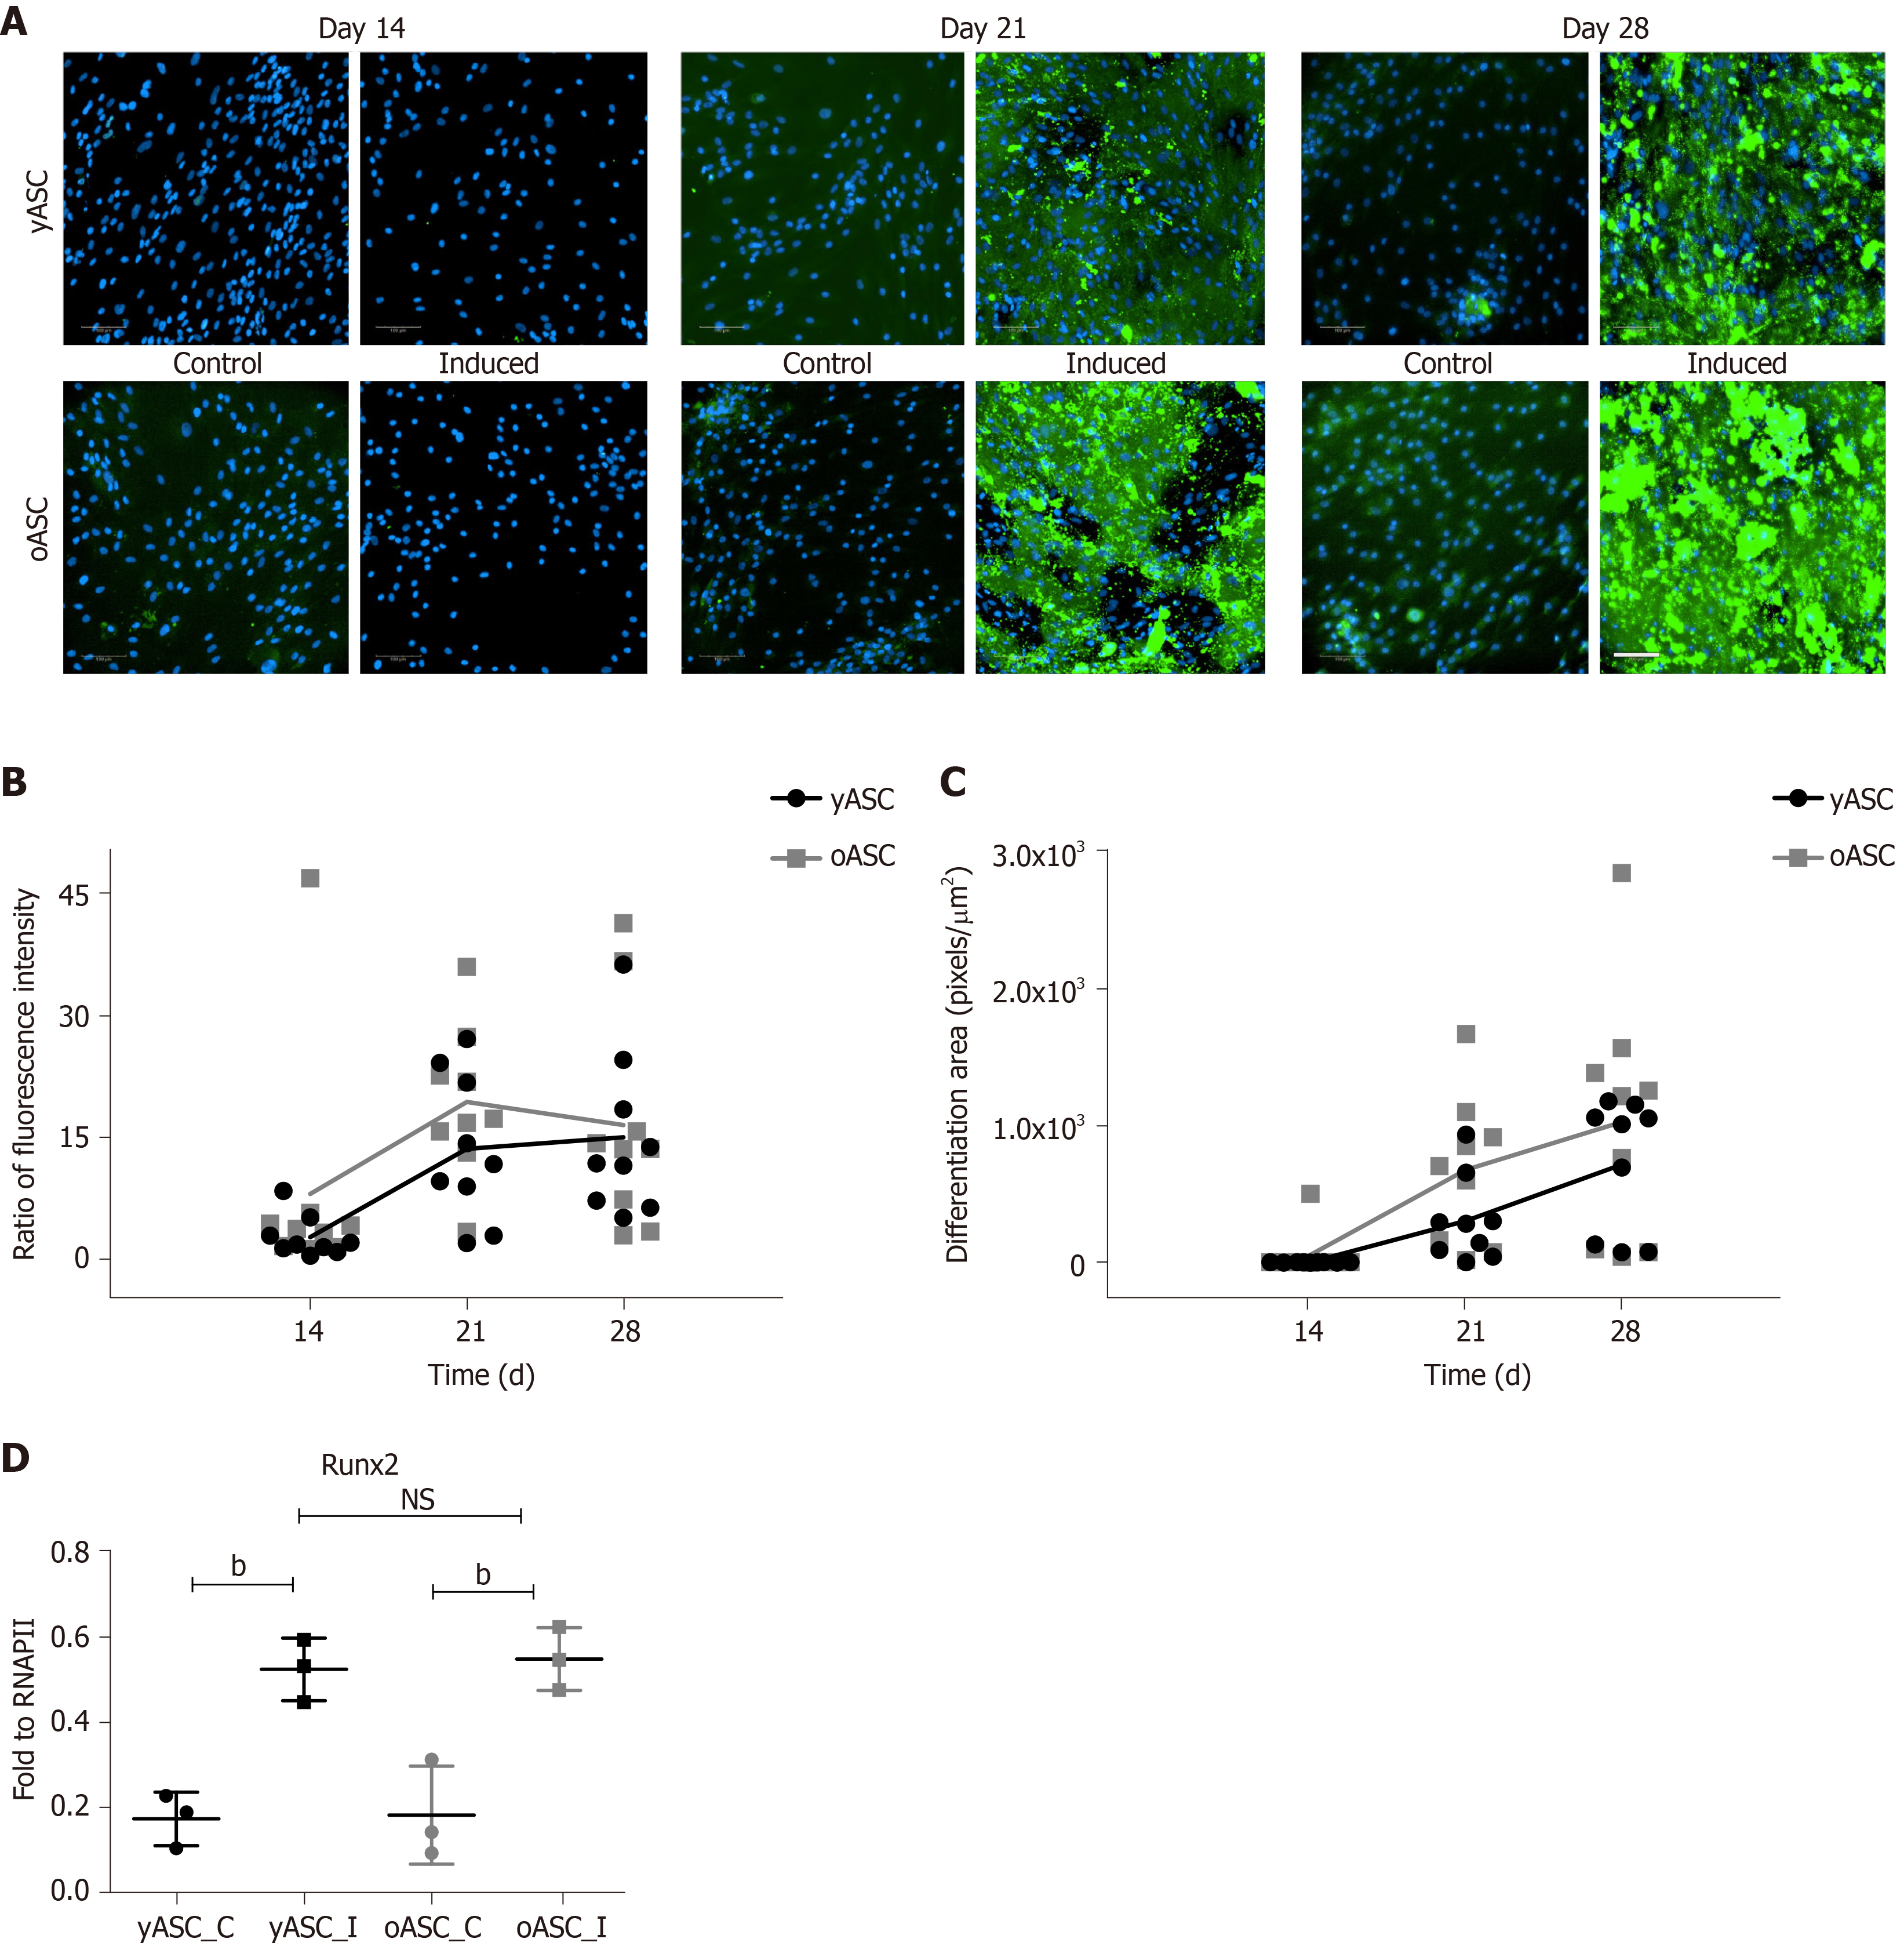
Figure 4 Analysis of osteogenic differentiation.
A: Representative images of noninduced (control) and osteogenic-induced young and old human adipose-derived stromal/stem cells (yASCs and oASCs) for 14 d, 21 d and 28 d. Hydroxyapatite deposits were stained green with Osteoimage™, and nuclei were stained blue by DAPI (scale bar: 100 μm). B: Quantitative analysis was performed by measuring the fluorescence of Osteoimage™ stain (fluorescence microplate reader); C: Quantitative analysis was performed by measuring the intracellular stained area with Osteoimage™ (Operetta®); D: Expression levels of Runx2 mRNA after osteogenic induction of yASCs and oASCs. Data are represented as the mean ± SD and are compared using a t test. NS: Nonsignificant differences.
- Citation: Horinouchi CD, Barisón MJ, Robert AW, Kuligovski C, Aguiar AM, Dallagiovanna B. Influence of donor age on the differentiation and division capacity of human adipose-derived stem cells. World J Stem Cells 2020; 12(12): 1640-1651
- URL: https://www.wjgnet.com/1948-0210/full/v12/i12/1640.htm
- DOI: https://dx.doi.org/10.4252/wjsc.v12.i12.1640


