Copyright
©The Author(s) 2020.
World J Stem Cells. Nov 26, 2020; 12(11): 1396-1409
Published online Nov 26, 2020. doi: 10.4252/wjsc.v12.i11.1396
Published online Nov 26, 2020. doi: 10.4252/wjsc.v12.i11.1396
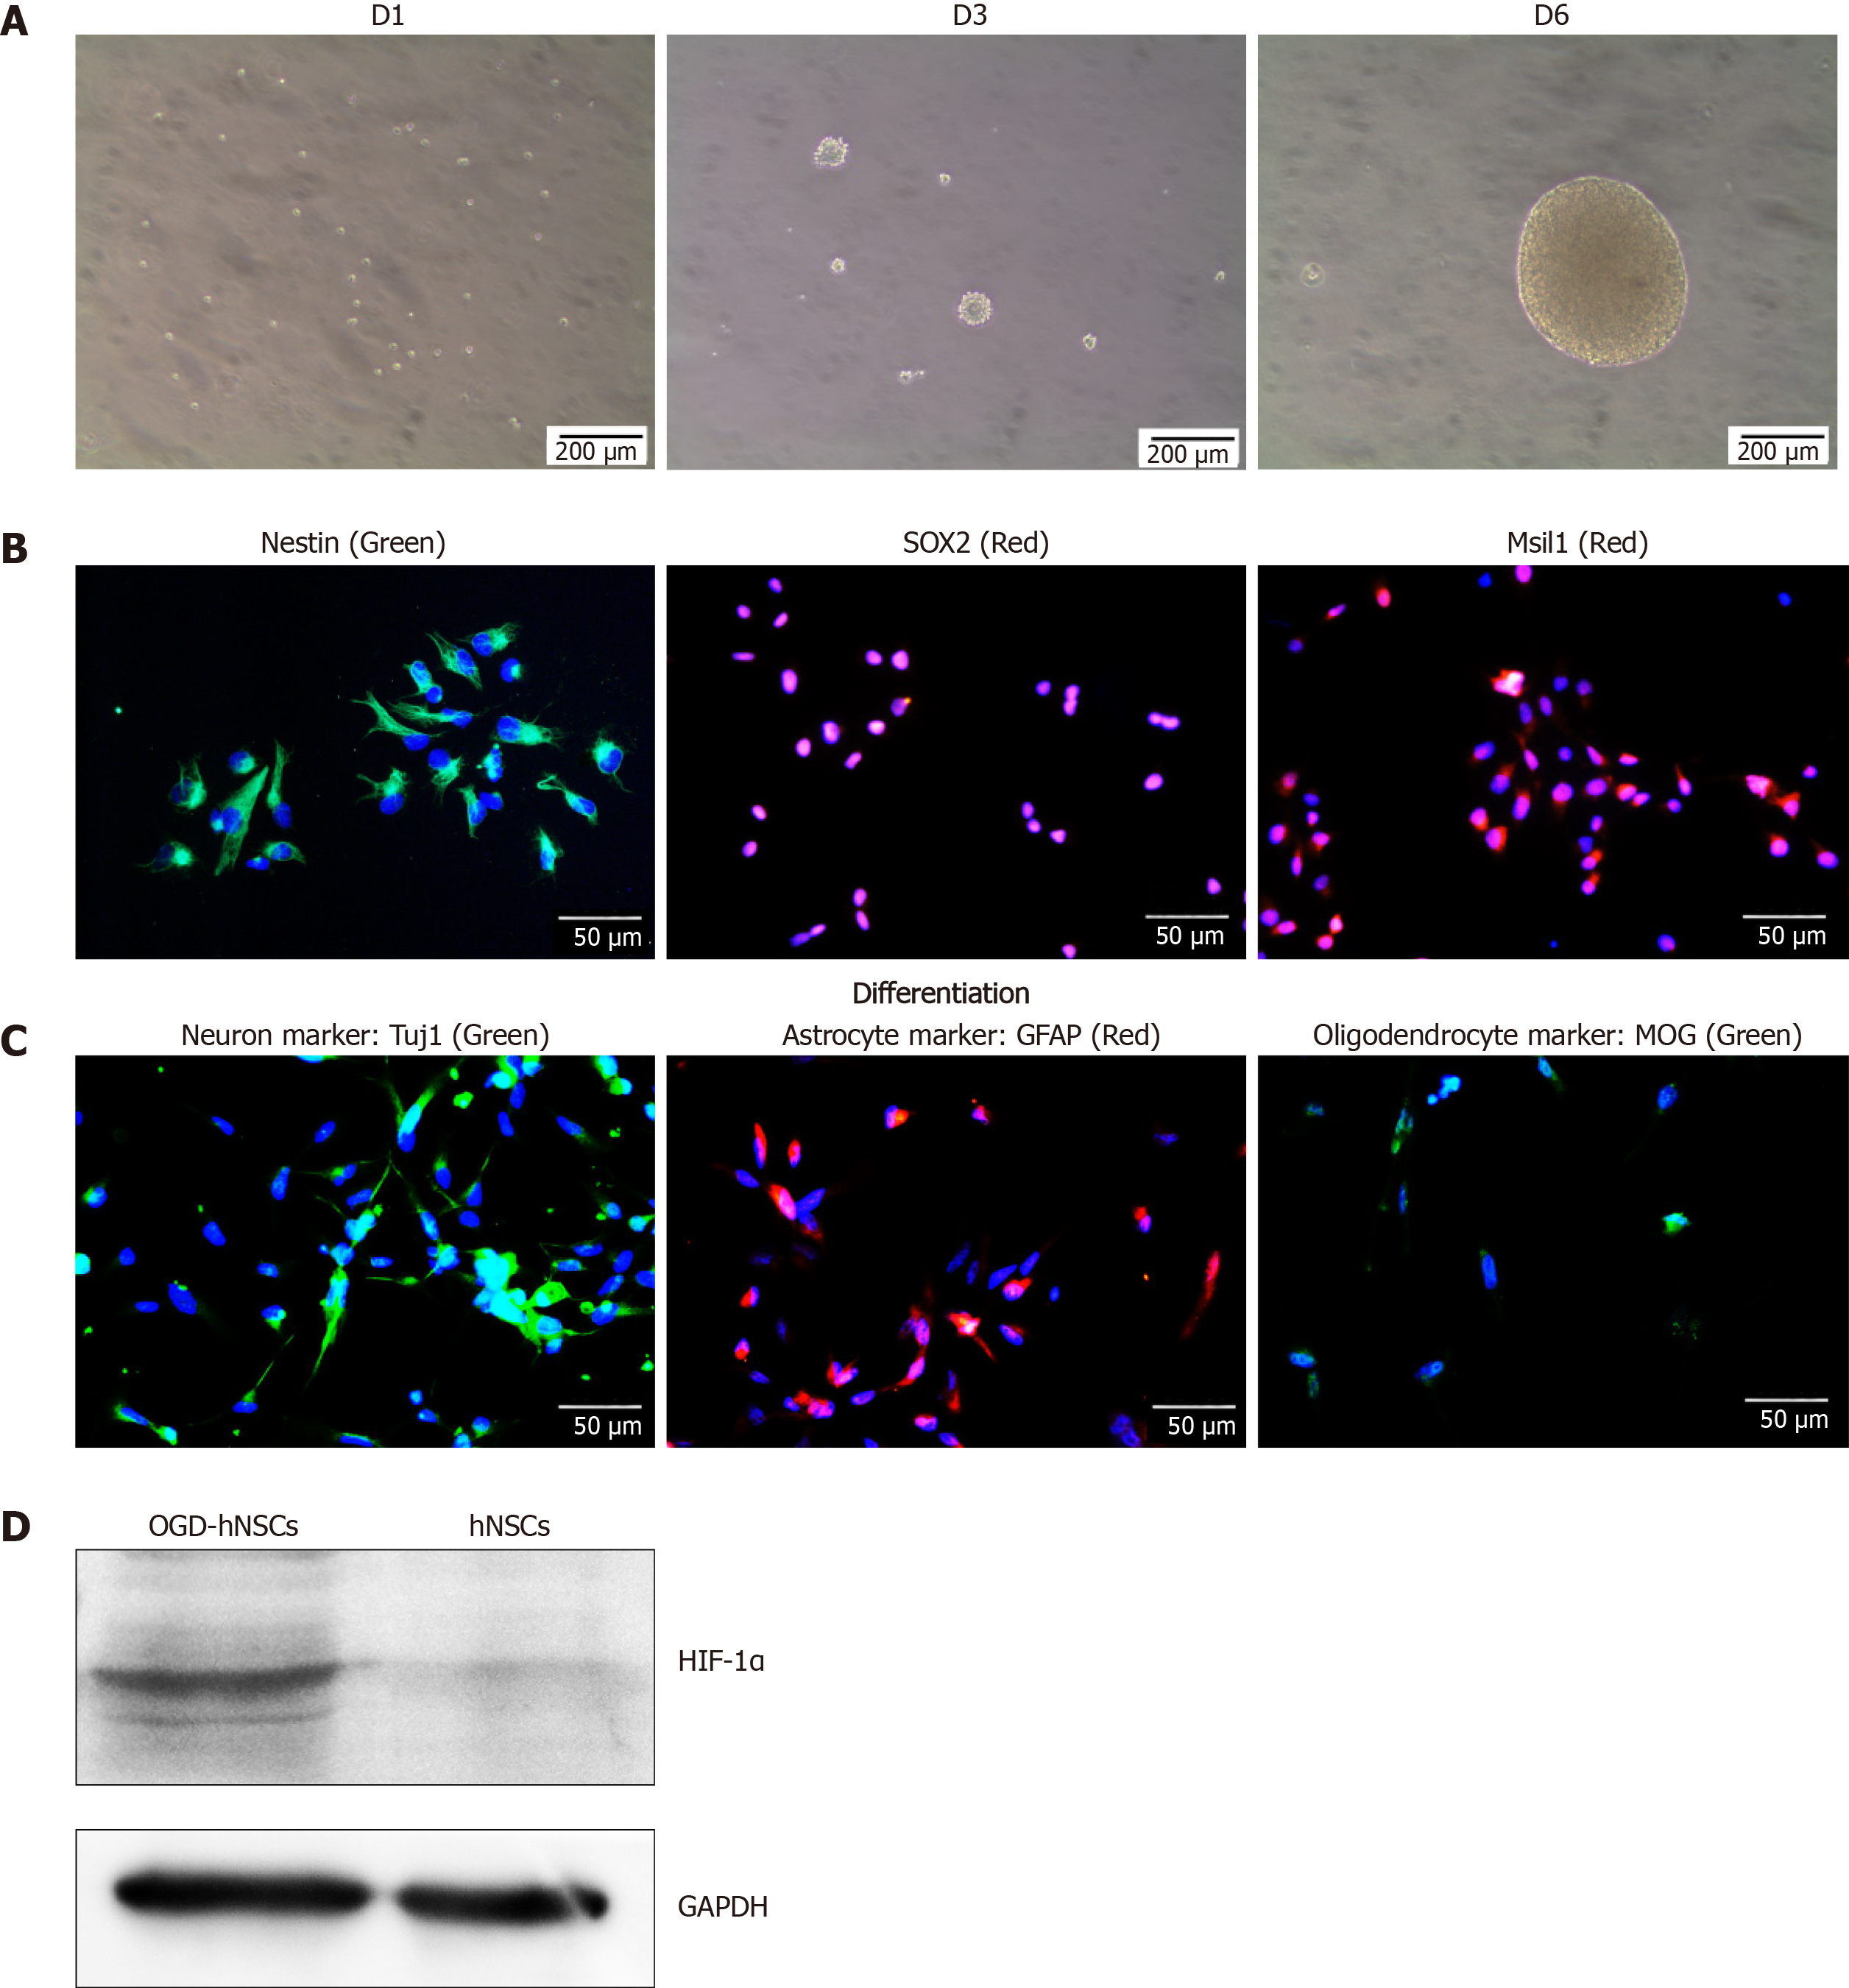
Figure 1 Characteristics of human neural stem cells.
A: The proliferation morphology of human neural stem cells (hNSCs) cultured in vitro from Day 1 to Day 6. The hNSCs presented a neurosphere morphology; B: Immunofluorescence for hNSCs specific markers, including Nestin, SOX2, and Msil1. DAPI indicated the cell nucleus; C: The differentiation markers of hNSCs, including Tuj1 (a neuron marker), GFAP (an astrocyte marker), and MOG (an oligodendrocyte marker); D: Western blot analysis showing that after culturing in hypoxic (3% O2) condition, oxygen-glucose deprived-hNSCs overexpressed the hypoxic marker HIF-1α. hNSCs: Human neural stem cells; Tuj1: β-tubulin III; GFAP: Glial fibrillary acidic protein; MOG: Myelin oligodendrocyte glycoprotein.
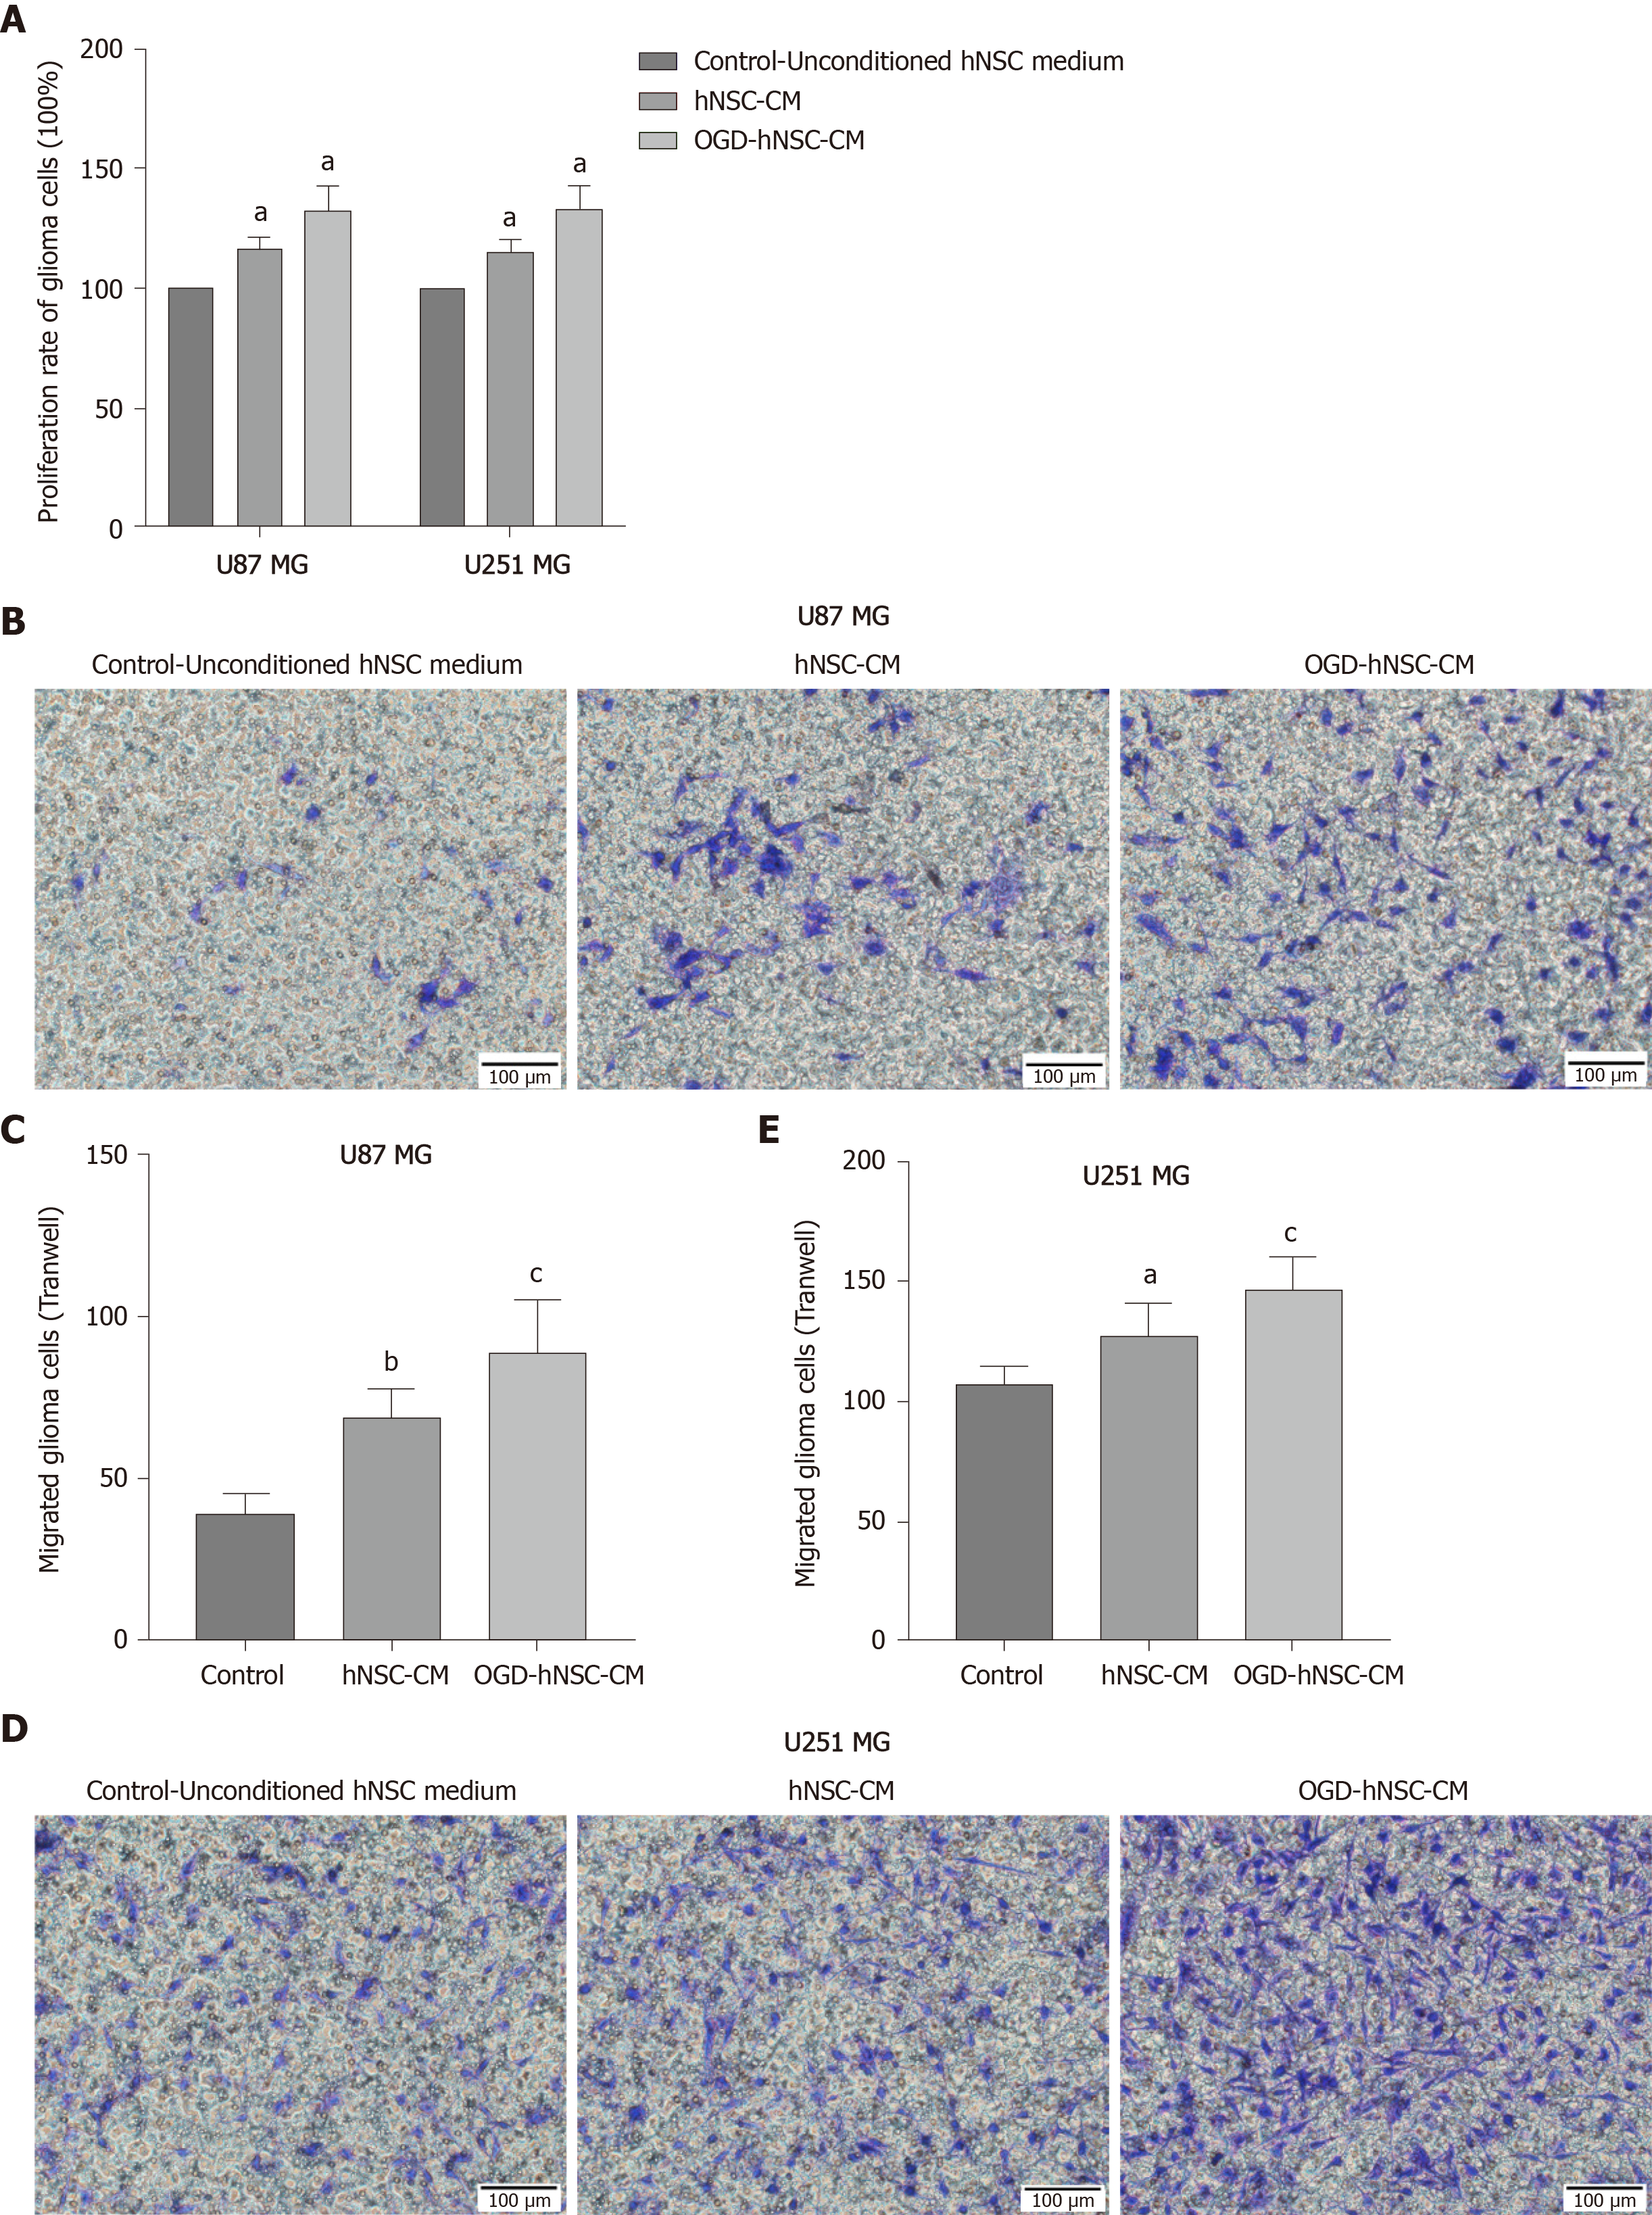
Figure 2 Oxygen-glucose deprived-human neural stem cells-condition medium further promotes glioma cell proliferation and invasion.
A: The proliferation of U87 and U251 MG cells was significantly increased in the condition medium (CM) groups, especially in the oxygen-glucose deprived-human neural stem cells (hNSC)-CM group, as measured by CCK8 assay; B-E: hNSC-CM promoted the invasion ability of glioma cells (U87 MG shown in B and C, U251 MG shown in D and E) compared to unconditioned hNSC medium, especially in the oxygen-glucose deprived-hNSC-CM group. Control: Unconditioned hNSC medium group. aP < 0.05 vs Control, bP < 0.01 vs Control, cP < 0.05 vs hNSC-CM. OGD: Oxygen-glucose deprived; hNSCs: Human neural stem cells; CM: Condition medium.
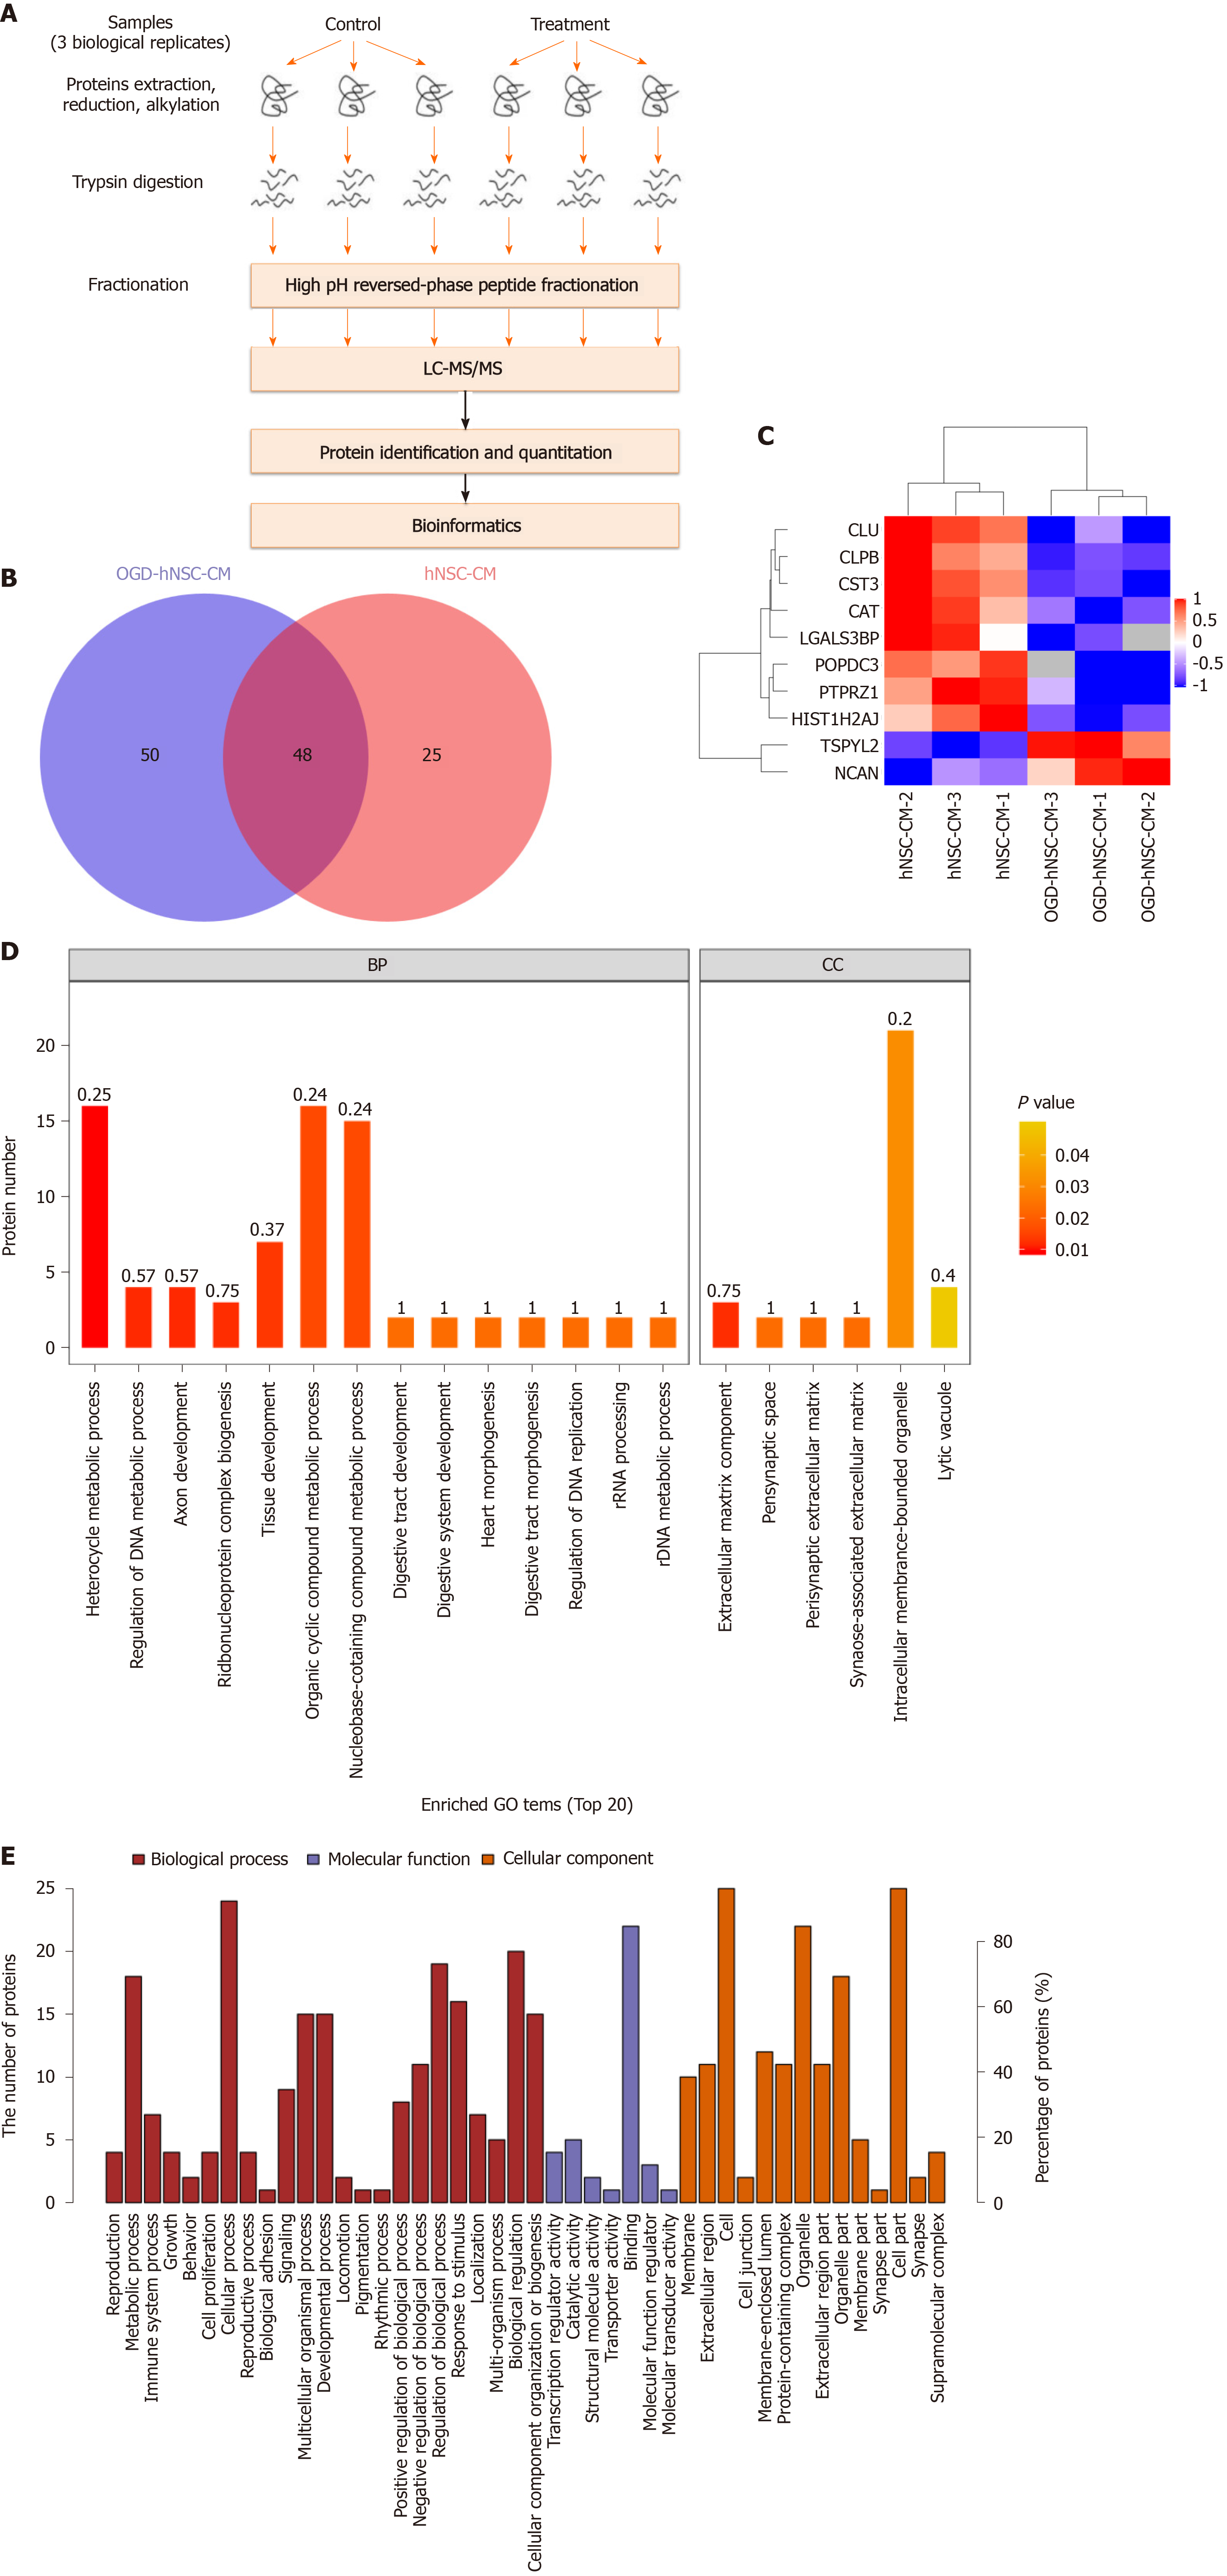
Figure 3 Protein expression analysis of condition medium derived from human neural stem cells by mass spectrometry.
A: The experimental workflow of protein mass spectrometry analysis; B: Venn diagram of the proteins distribution in human neural stem cells-condition medium (hNSC-CM) and oxygen-glucose deprived (OGD)-hNSC-CM; C: Hierarchical clustering of differentially expressed proteins between hNSC-CM group and OGD-hNSC-CM group. Red color indicates higher expression, and green color indicates lower expression; D: The top 20 Gene Ontology functions of predicted targets according to the differentially expressed proteins; E: The biological process, molecular function, and cellular component of the analyzed proteins between hNSC-CM and OGD-hNSC-CM group. OGD: Oxygen-glucose deprived; hNSCs: Human neural stem cells; CM: Condition medium.
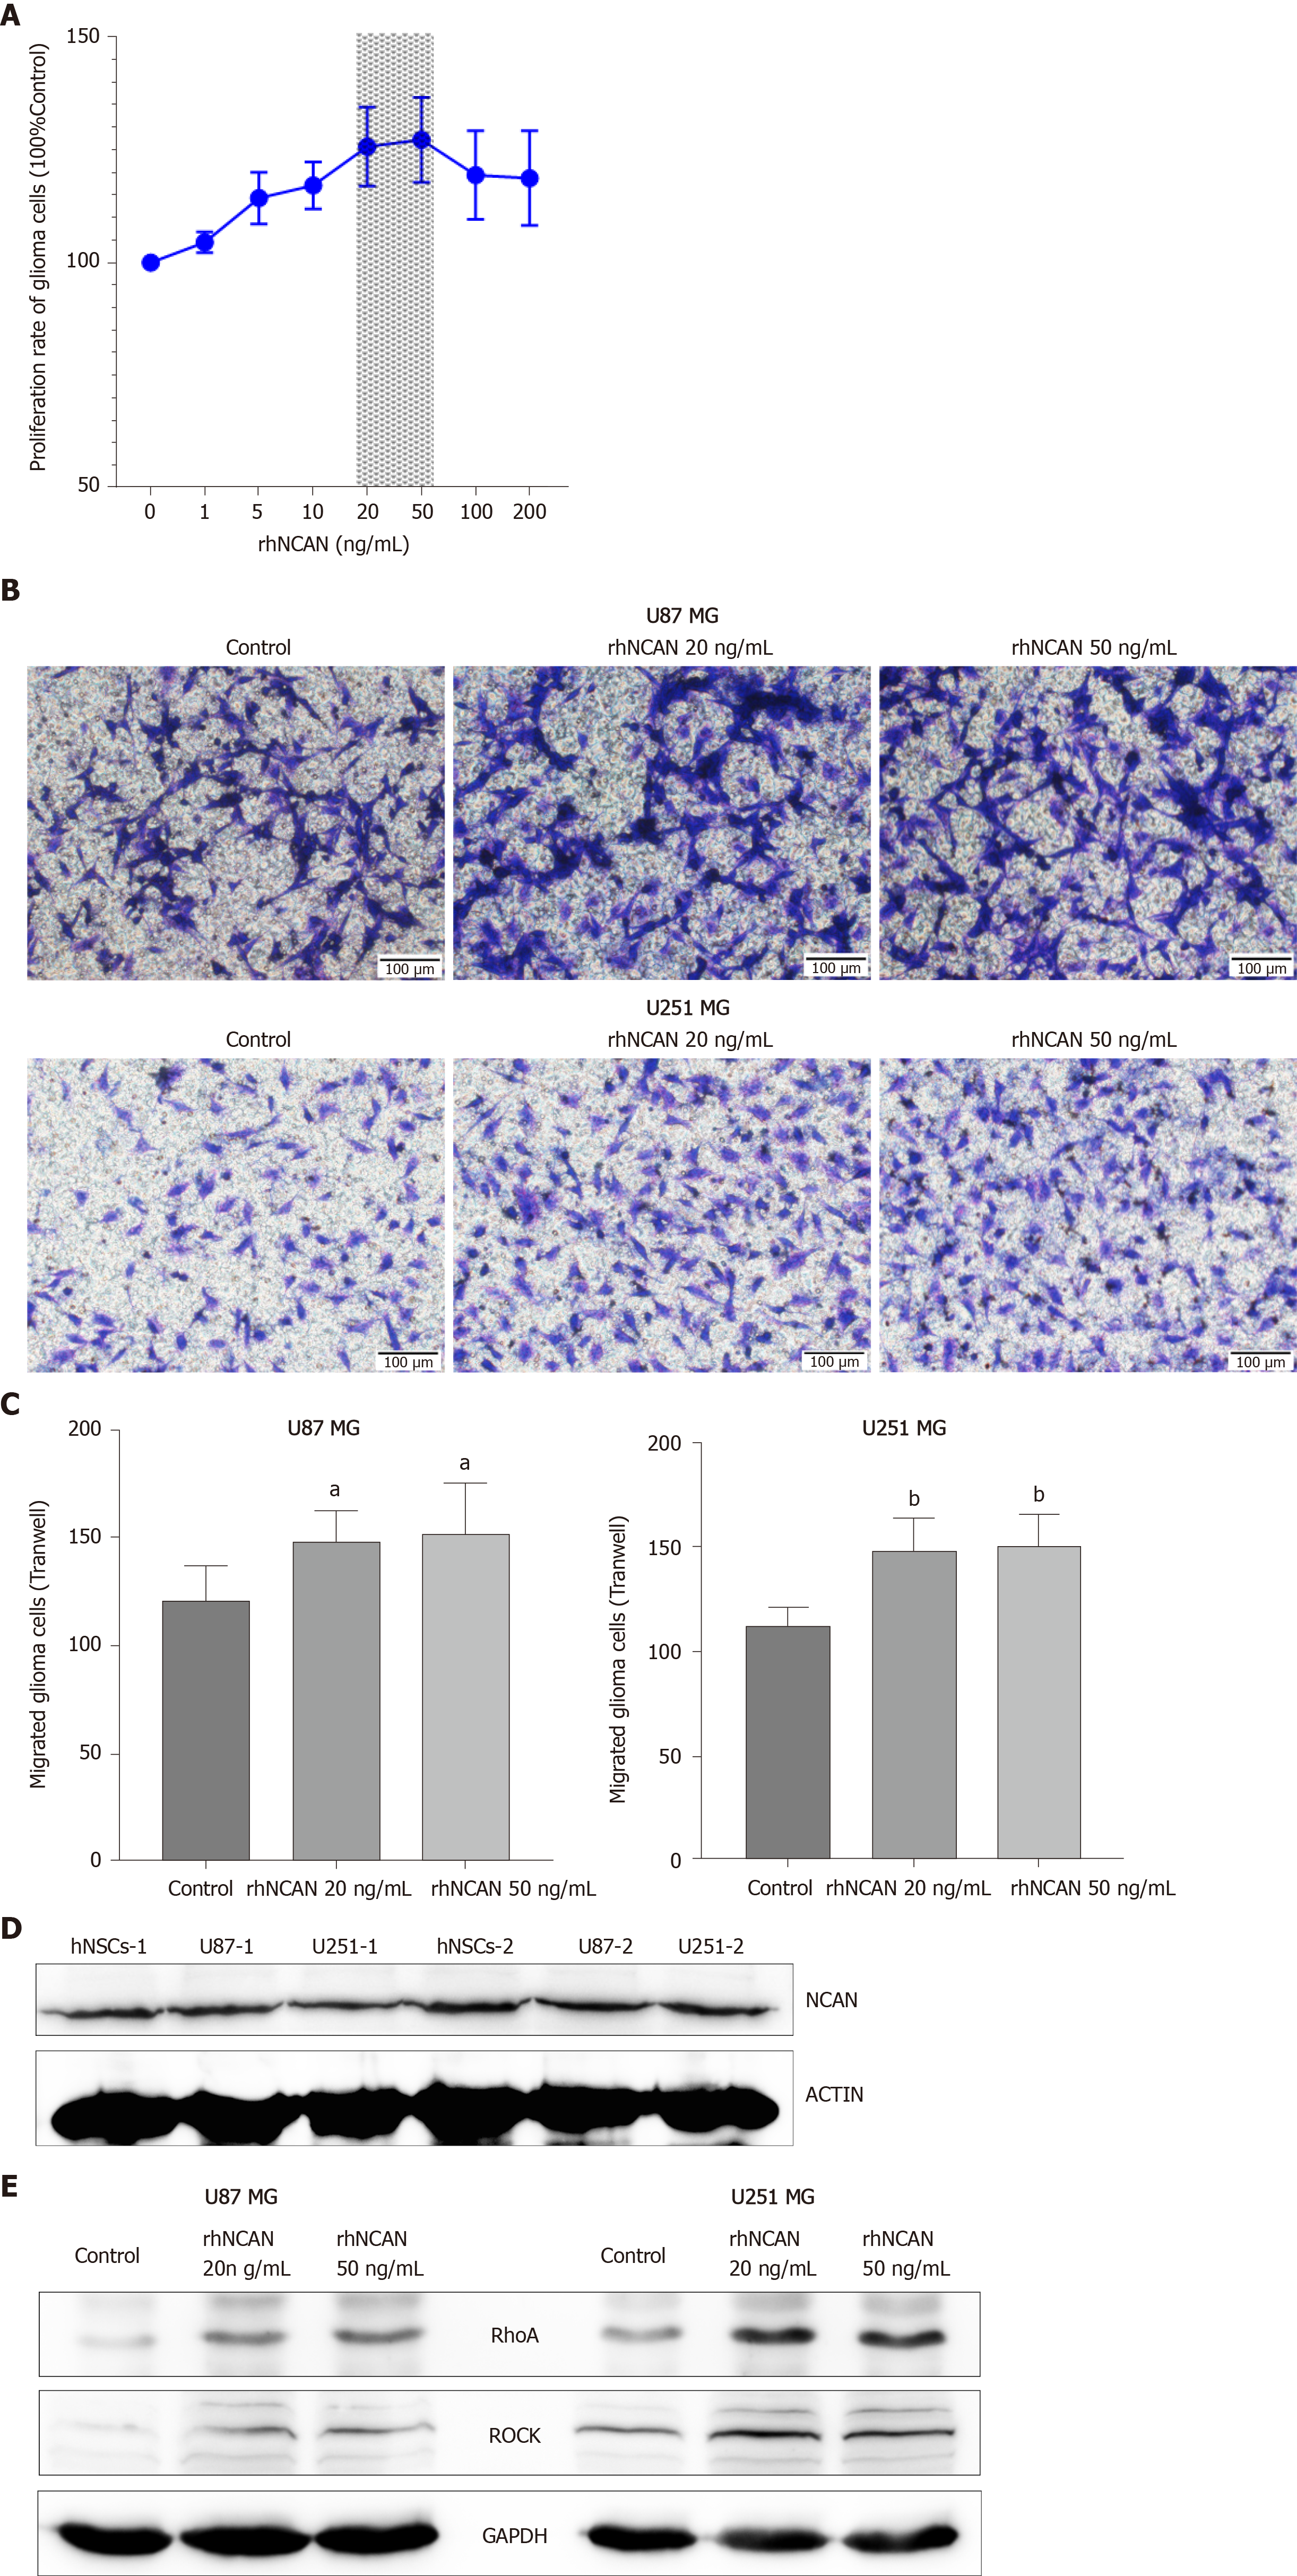
Figure 4 Recombinant human NCAN protein increases glioma cell proliferation and invasion.
A: The proliferation of glioma cells was significantly increased after treatment with different concentrations of recombinant human NCAN (rhNCAN), as measured by CCK8 assay, especially at the concentrations of 20 and 50 ng/mL; B and C: rhNCAN (both 20 and 50 ng/mL) significantly improved the invasion ability of U87 and U251 glioma cells; D: Expression of NCAN in the human neural stem cells and glioma cells detected by Western blot. β-actin was used as the loading control. -1 and -2 indicated two independent samples; E: After treatment of U87 and U251 glioma cells with rhNCAN (20 and 50 ng/mL), the downstream RhoA-ROCK signaling pathway was significantly activated in both glioma cells, as measured by Western blot. β-actin was used as the loading control. Con: Control 10% FBS condition medium group; rhNCAN: Recombinant human NCAN protein. (aP < 0.05 vs Control, bP < 0.01 vs Control).
- Citation: Zhang GL, Qian C, Zhang SZ, Tuo YH, Zeng BY, Ji YX, Wang YZ. Effect of conditioned medium from neural stem cells on glioma progression and its protein expression profile analysis. World J Stem Cells 2020; 12(11): 1396-1409
- URL: https://www.wjgnet.com/1948-0210/full/v12/i11/1396.htm
- DOI: https://dx.doi.org/10.4252/wjsc.v12.i11.1396


