Copyright
©The Author(s) 2020.
World J Stem Cells. Jan 26, 2020; 12(1): 55-69
Published online Jan 26, 2020. doi: 10.4252/wjsc.v12.i1.55
Published online Jan 26, 2020. doi: 10.4252/wjsc.v12.i1.55
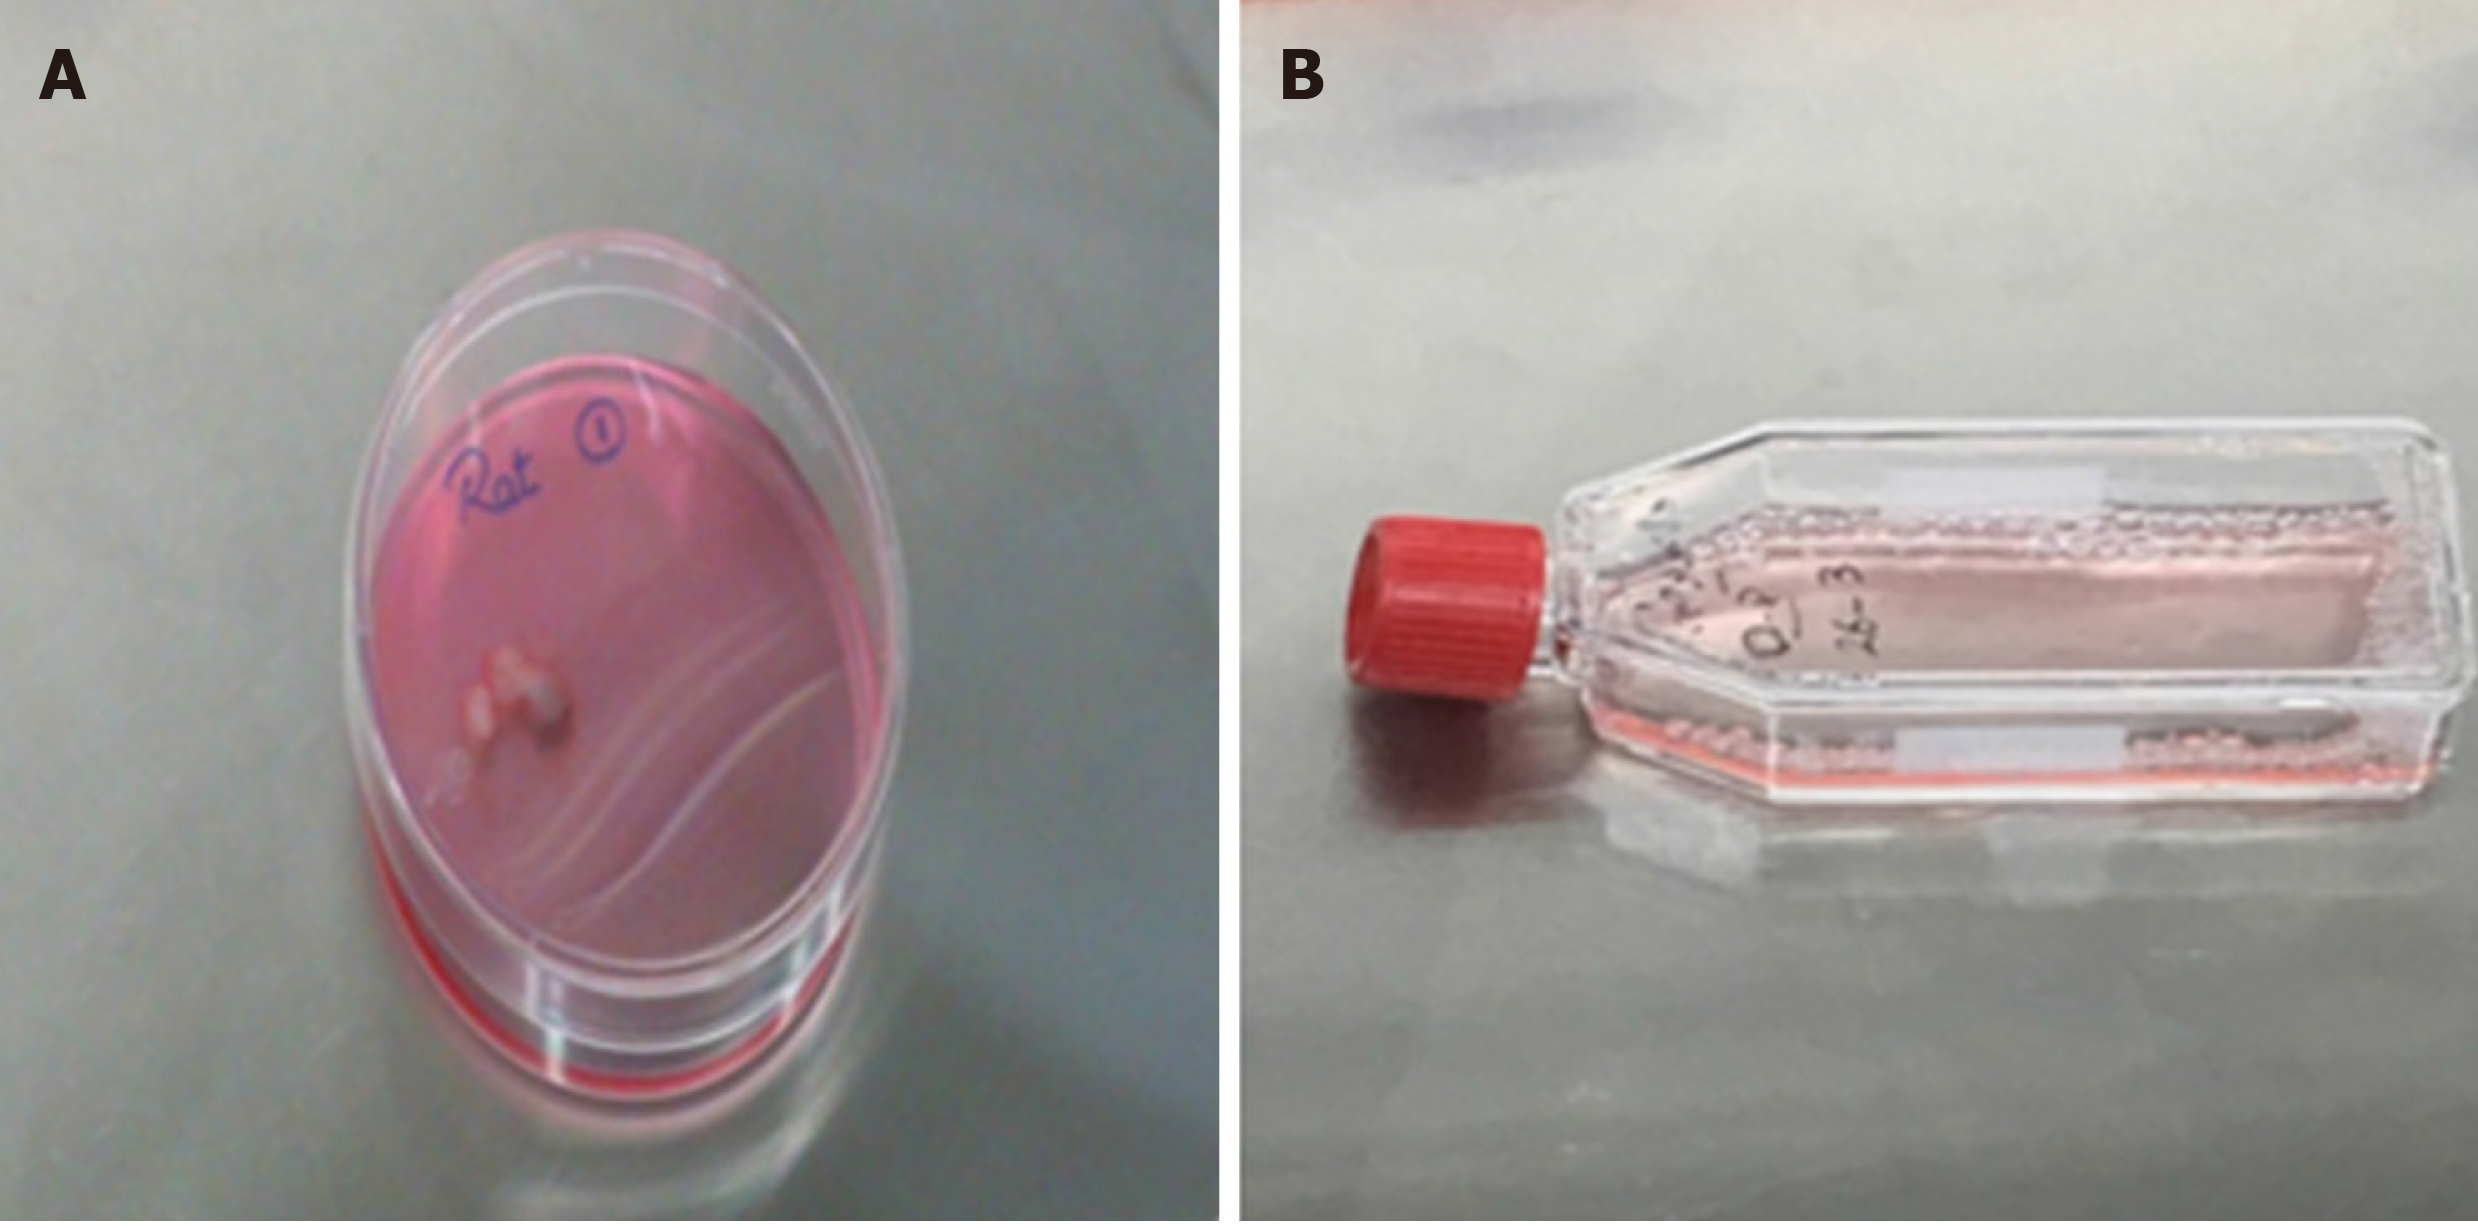
Figure 1 PRF and BMSCs in nutritional media.
A: Photographs showing platelet-rich fibrin membrane in nutritional media ready for incubation; B: Photographs showing a T25 flask containing 1 × 10⁶ of bone marrow-derived stem cells in nutritional media.
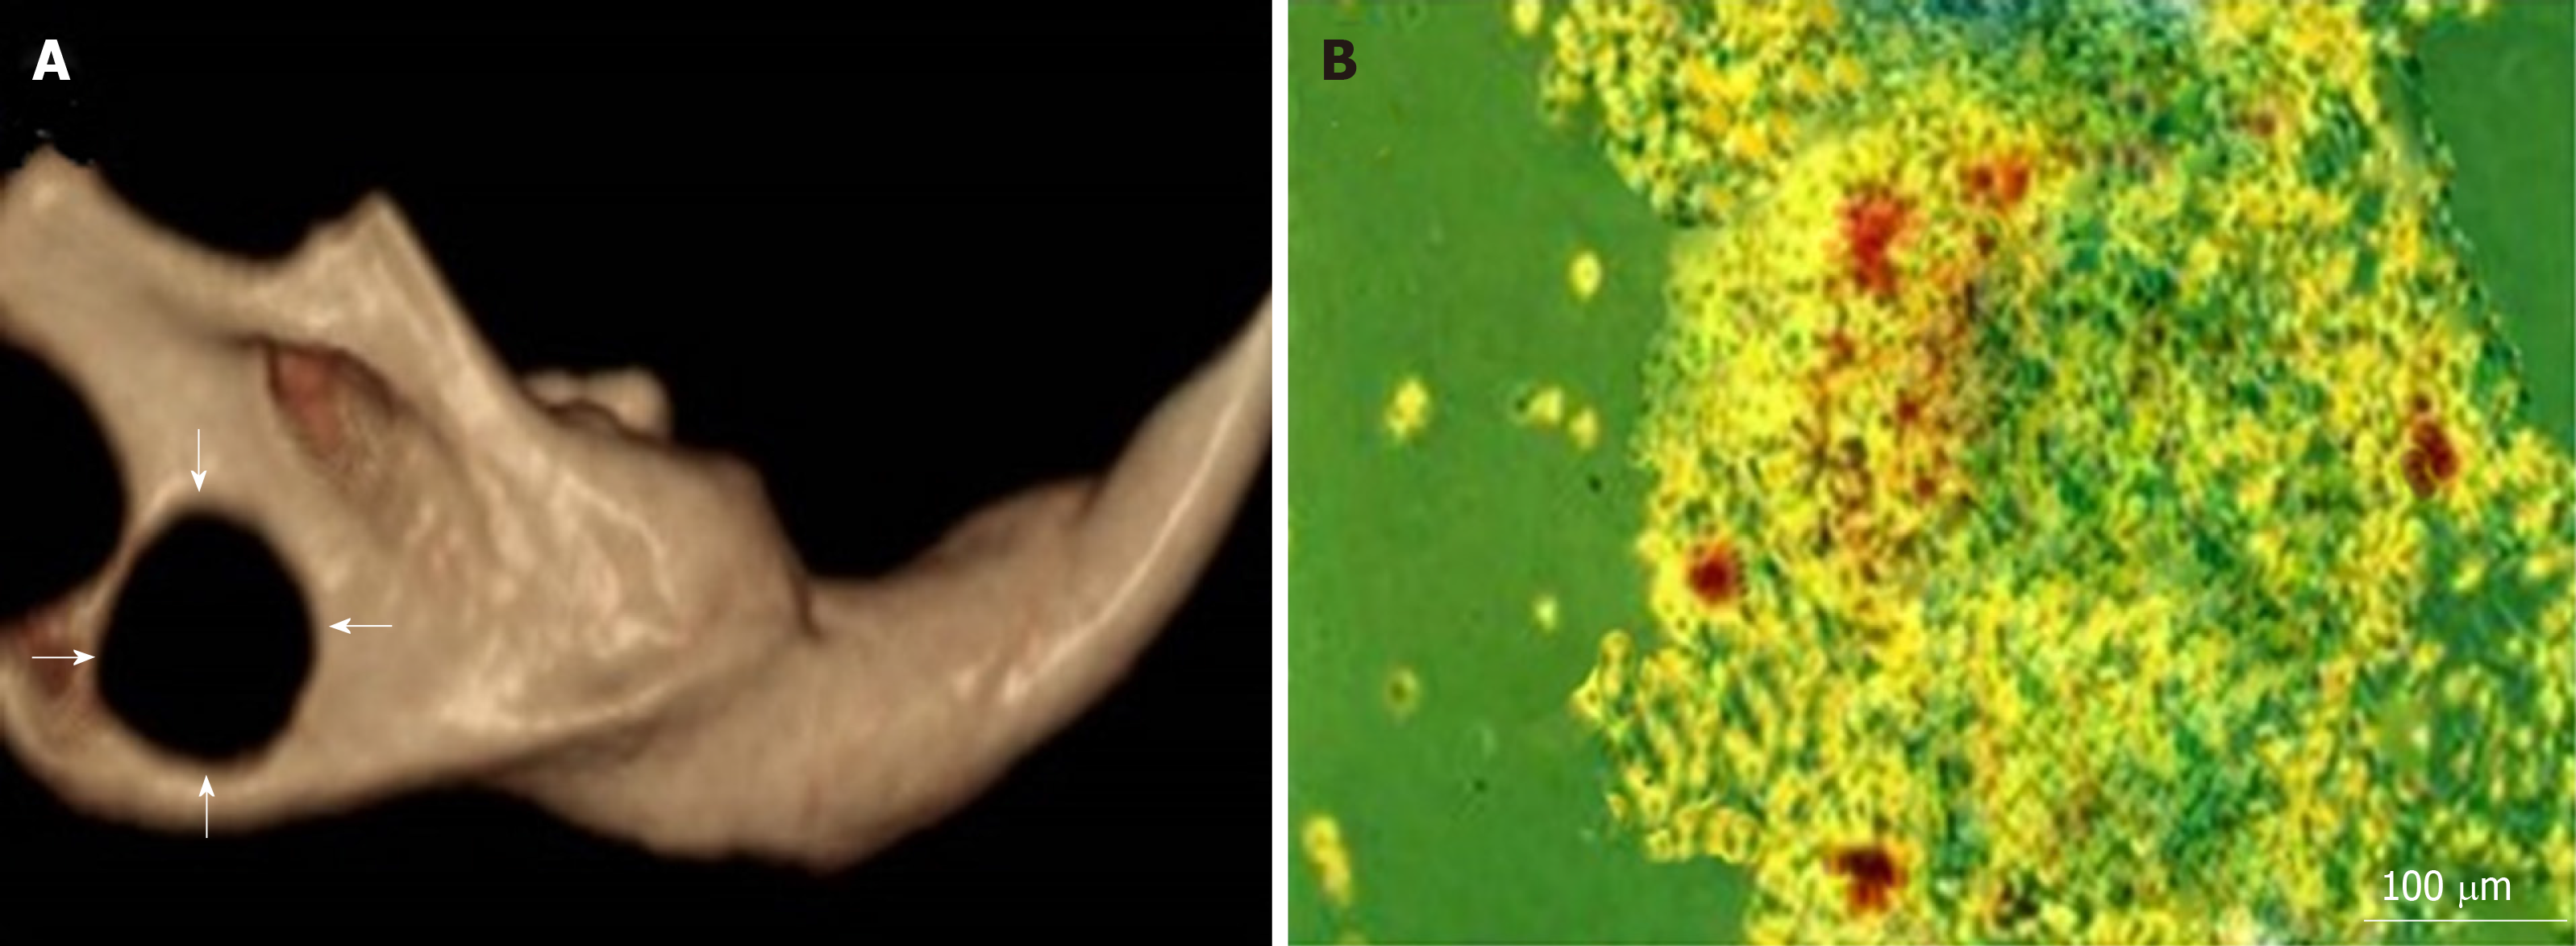
Figure 2 CBCT and inverted microscopic imaging.
A: CBCT images of critical-sized defects (arrows) in rats' mandibles; B: An inverted light microscopic image of bone marrow-derived stem cells differentiated in osteogenic medium with mineralized deposits identified by alizarin red staining on the 7th day.
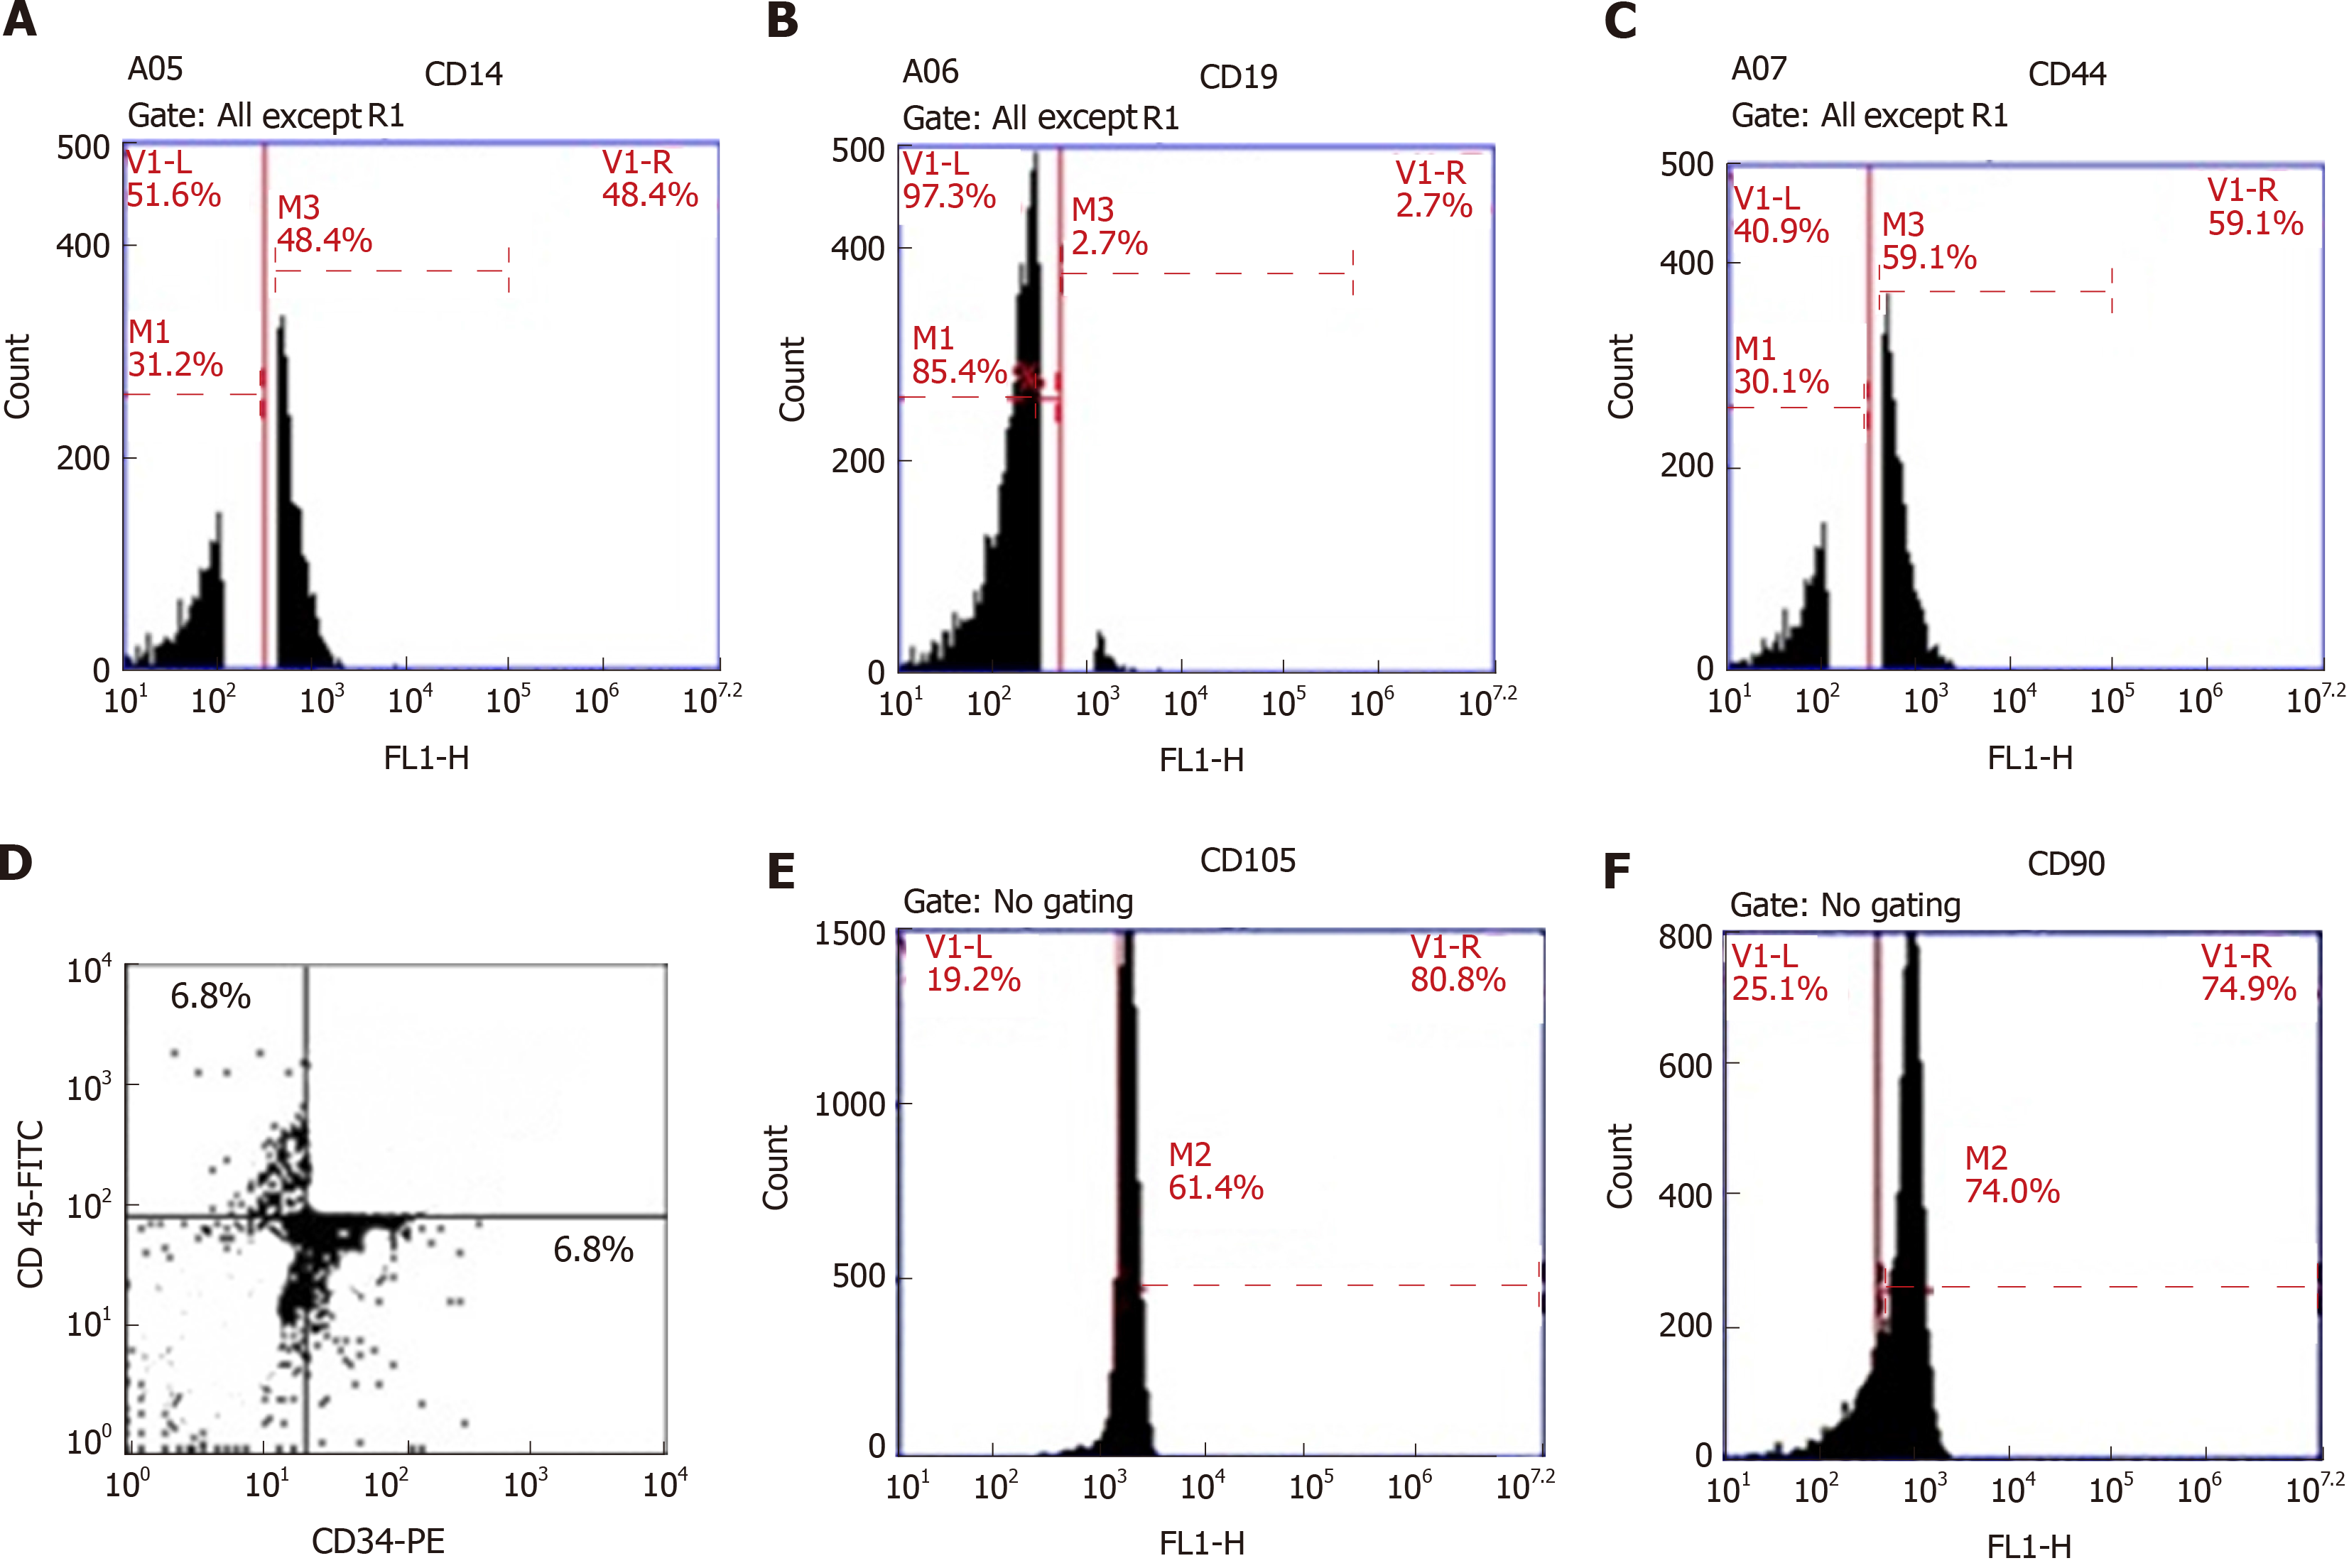
Figure 3 Plots of the flow cytometric analysis of bone marrow-derived stem cells.
A: anti-CD14; B: anti-CD19; C: anti-CD44; D: anti-CD34 (FL1-H) and anti-CD45 (FL2-H); E: anti-CD105; F: anti-CD90. A, B, C, E, and F are histograms of the relative fluorescence height (FL1-H) of surface markers against cell count, while D is a dot plot of the relative fluorescence height of the surface marker CD34-PE (FL1-H) against the relative fluorescence height of the surface marker CD45-FITC (FL2-H).
Figure 4 Hematoxylin and eosin staining.
A-C: Decalcified 4-µm thick sections showing the empty bone defect area of group I at 1, 2 and 4 wk; D-F: the bone defect area of group II grafted with rich fibrin membrane at 1, 2 and 4 wk; G-I: the bone defect area of group III grafted with platelet-rich fibrin membrane and seeded with bone marrow-derived stem cells at 1, 2 and 4 wk. Black arrowheads (osteoid bone); red arrowheads (granulation tissue).
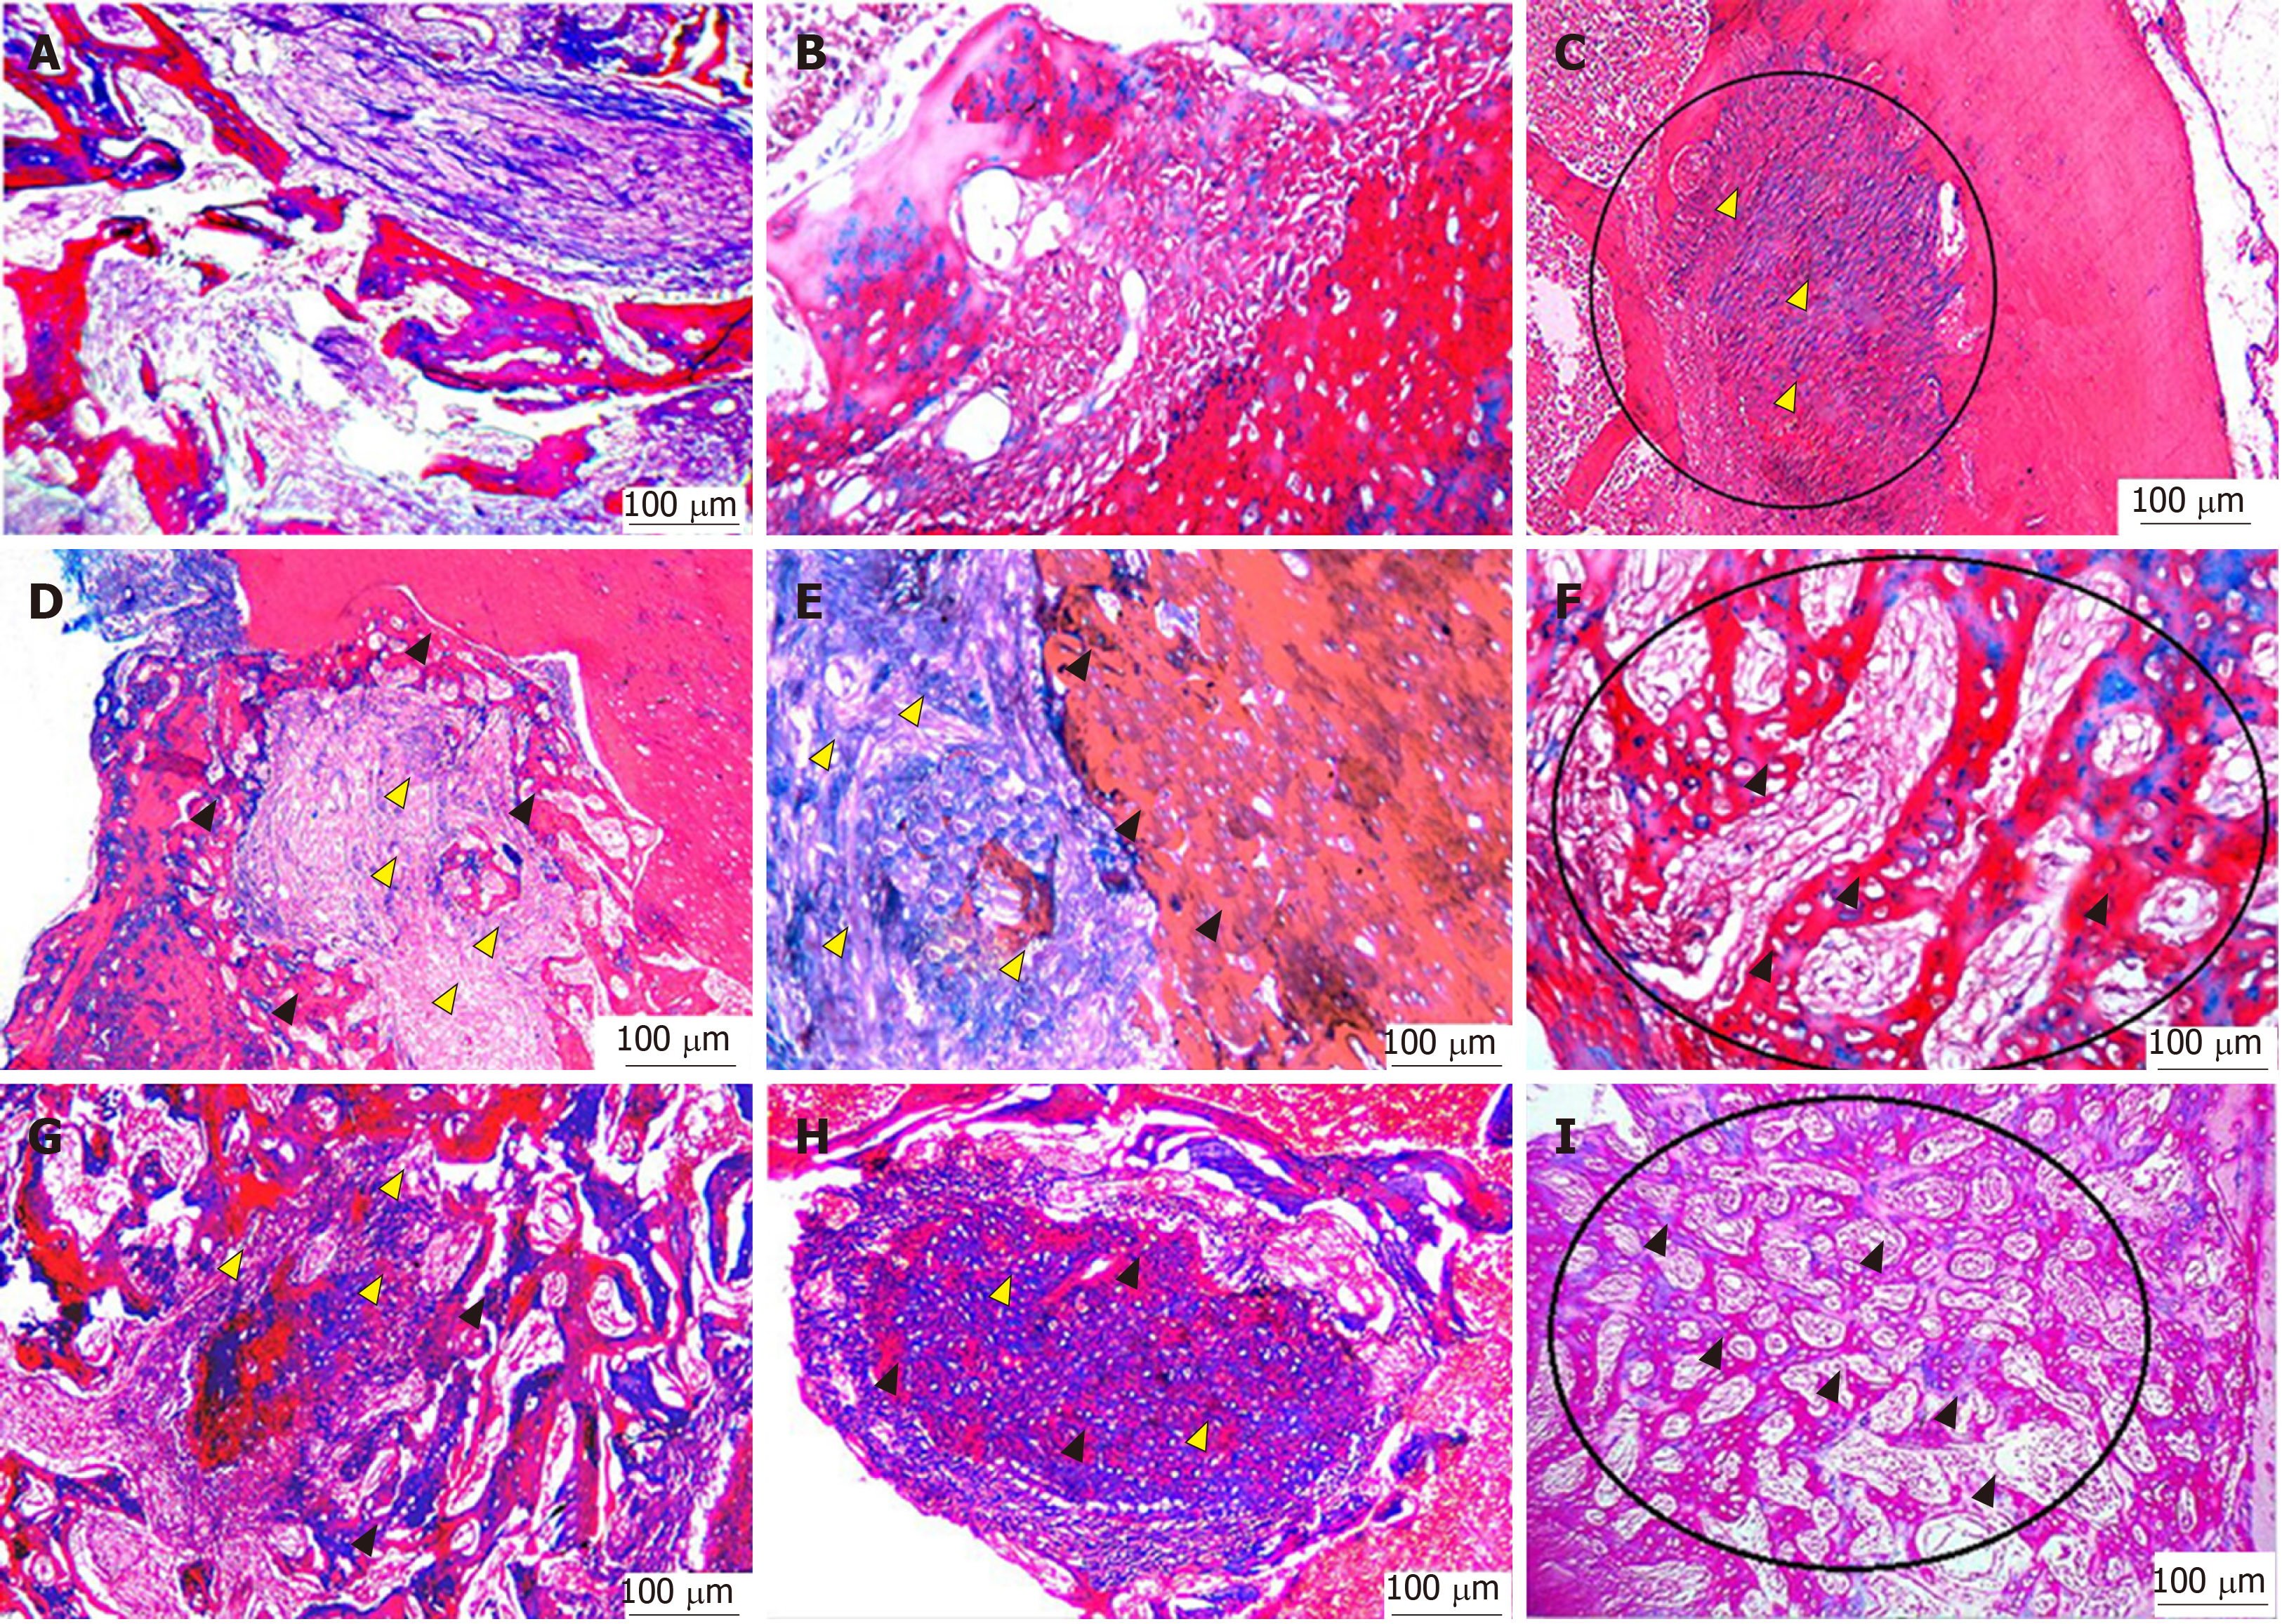
Figure 5 Masson’s trichrome staining.
A-C: Decalcified 4-µm thick sections showing the empty bone defect area of group I at 1, 2 and 4 wk; D-F: the bone defect area of group II grafted with rich fibrin membrane at 1, 2 and 4 wk; G-I: the bone defect area of group III grafted with platelet-rich fibrin membrane and seeded with bone marrow-derived stem cells at 1, 2 and 4 wk. Green arrowheads (osteoid bone); yellow arrowheads (granulation tissue).
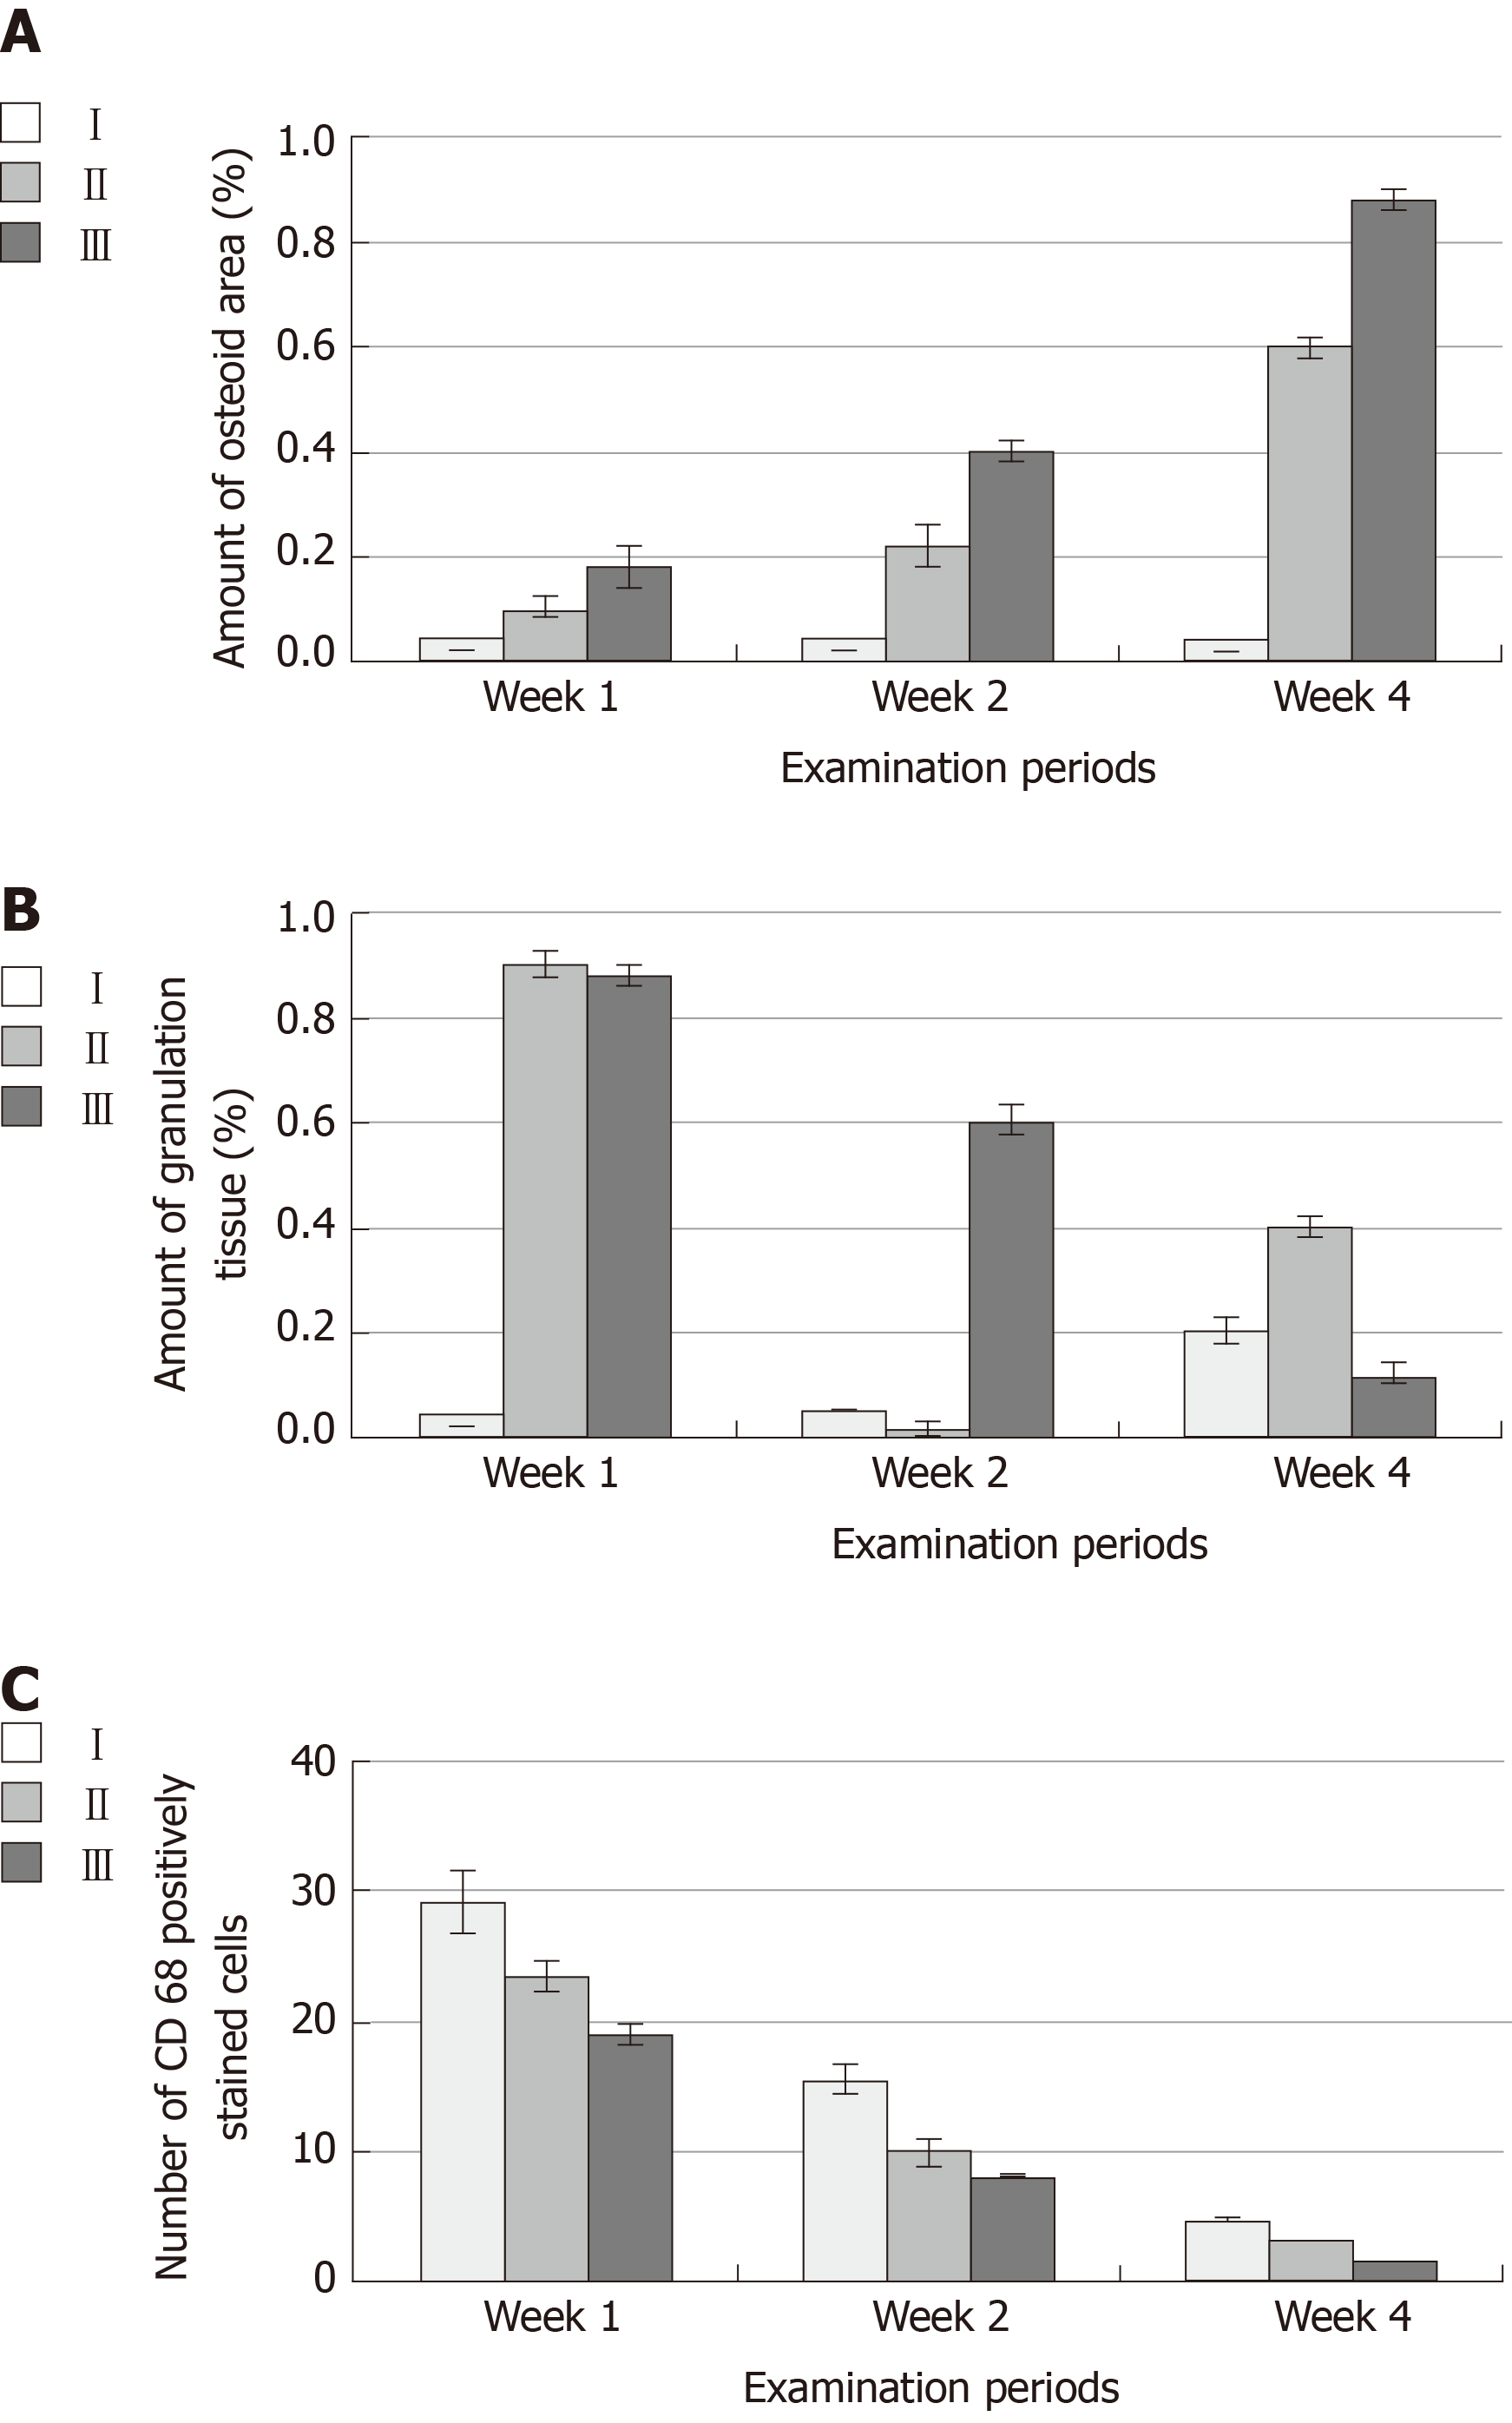
Figure 6 Mean values of osteoid area, granulation tissue and CD68 positively stained cells.
A: Bar charts of the mean values and standard deviations of osteoid bone; B: Amount of granulation tissue; C: Number of CD68 positively stained cells.
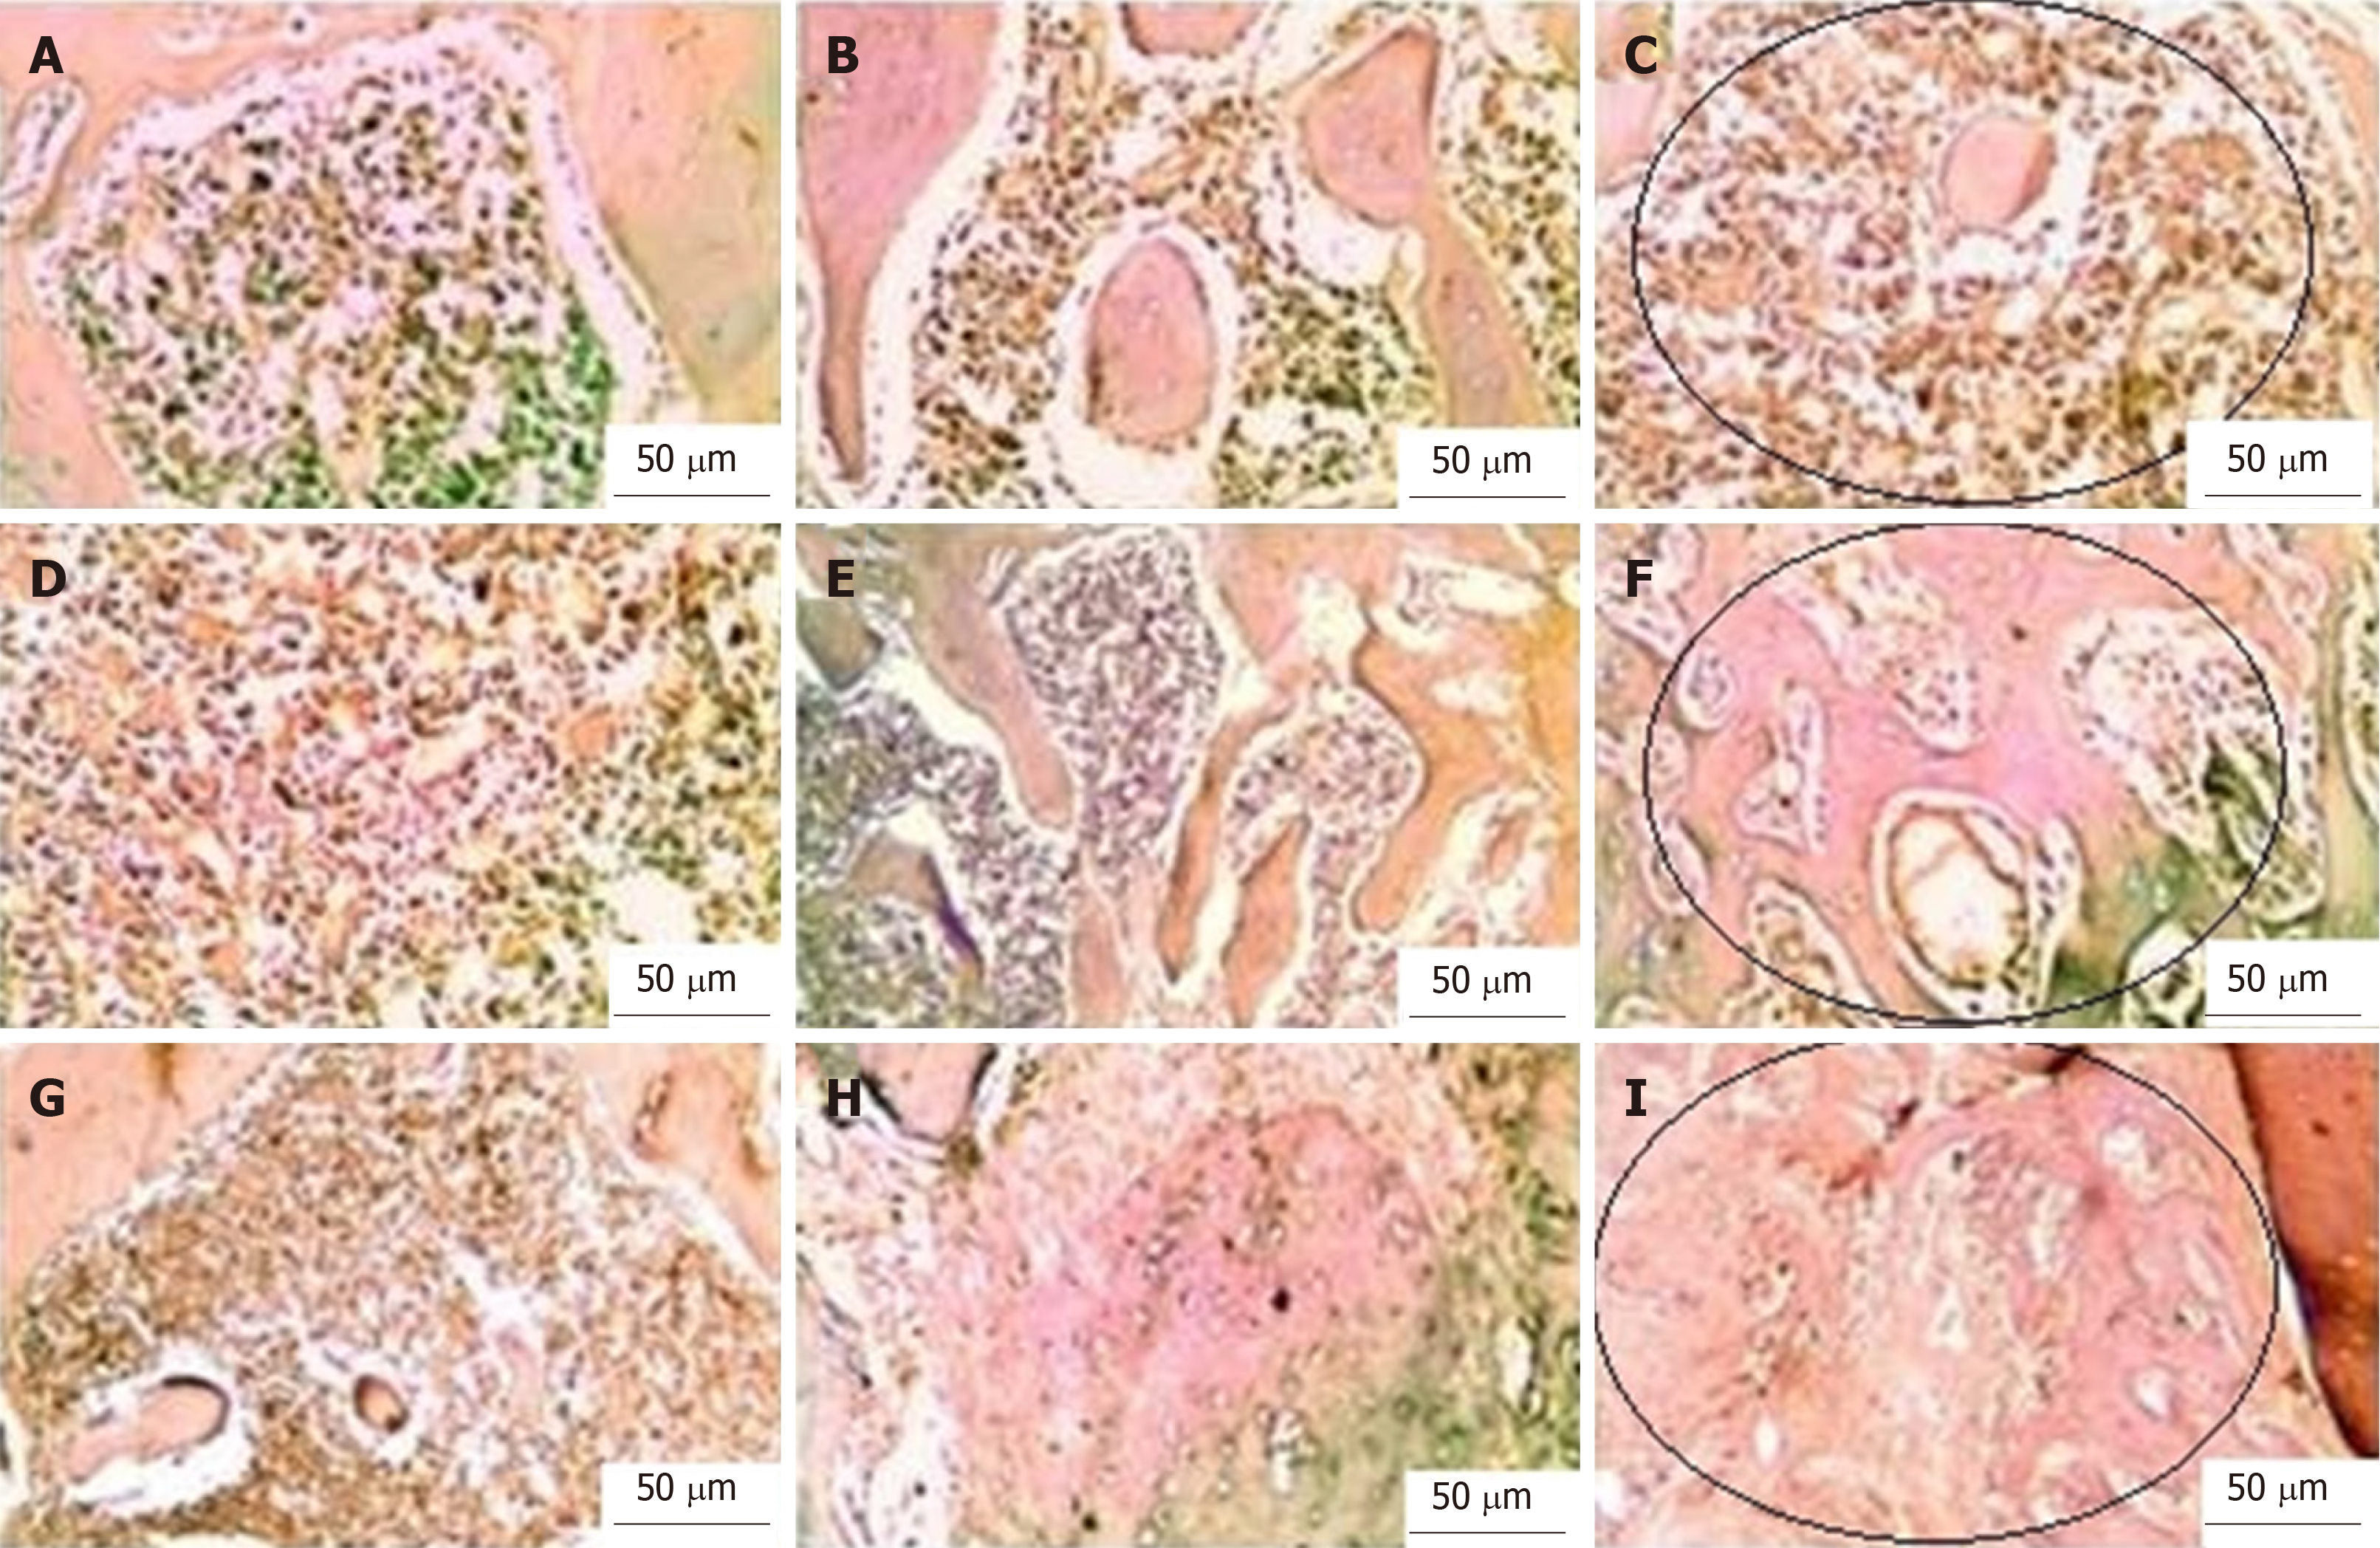
Figure 7 Photomicrograph of bone cavities of different groups at 1, 2 and 4 wk showing different immune reactivity to CD68 antibody.
A-C: Group I; D-F: Group II; G-I: Group III.
- Citation: Awadeen MA, Al-Belasy FA, Ameen LE, Helal ME, Grawish ME. Early therapeutic effect of platelet-rich fibrin combined with allogeneic bone marrow-derived stem cells on rats' critical-sized mandibular defects. World J Stem Cells 2020; 12(1): 55-69
- URL: https://www.wjgnet.com/1948-0210/full/v12/i1/55.htm
- DOI: https://dx.doi.org/10.4252/wjsc.v12.i1.55


