Copyright
©The Author(s) 2019.
World J Stem Cells. Oct 26, 2019; 11(10): 891-903
Published online Oct 26, 2019. doi: 10.4252/wjsc.v11.i10.891
Published online Oct 26, 2019. doi: 10.4252/wjsc.v11.i10.891
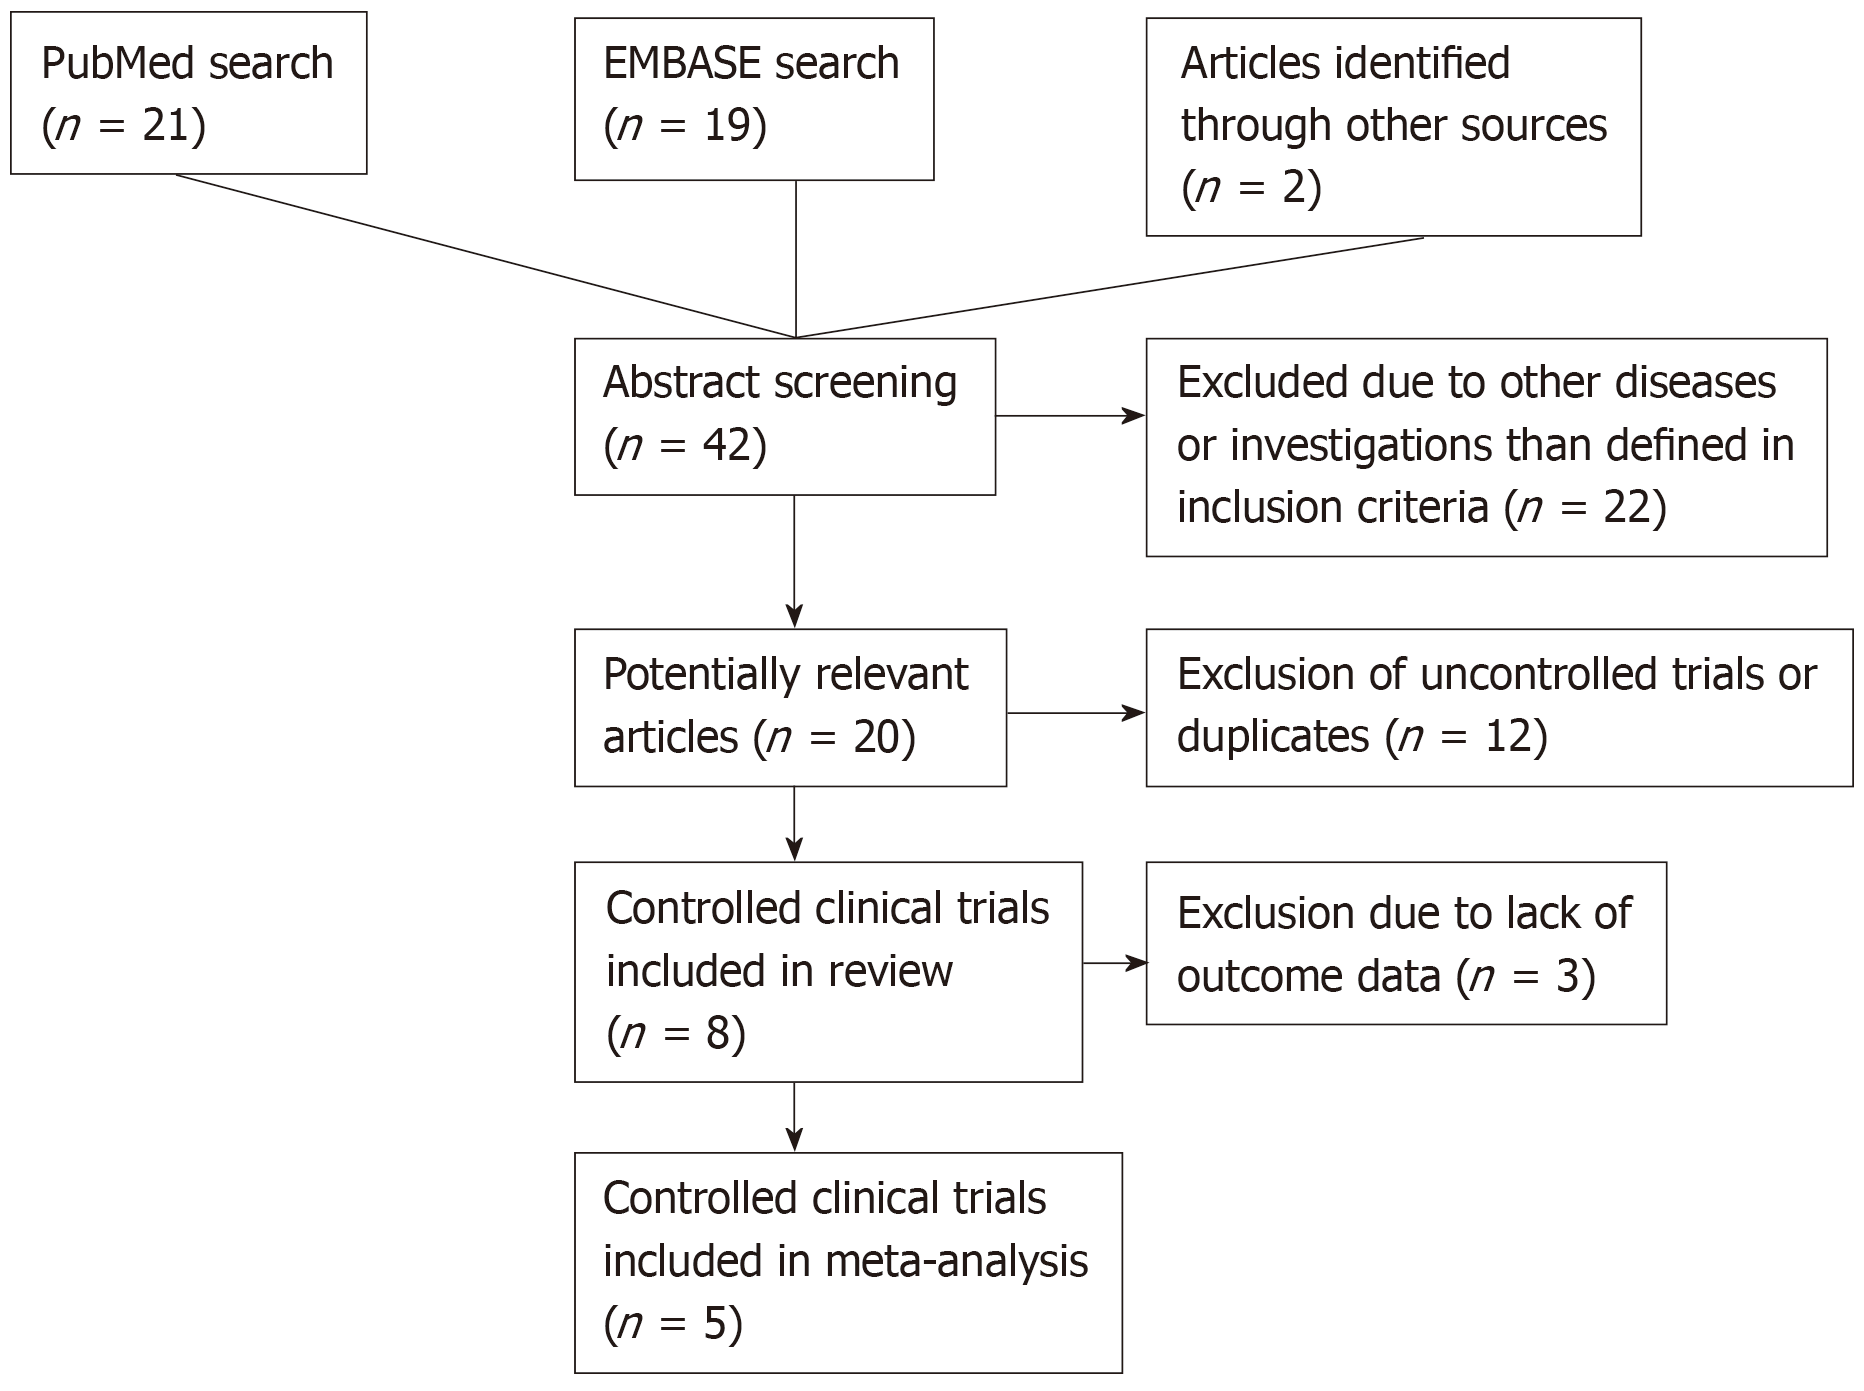
Figure 1 Study selection process.
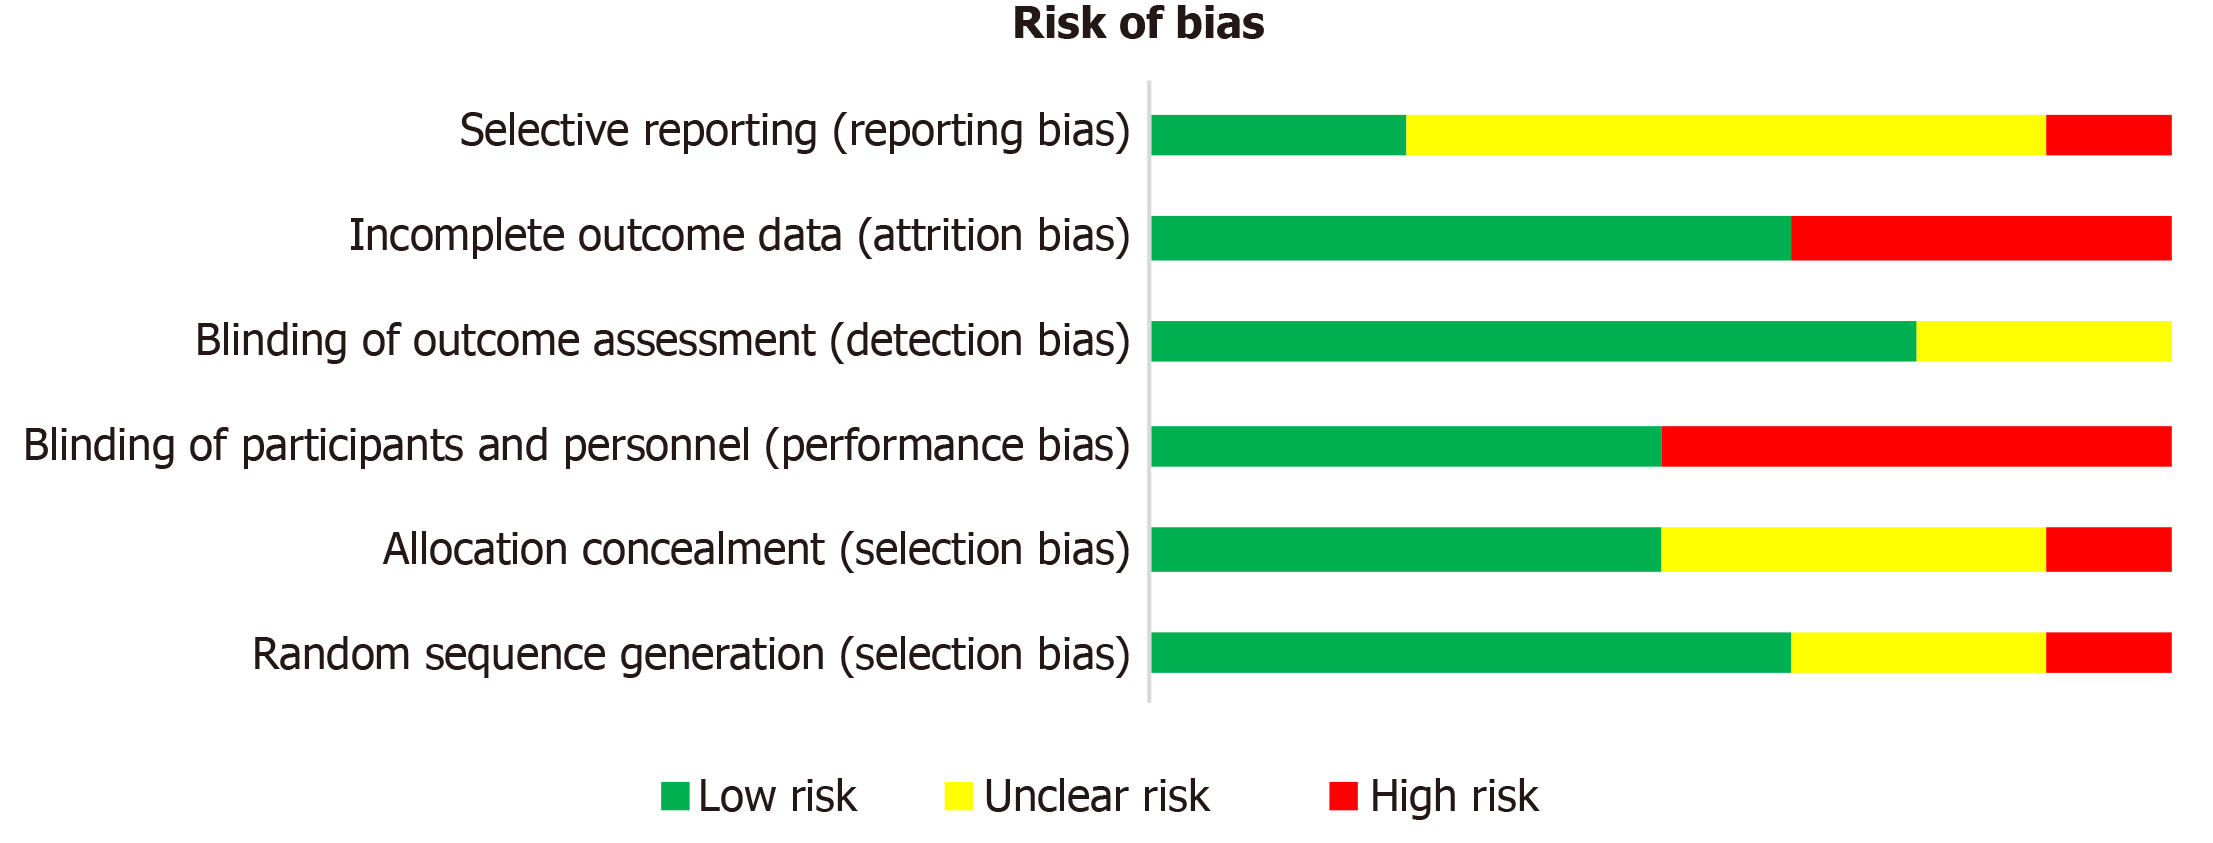
Figure 2 Overall risk of bias.
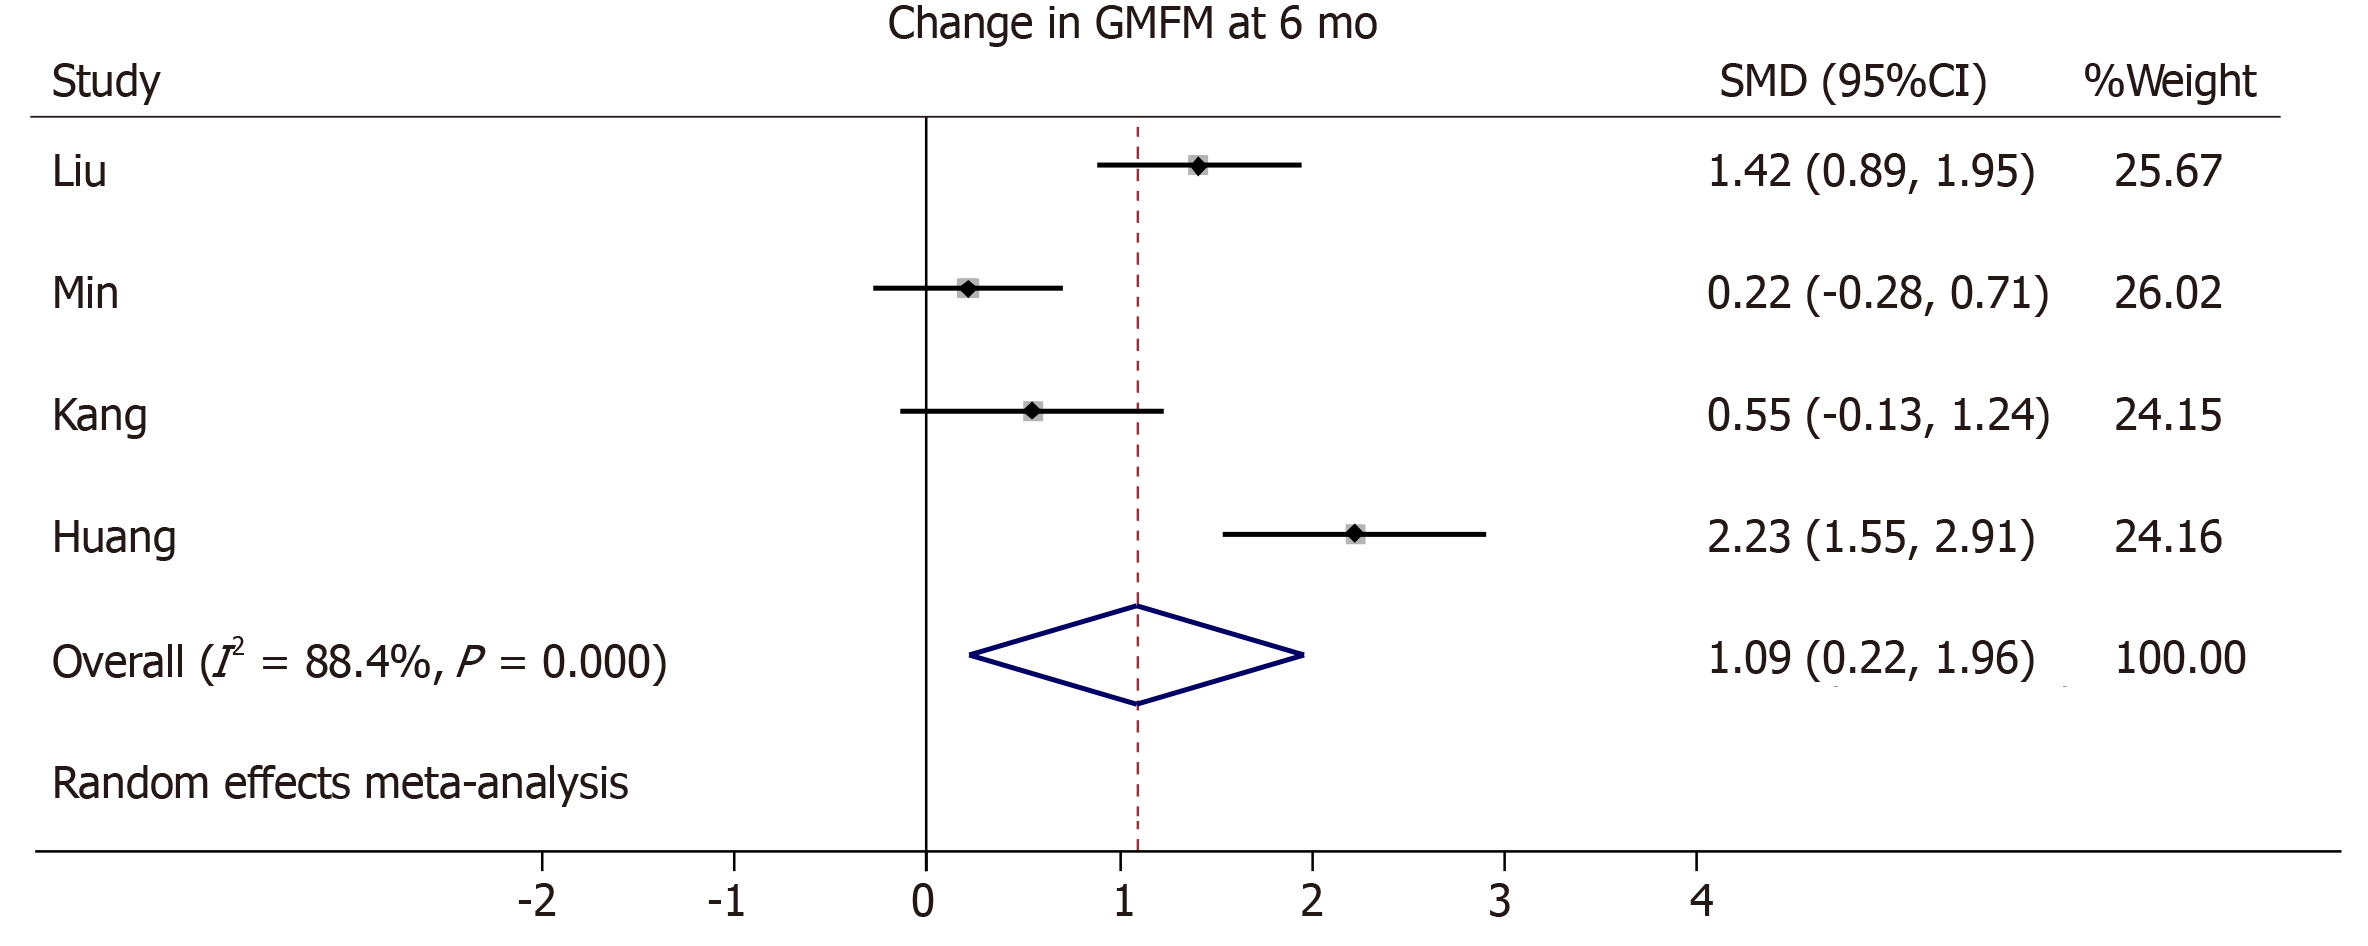
Figure 3 Forest plot showing the effect size of the change in the Gross Motor Function Measure in the intervention group compared to the control group after 6 mo.
GMFM: Gross Motor Function Measure; SMD: Standard mean difference; CI: Confidence interval.
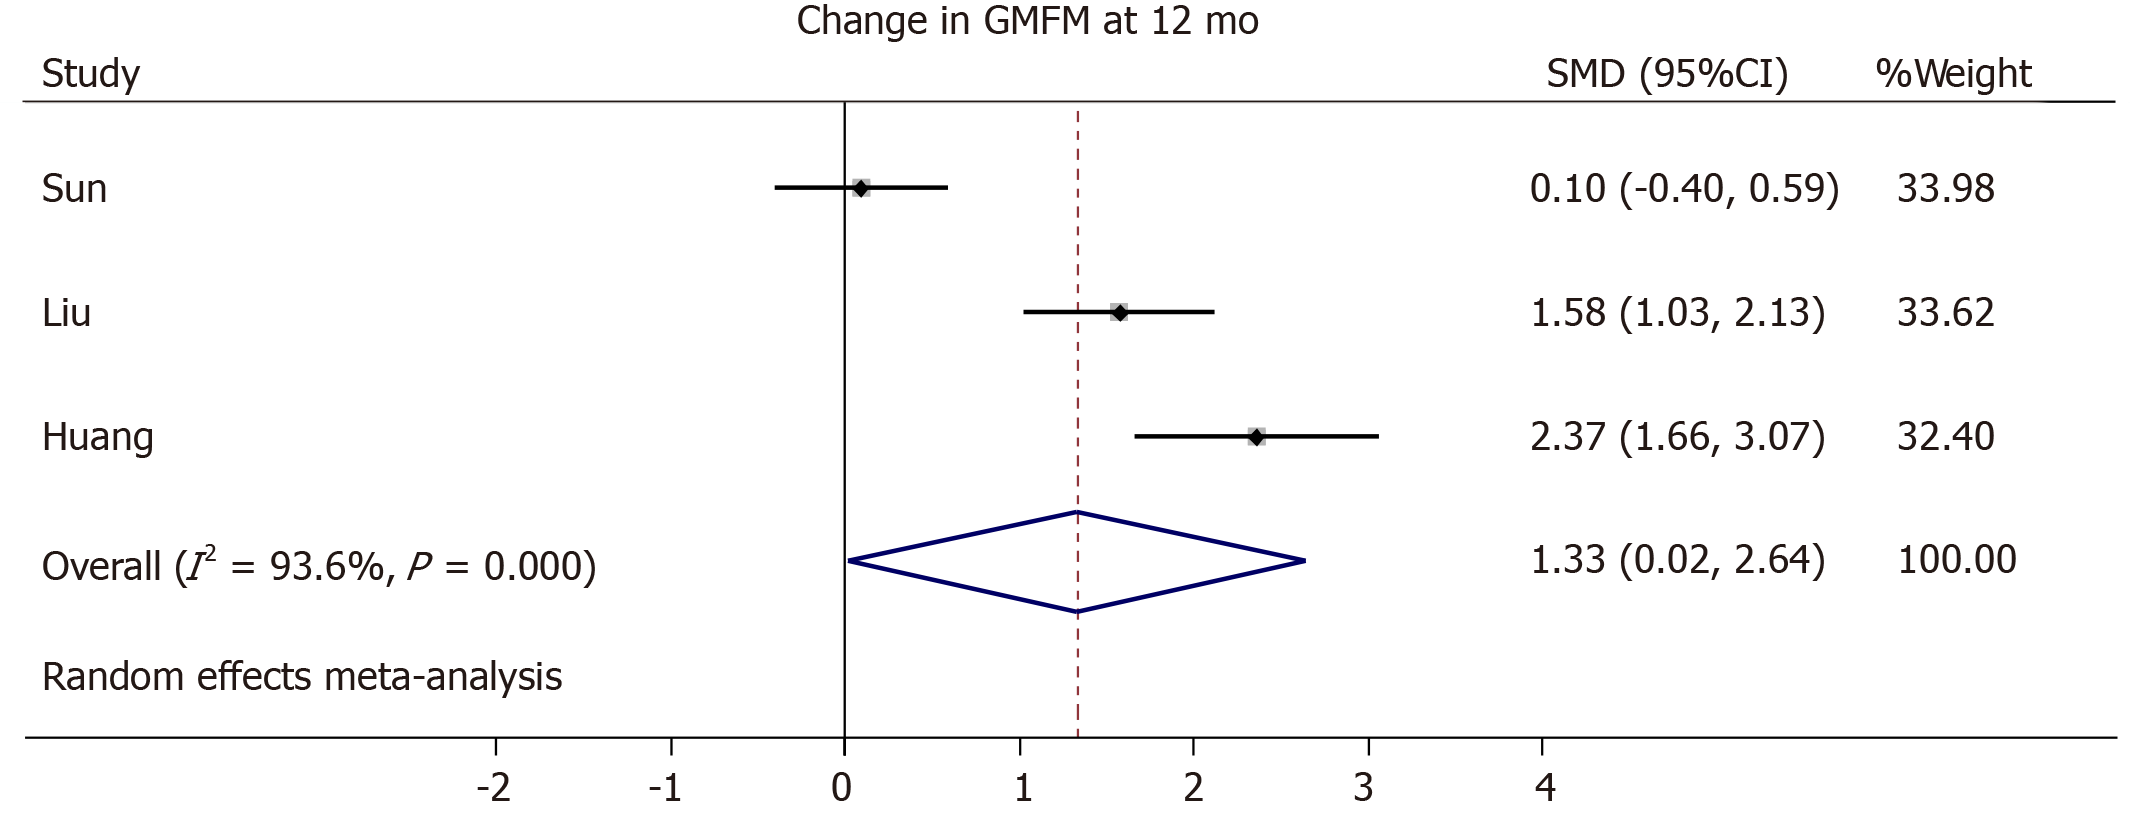
Figure 4 Forest plot showing the effect size of the change in the Gross Motor Function Measure in the intervention group compared to the control group after 12 mo.
GMFM: Gross Motor Function Measure; SMD: Standard mean difference; CI: Confidence interval.
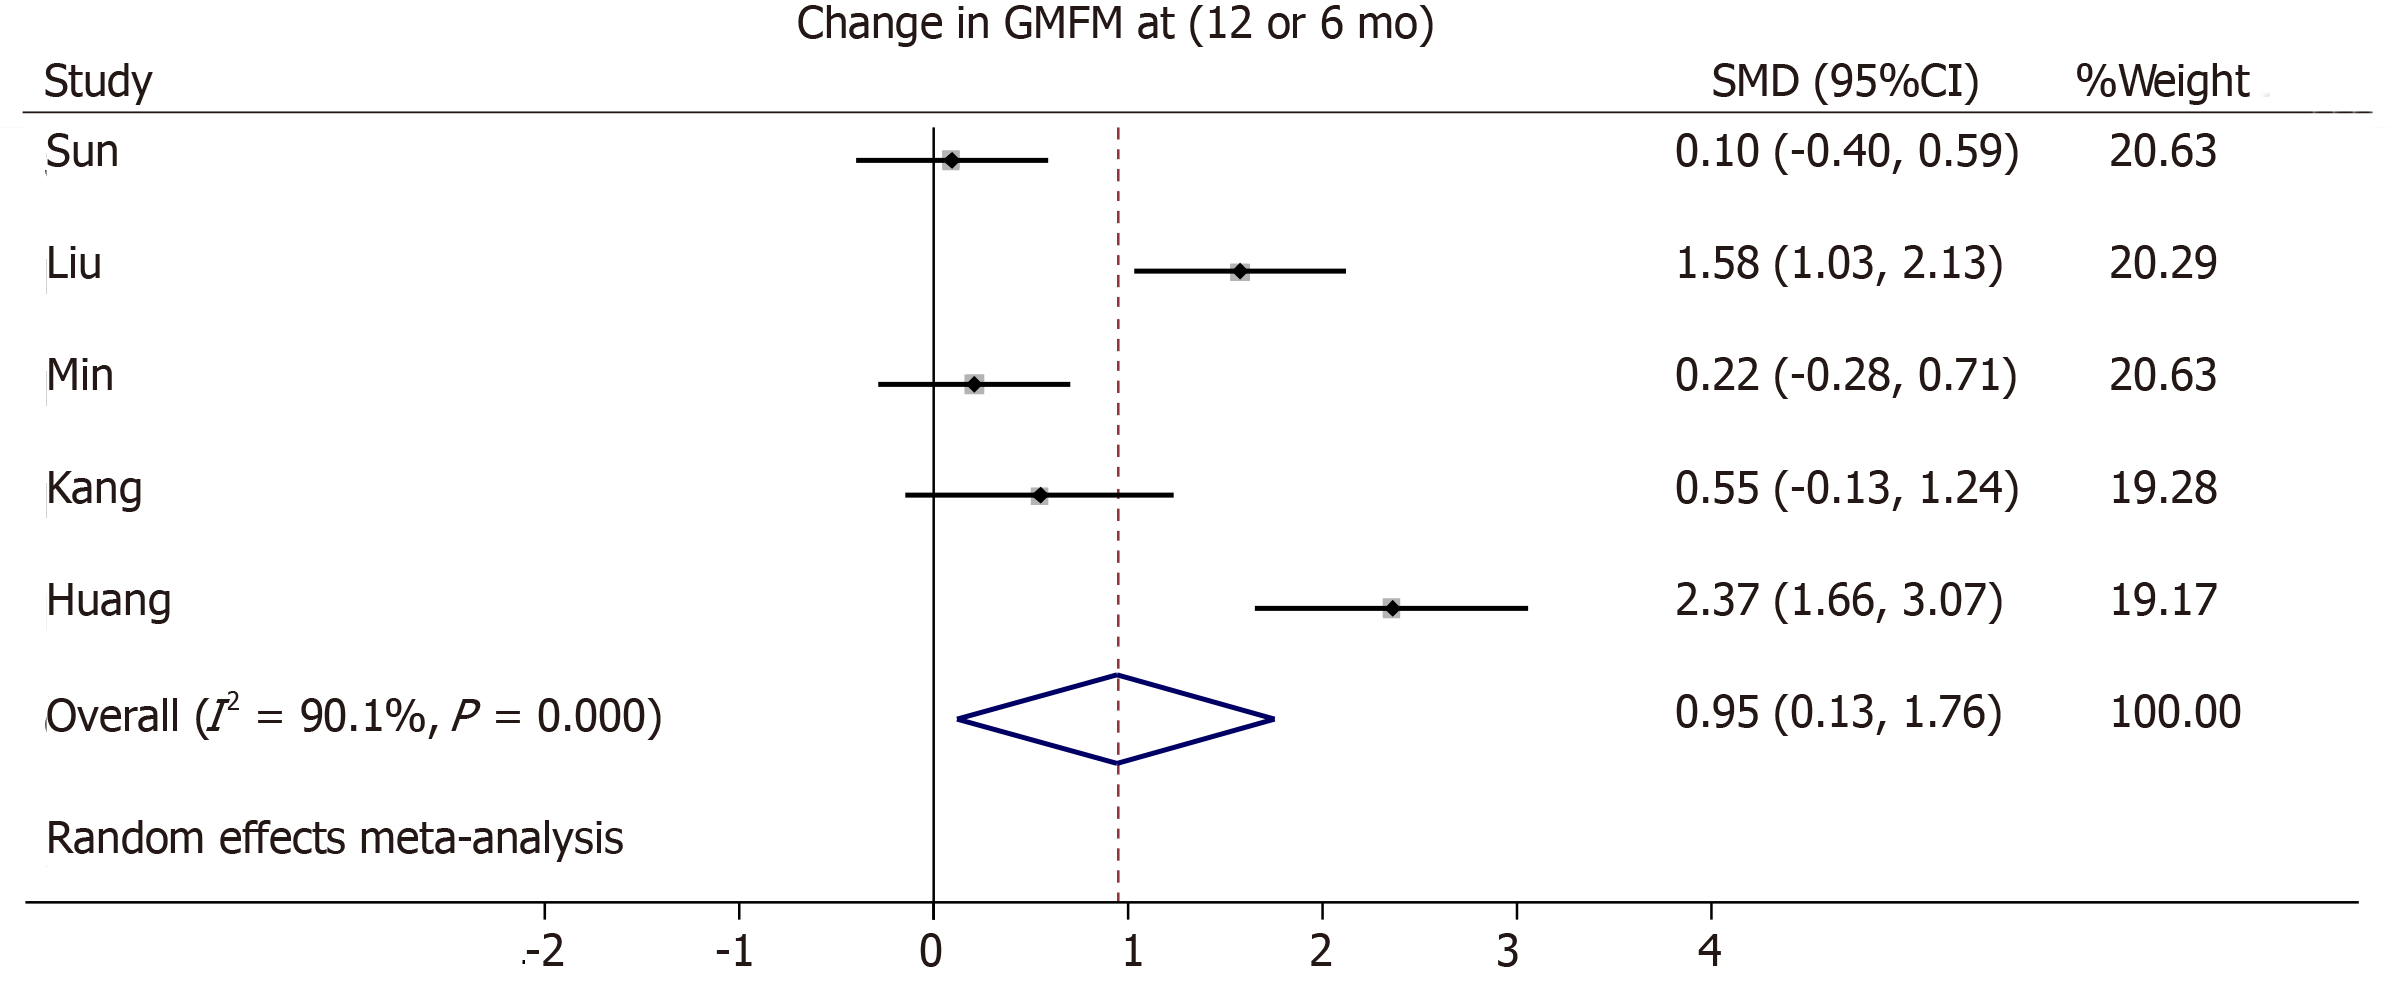
Figure 5 Forest plot showing the effect size of the change in the Gross Motor Function Measure in the intervention group compared to the control group.
If available, measures at 12 mo were used[40,41,46], else, measures at 6 mo were used[39,47]. GMFM: Gross Motor Function Measure; SMD: Standard mean difference; CI: Confidence interval.
- Citation: Eggenberger S, Boucard C, Schoeberlein A, Guzman R, Limacher A, Surbek D, Mueller M. Stem cell treatment and cerebral palsy: Systemic review and meta-analysis. World J Stem Cells 2019; 11(10): 891-903
- URL: https://www.wjgnet.com/1948-0210/full/v11/i10/891.htm
- DOI: https://dx.doi.org/10.4252/wjsc.v11.i10.891


