Copyright
©The Author(s) 2019.
World J Stem Cells. Oct 26, 2019; 11(10): 859-890
Published online Oct 26, 2019. doi: 10.4252/wjsc.v11.i10.859
Published online Oct 26, 2019. doi: 10.4252/wjsc.v11.i10.859
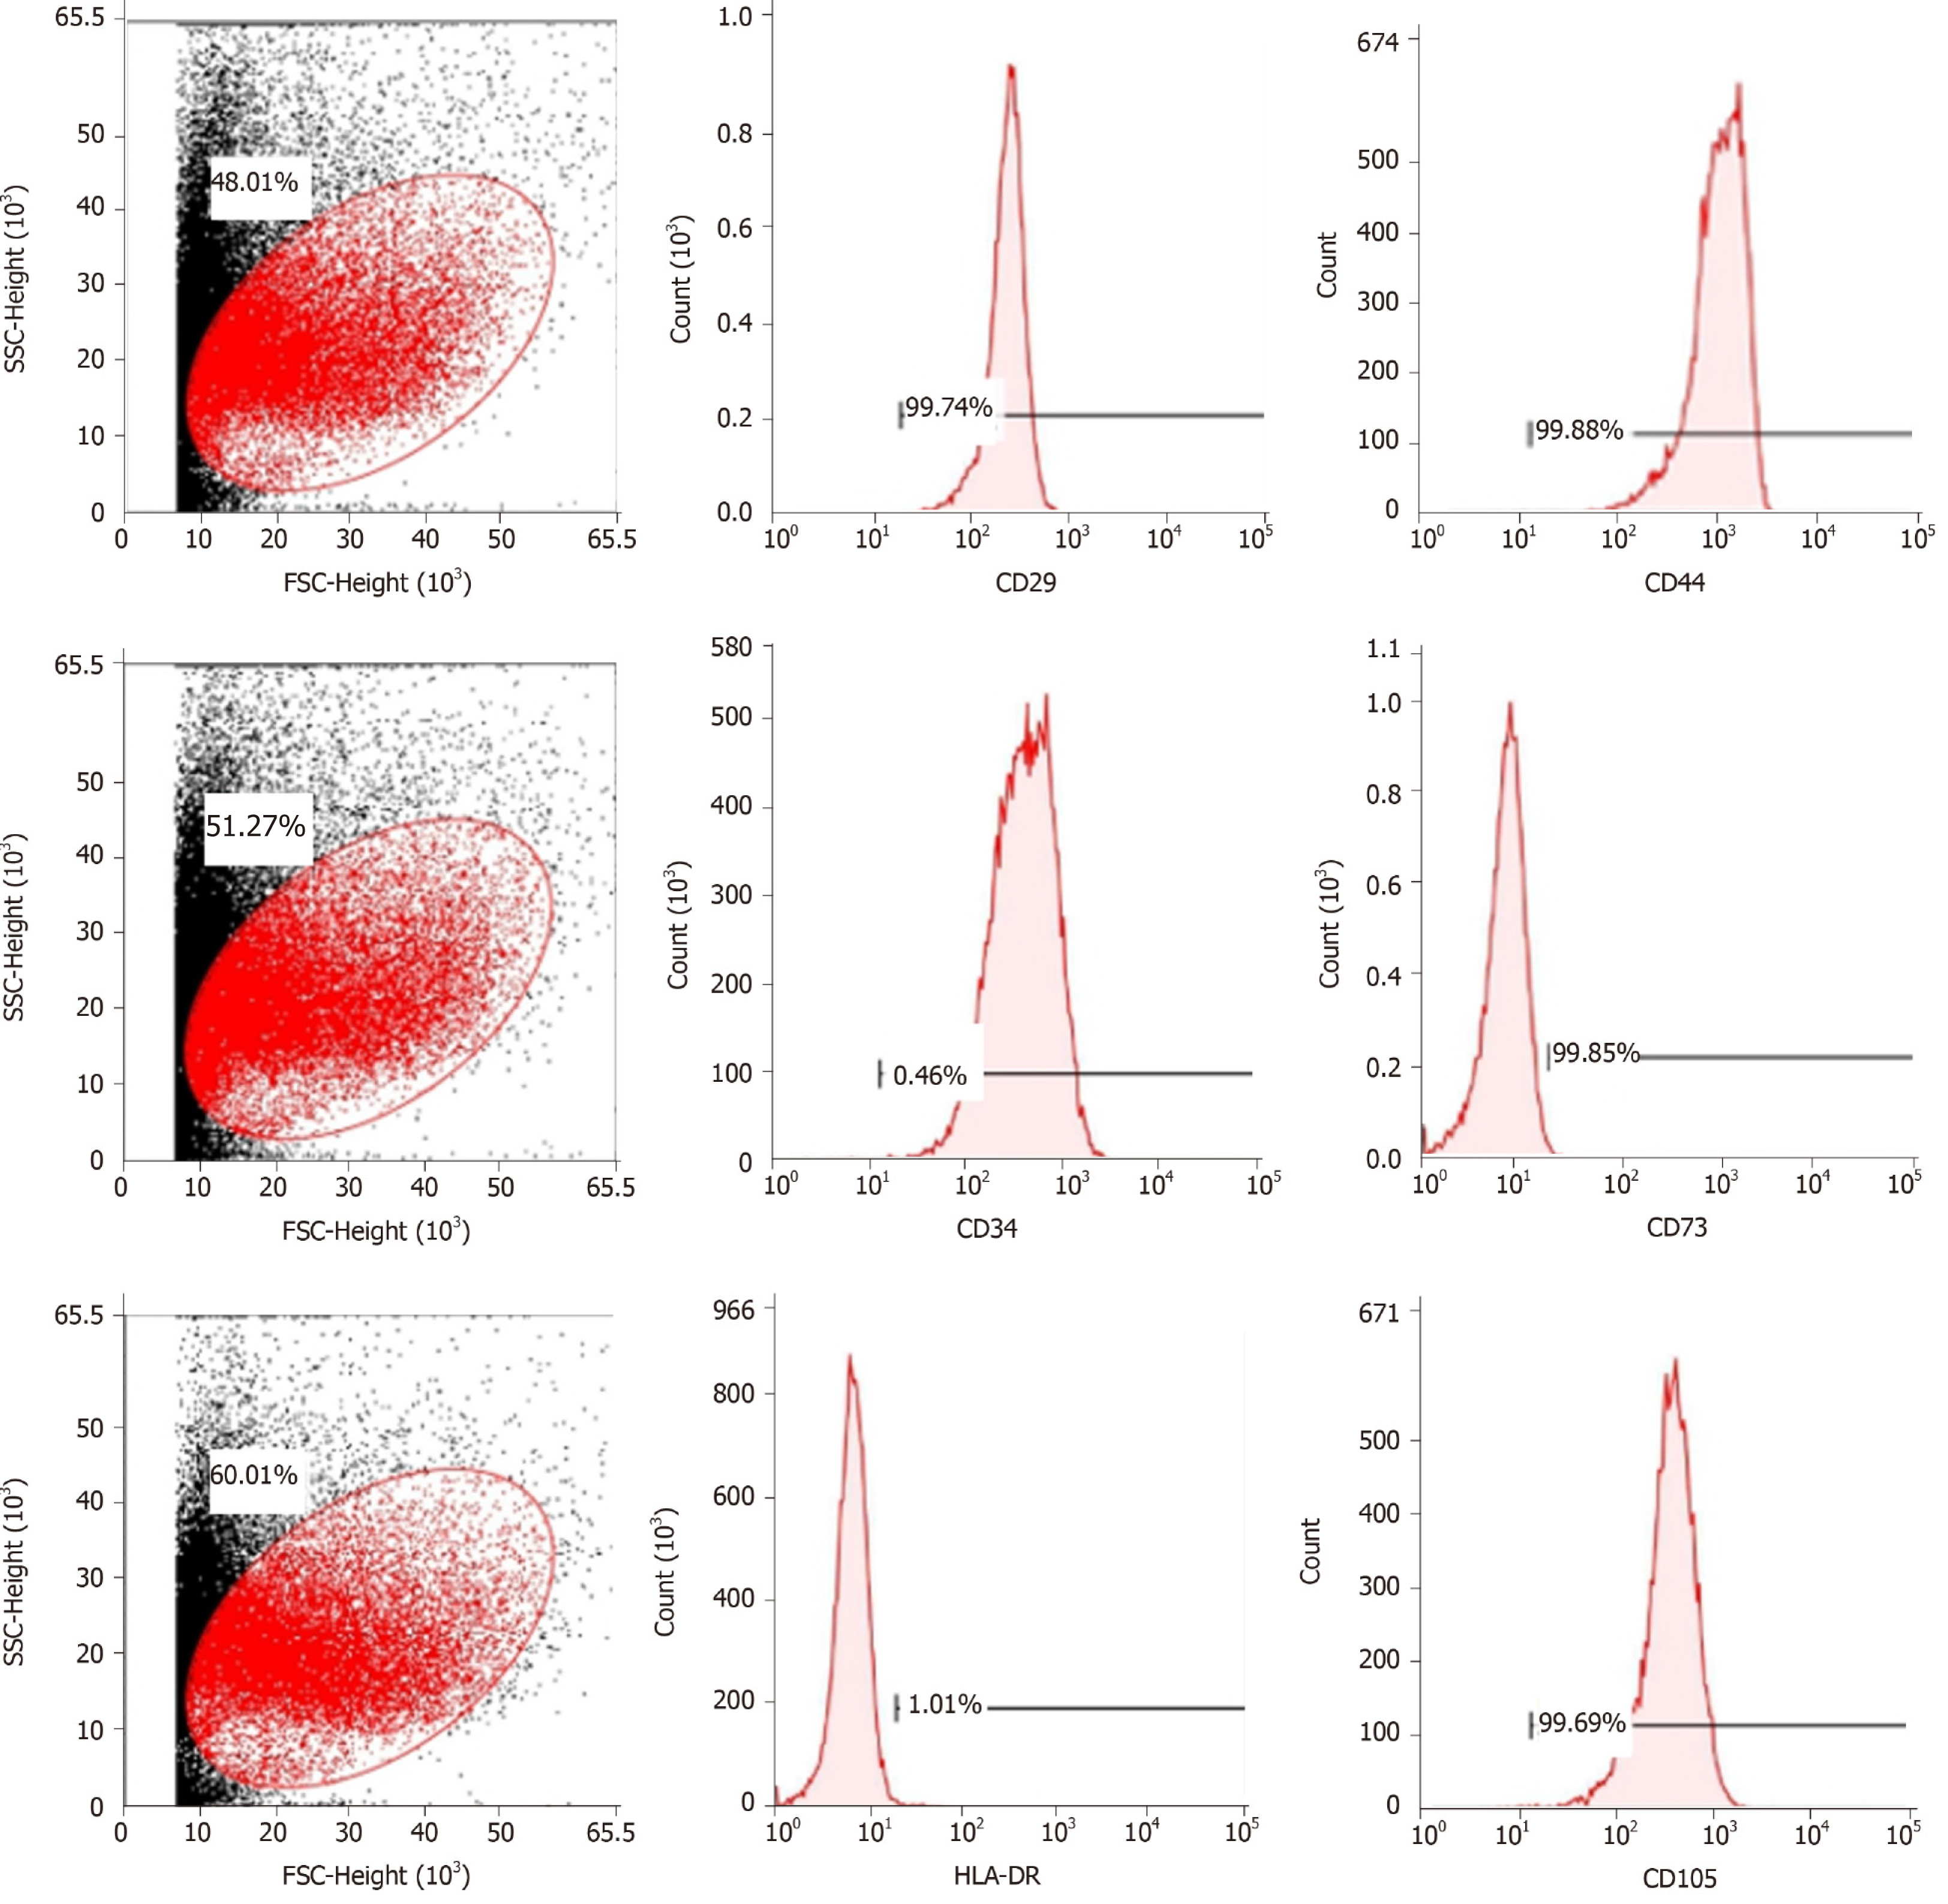
Figure 1 Flow cytometric analysis of mesenchymal stem cell-related cell surface markers.
High expression of positive mesenchymal cell markers (CD29, CD44, CD73, and CD105), and low expression of negative cell markers such as CD34 and HLA-DR were observed. n = 3 to 5; P < 0.05,
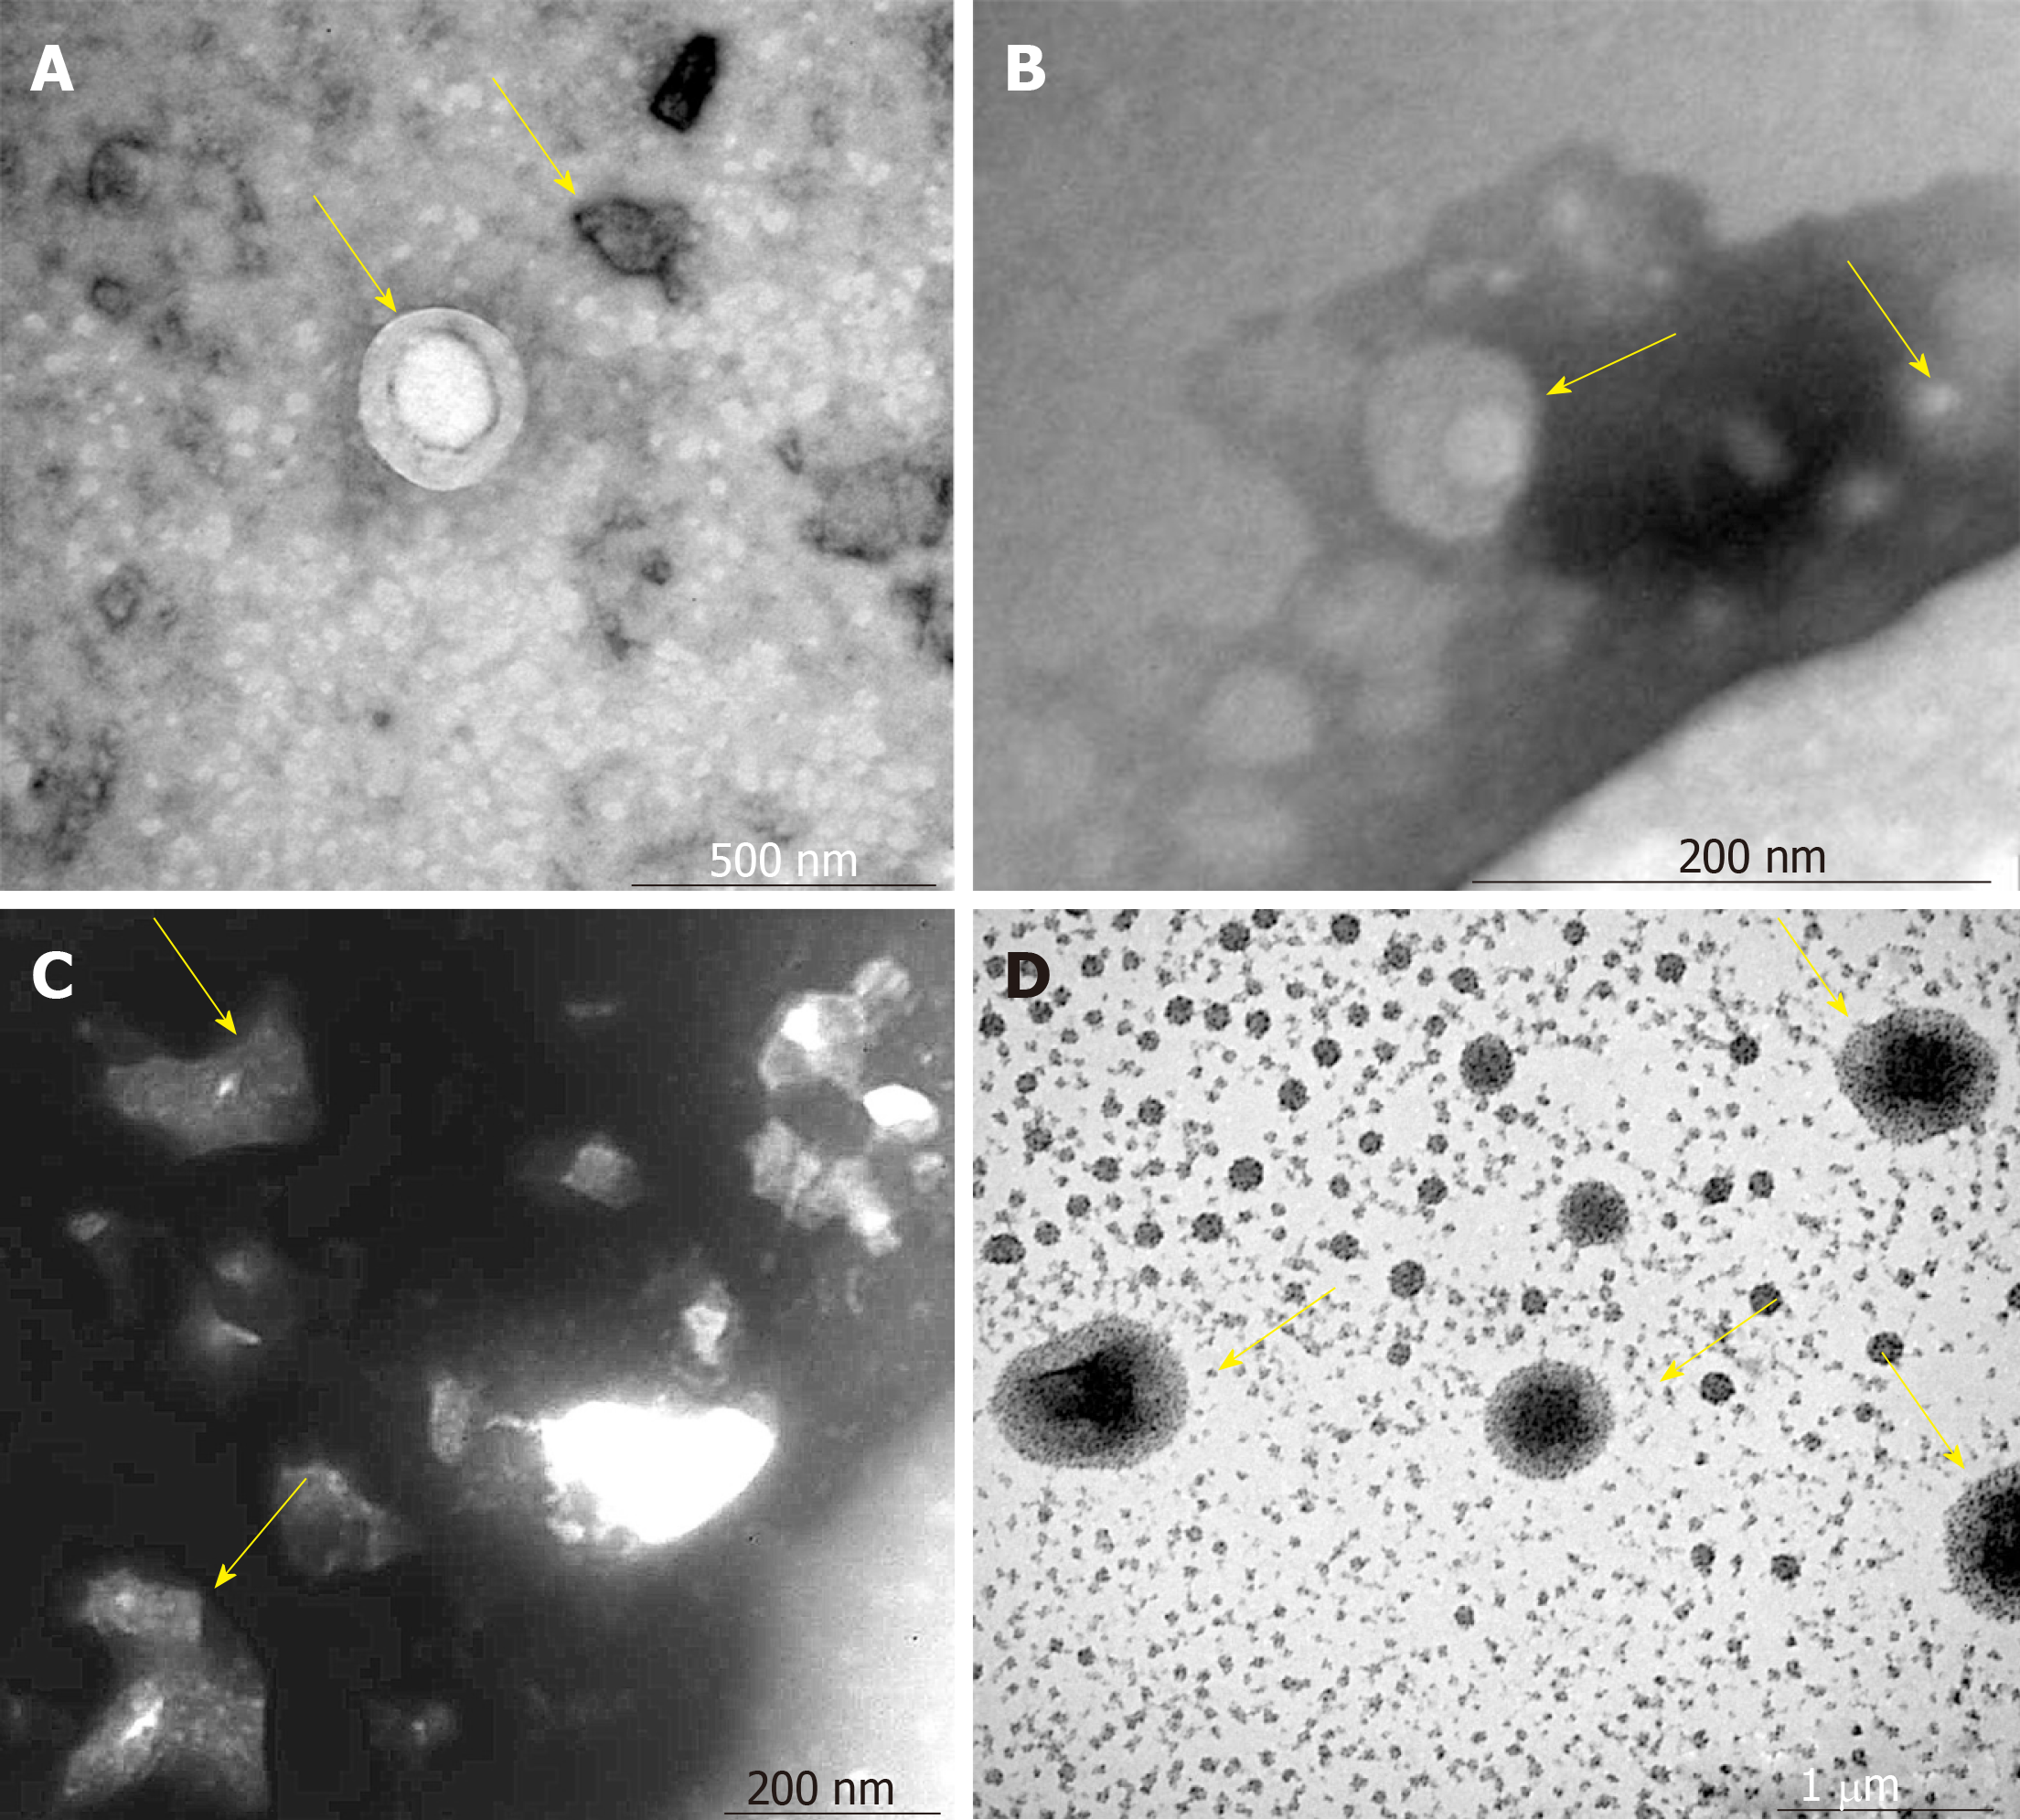
Figure 2 Morphology of mesenchymal stem cell exosomes (magnification, ×65000).
A-D: Mesenchymal stem cell exosomes (MSCs-exo) in (A) the control group (yellow arrow), (B) the vascular cell adhesion molecule-1 group (yellow arrow), (C) the tumor necrosis factor α group (yellow arrow), and (D) the interleukin 6 group (yellow arrow).
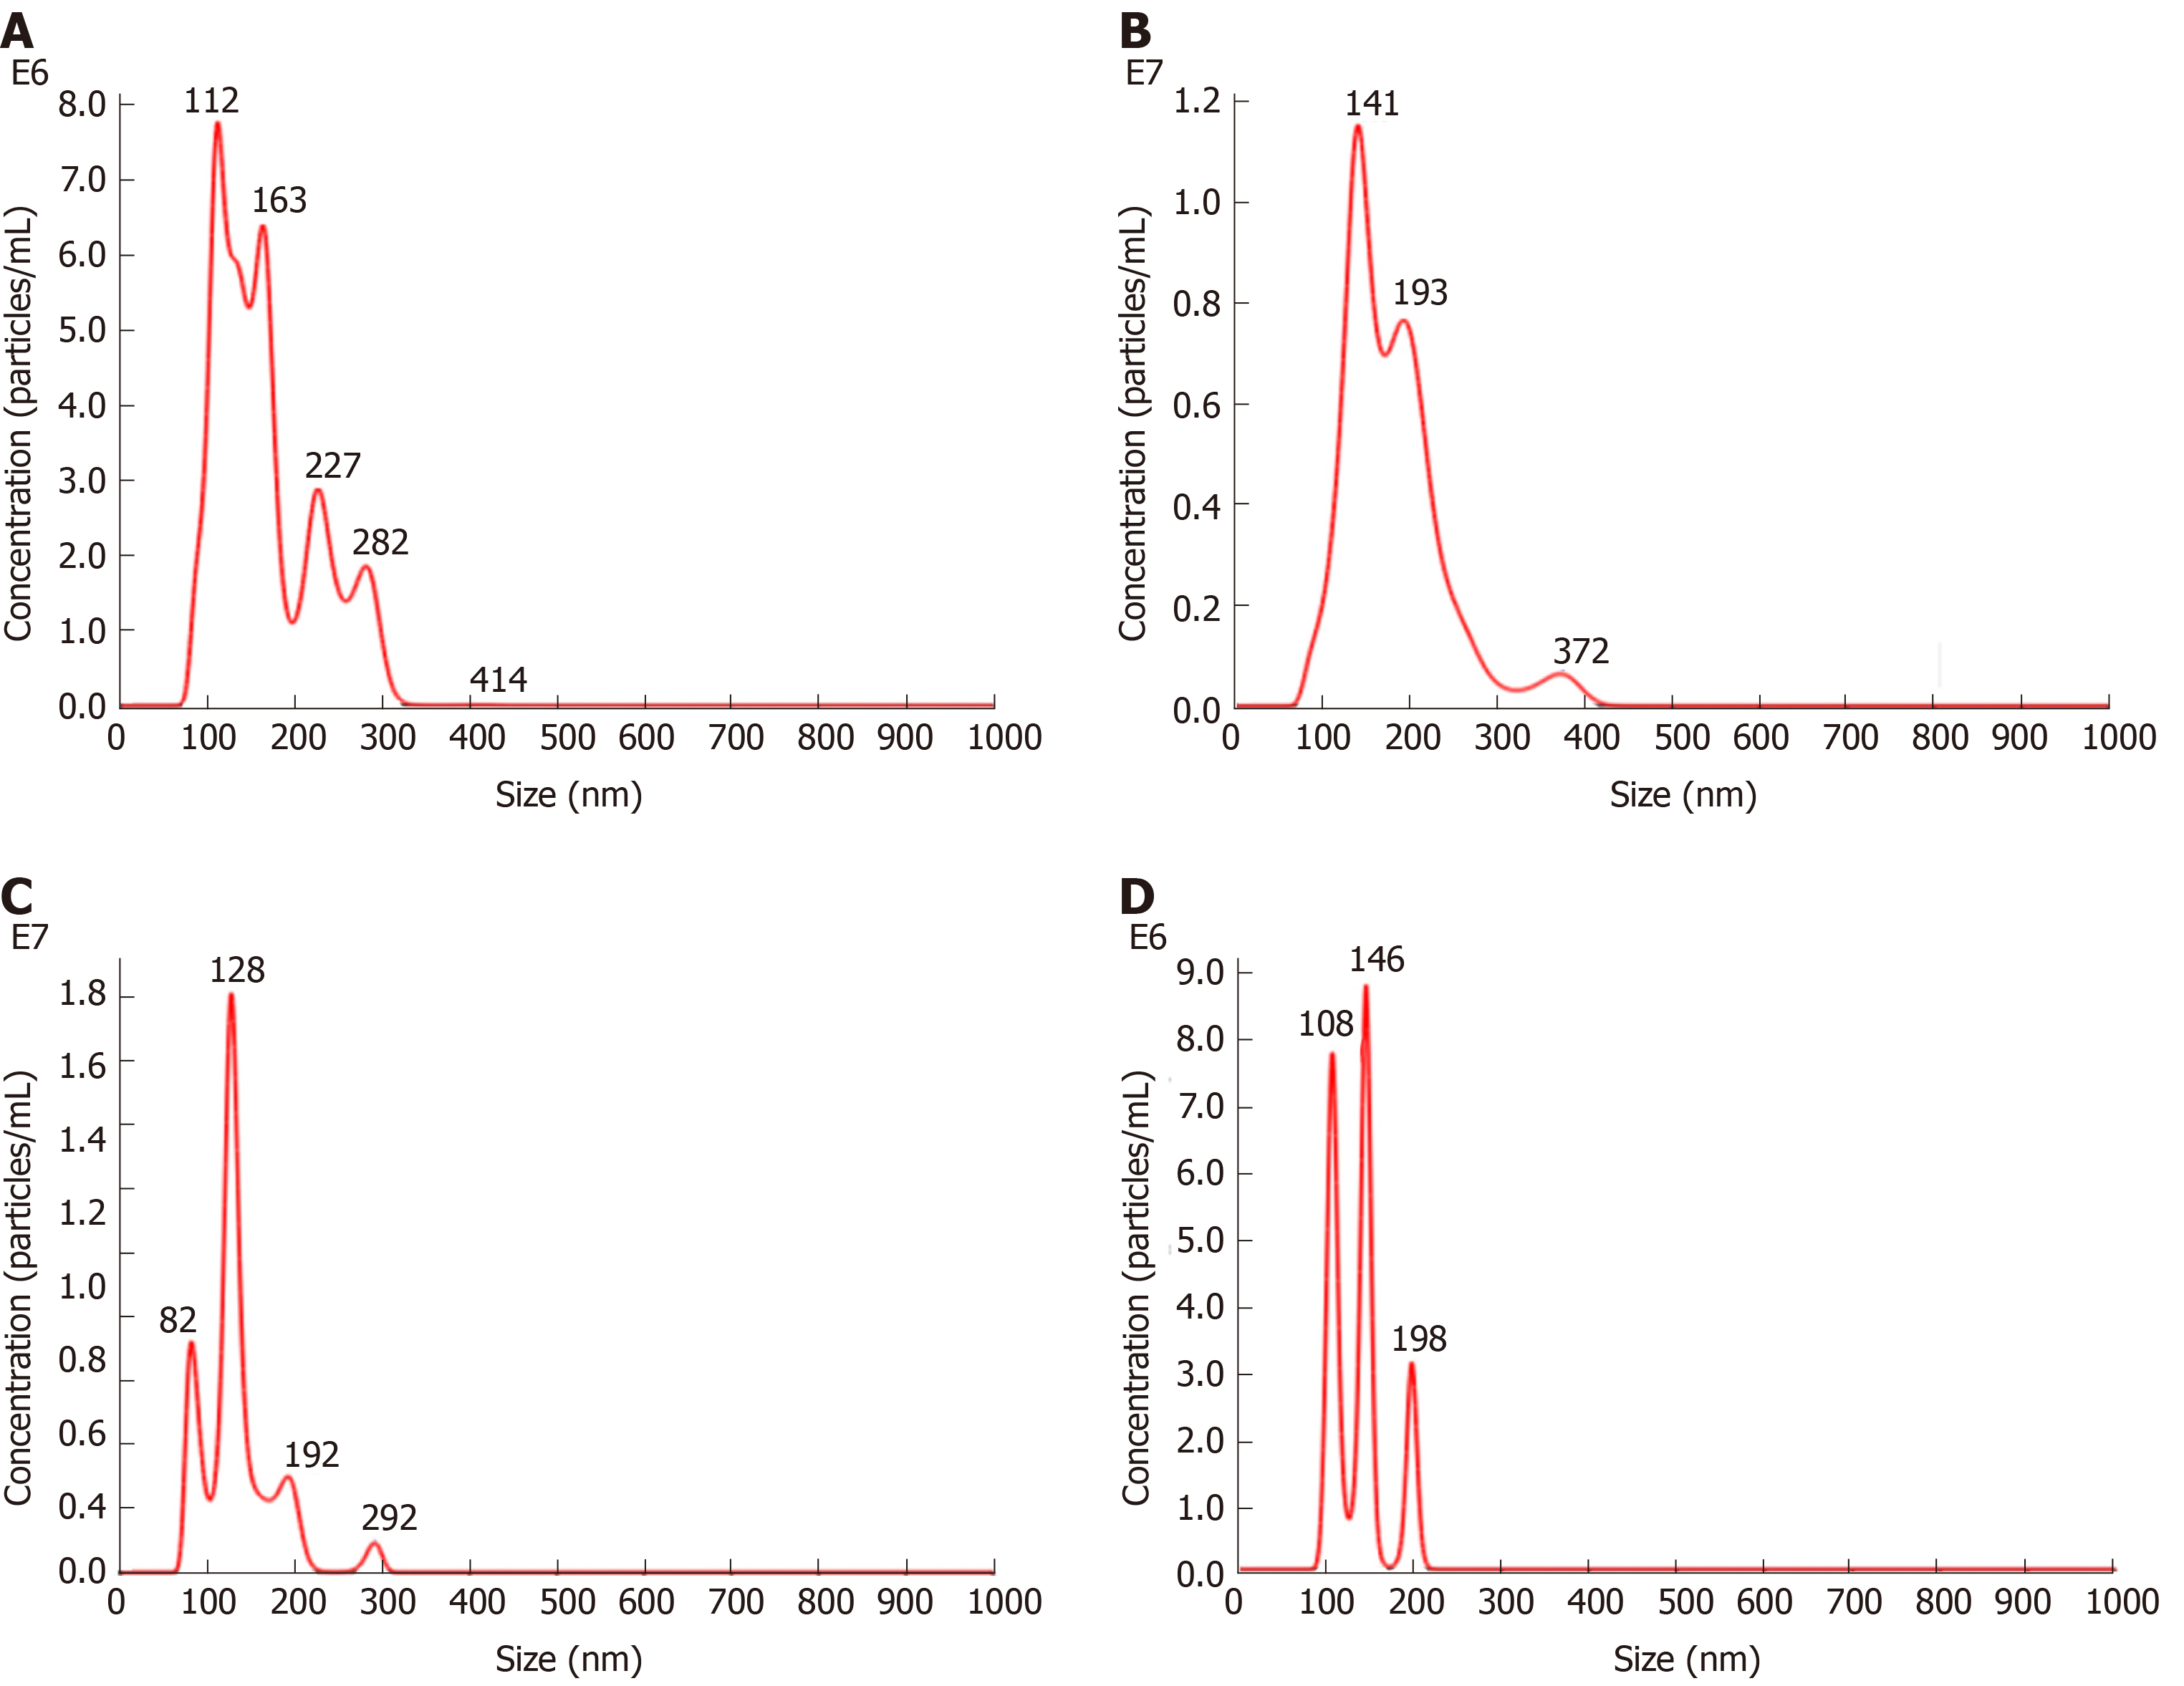
Figure 3 Nanoparticle tracking analysis.
A-D: Density of exosomes of different sizes in (A) the control group, (B) the vascular cell adhesion molecule-1 group, (C) the tumor necrosis factor α group, and (D) the interleukin 6 group.
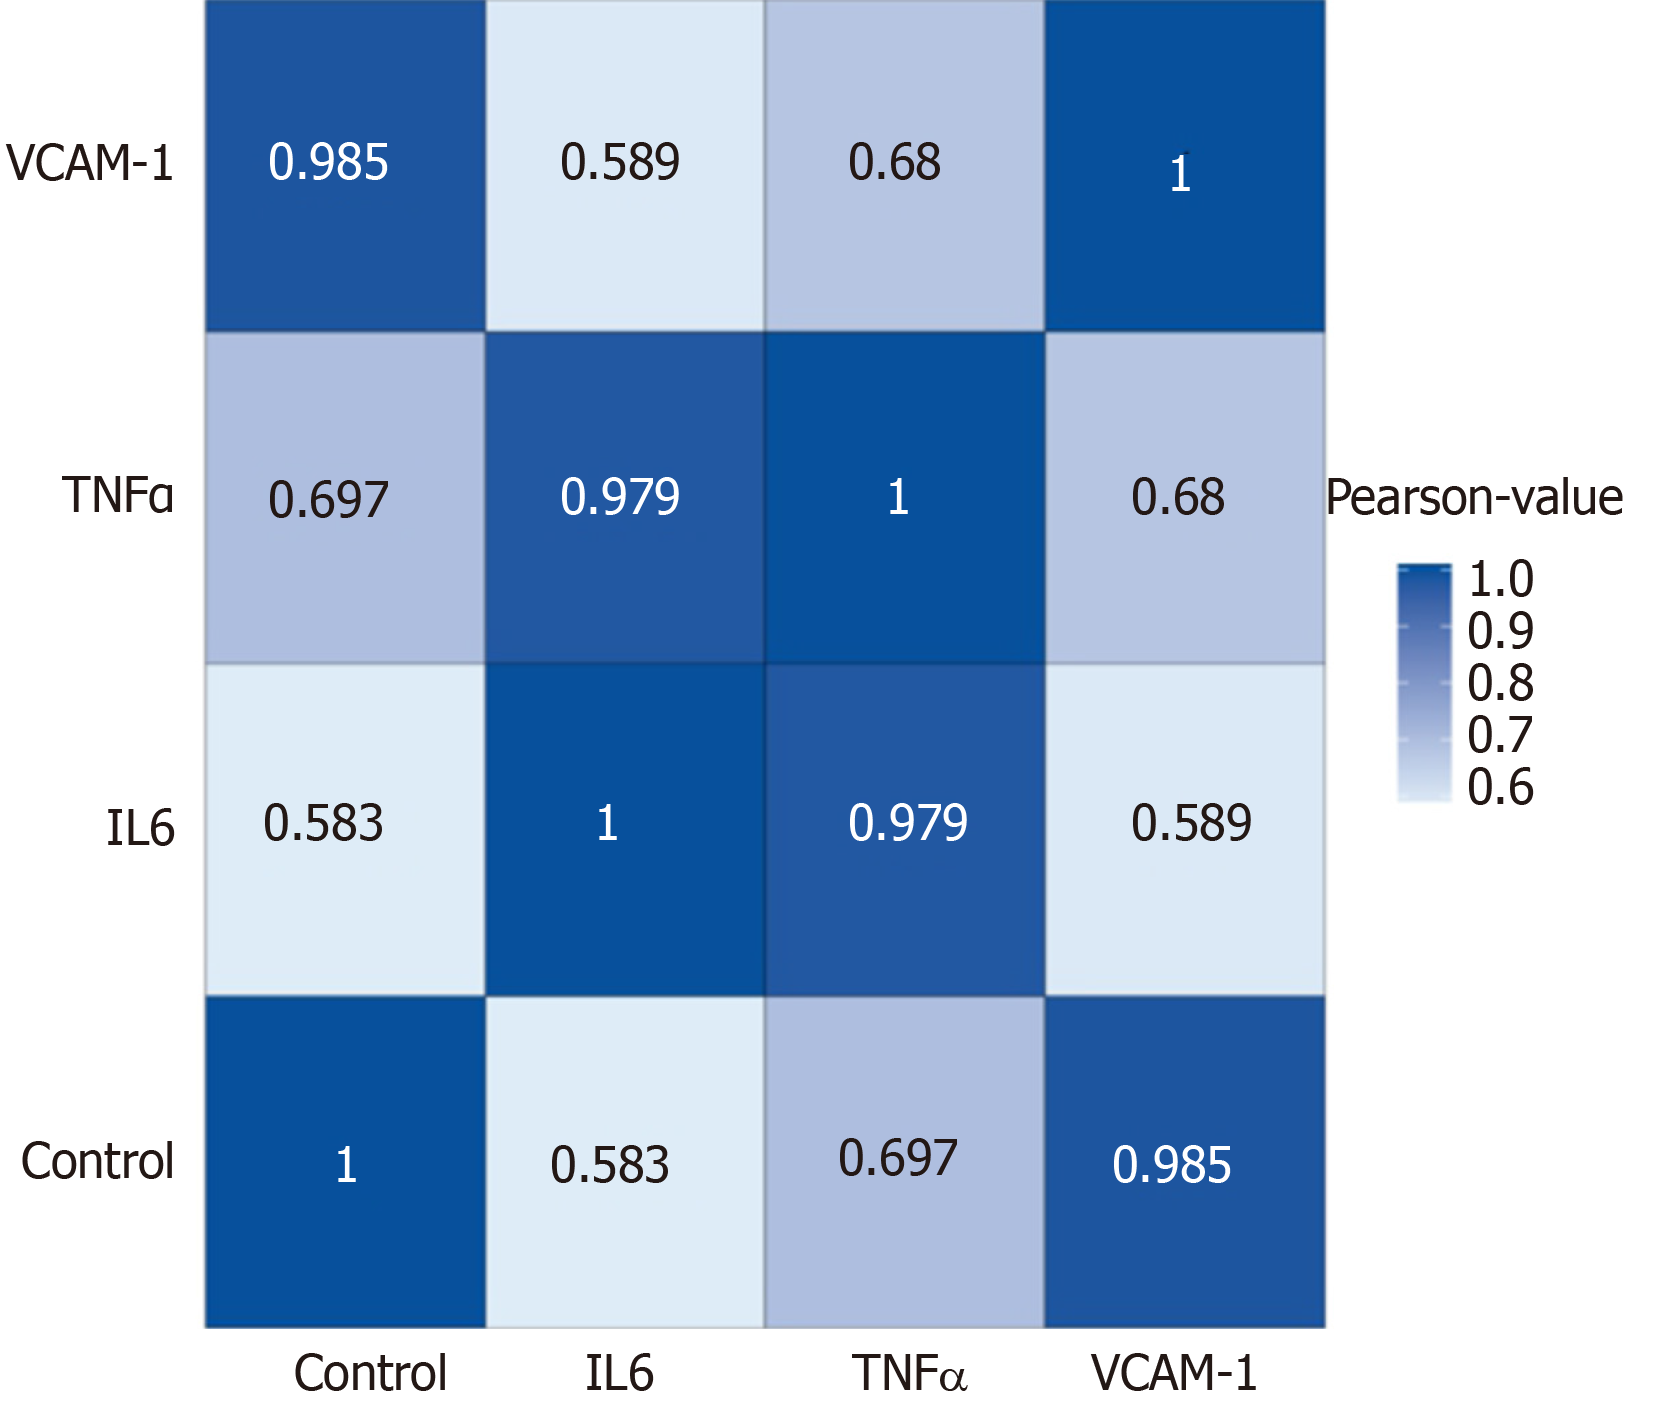
Figure 4 Correlation analyses between groups.
Blue color represents the correlation coefficient (the deeper the blue, the stronger the correlation). VCAM-1: Vascular cell adhesion molecule-1; TNF: Tumor necrosis factor; IL6: Interleukin 6.
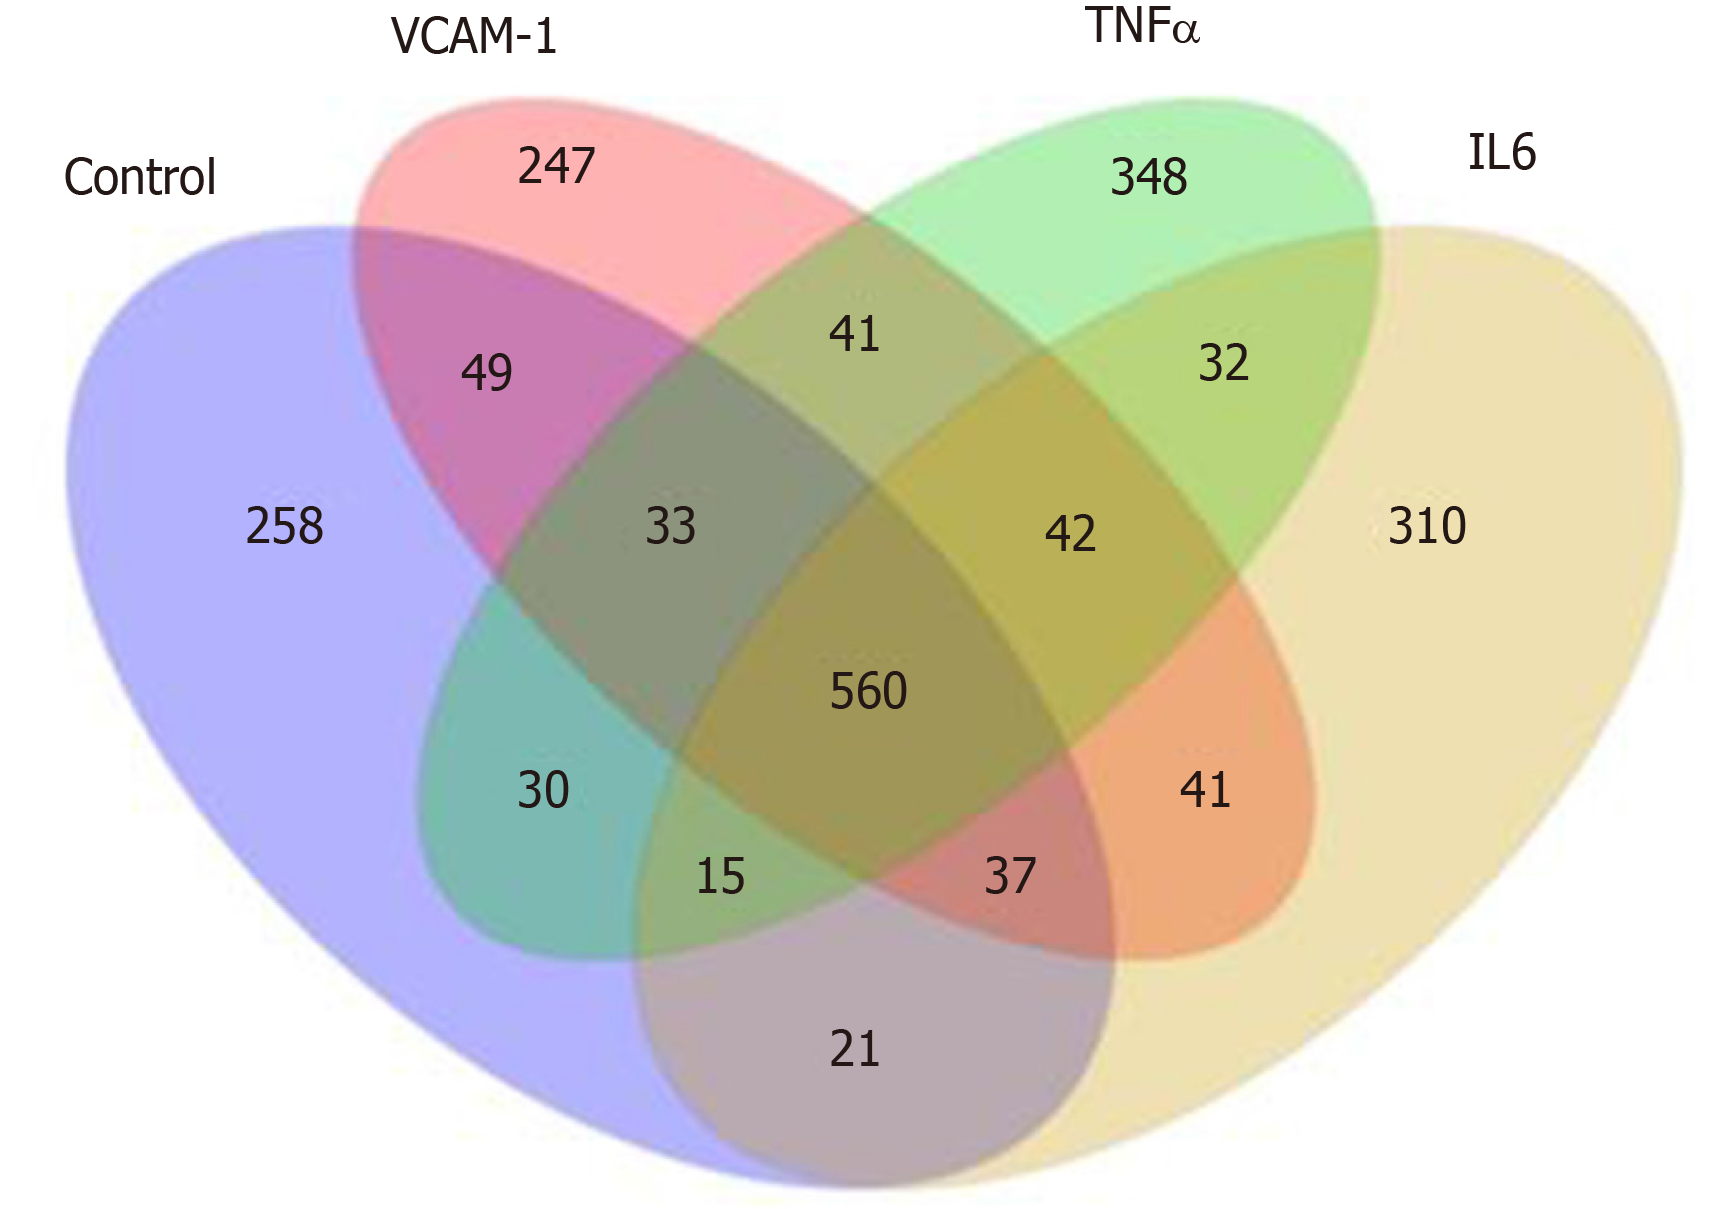
Figure 5 Distribution of differentially expressed miRNAs in different groups.
VCAM-1: Vascular cell adhesion molecule-1; TNF: Tumor necrosis factor; IL6: Interleukin 6.
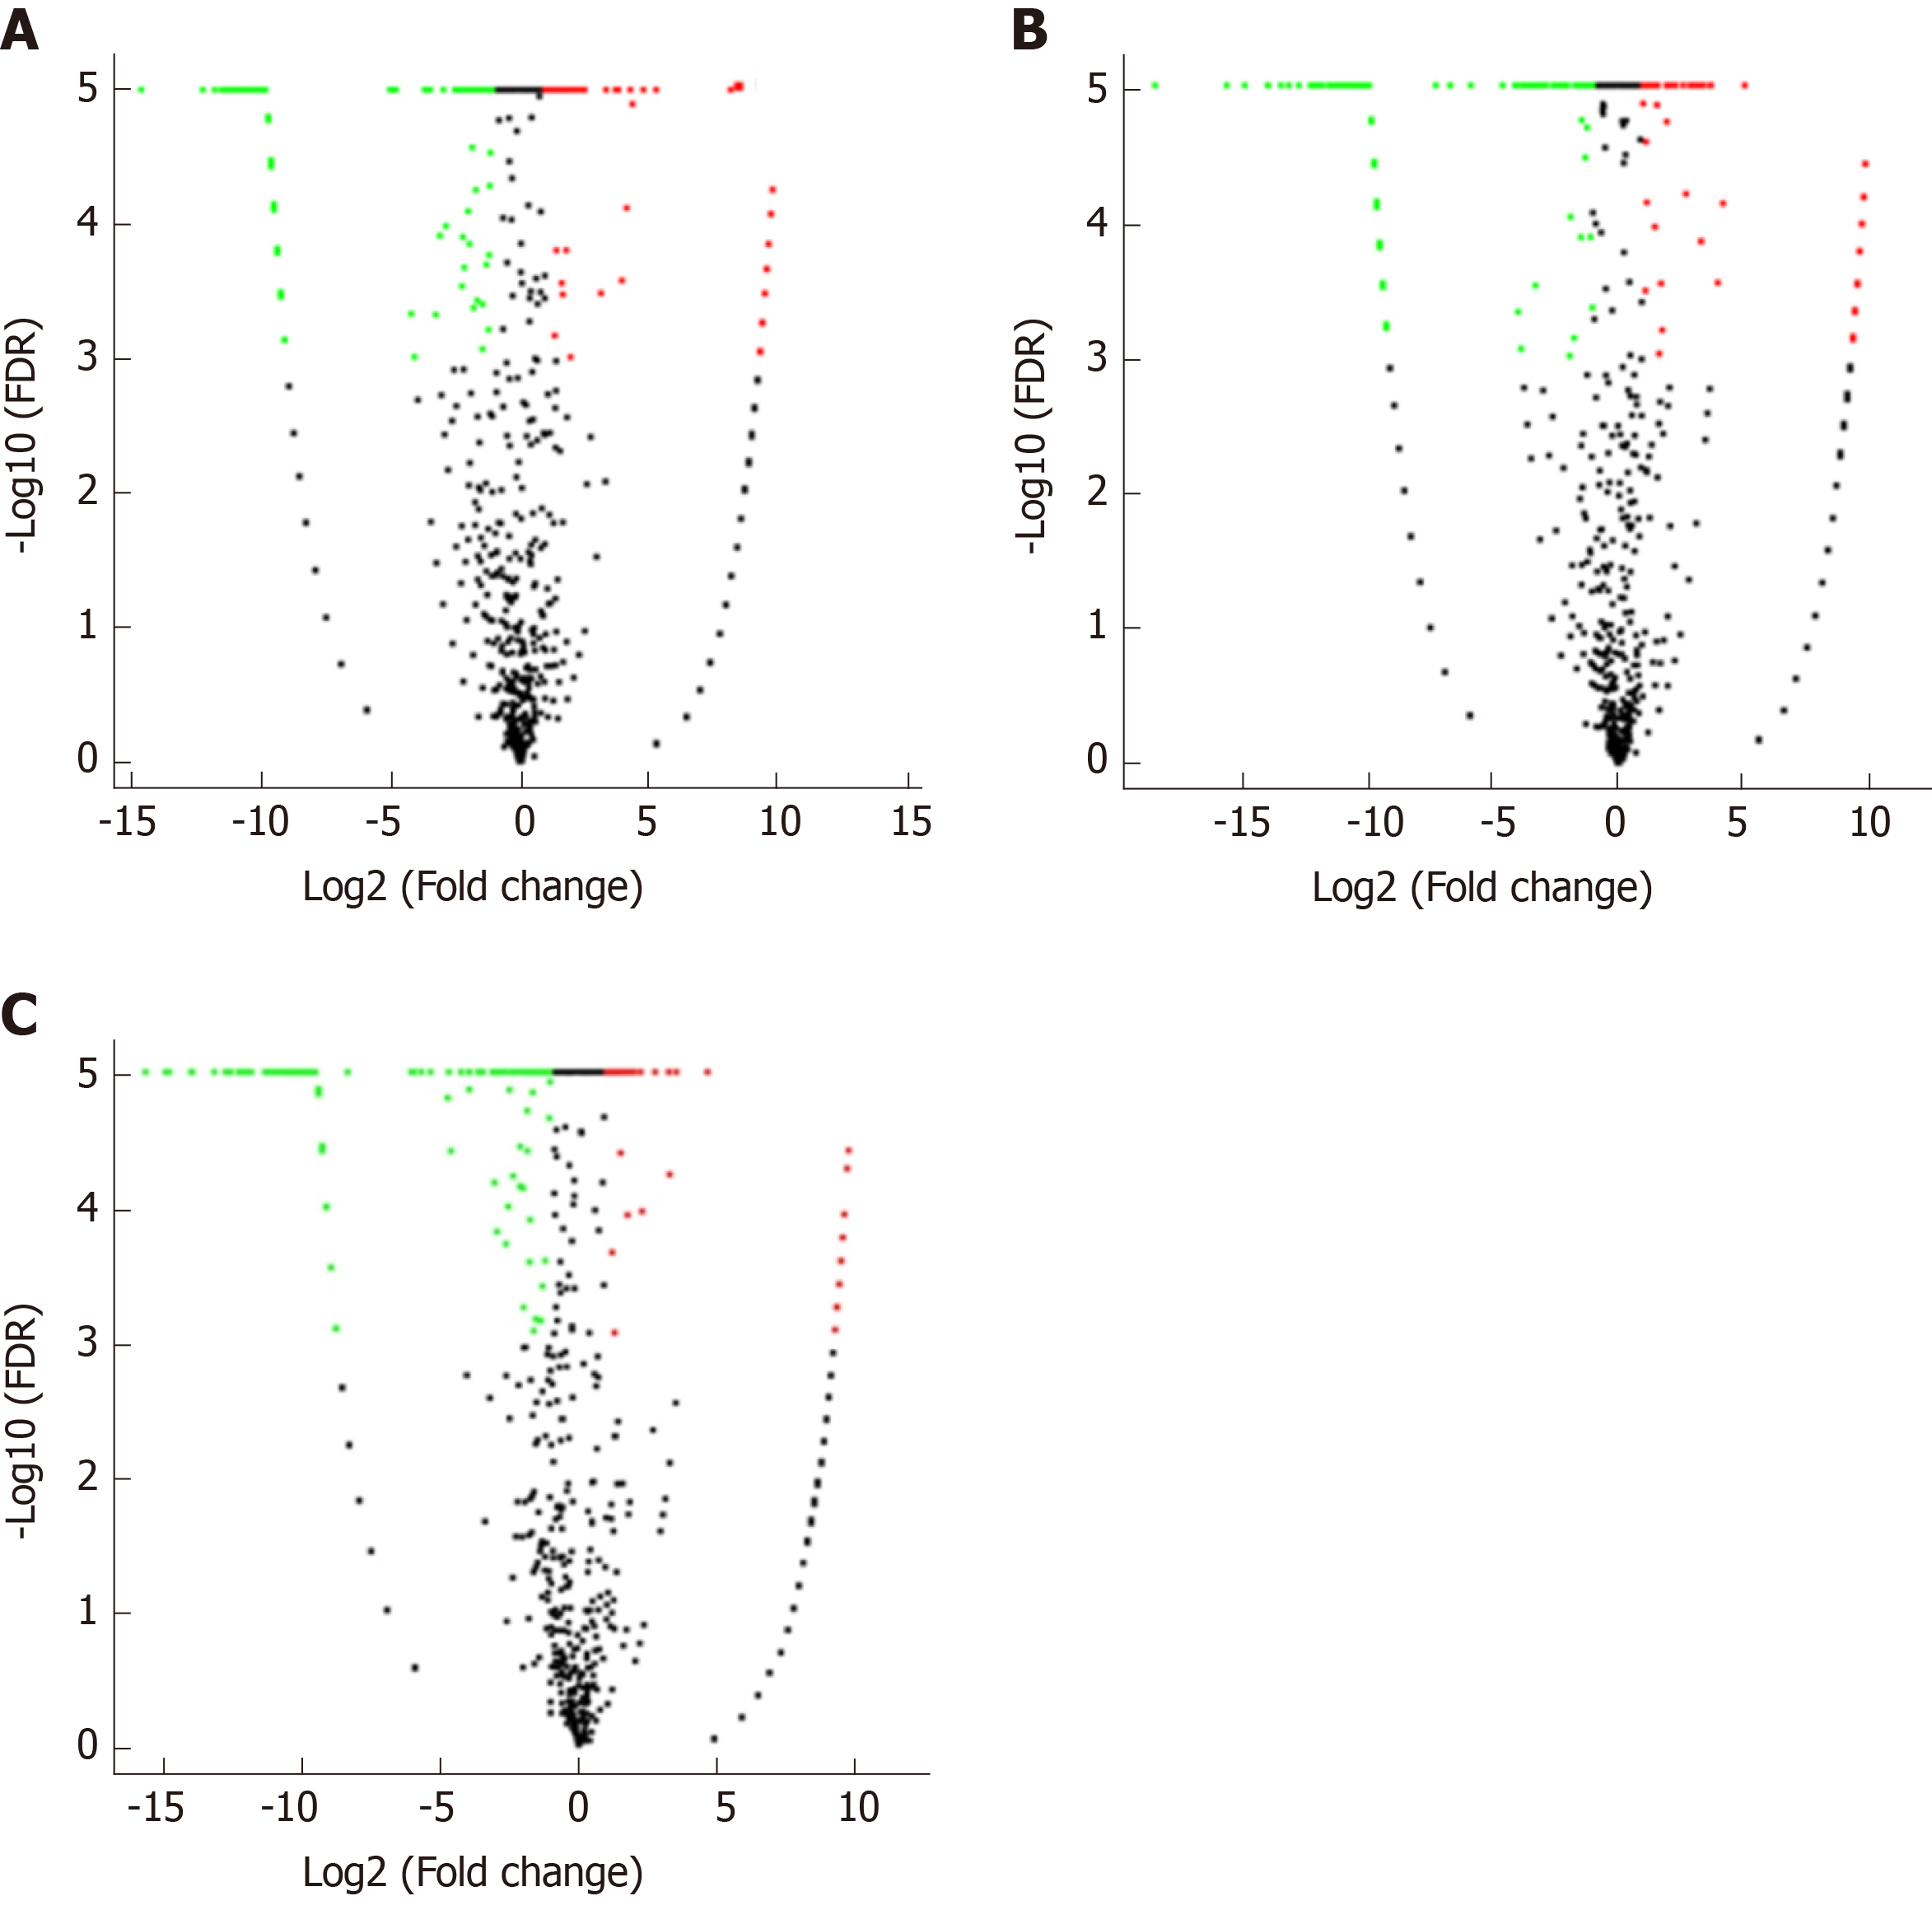
Figure 6 Volcano plots.
A-C: Volcano plots of (A) vascular cell adhesion molecule-1 group vs control group, (B) tumor necrosis factor α group vs control group, and (C) interleukin 6 group vs control group. The X axis is the log2(Fold change), and the Y axis is the -log10(FDR), with green points indicating down-regulation [log2(Fold old change) ≤ -1 and FDR ≤ 0.001] and red points indicating upregulation [log2(Fold change) ≥ 1 and FDR ≤ 0.001]. FDR: False discovery rate.
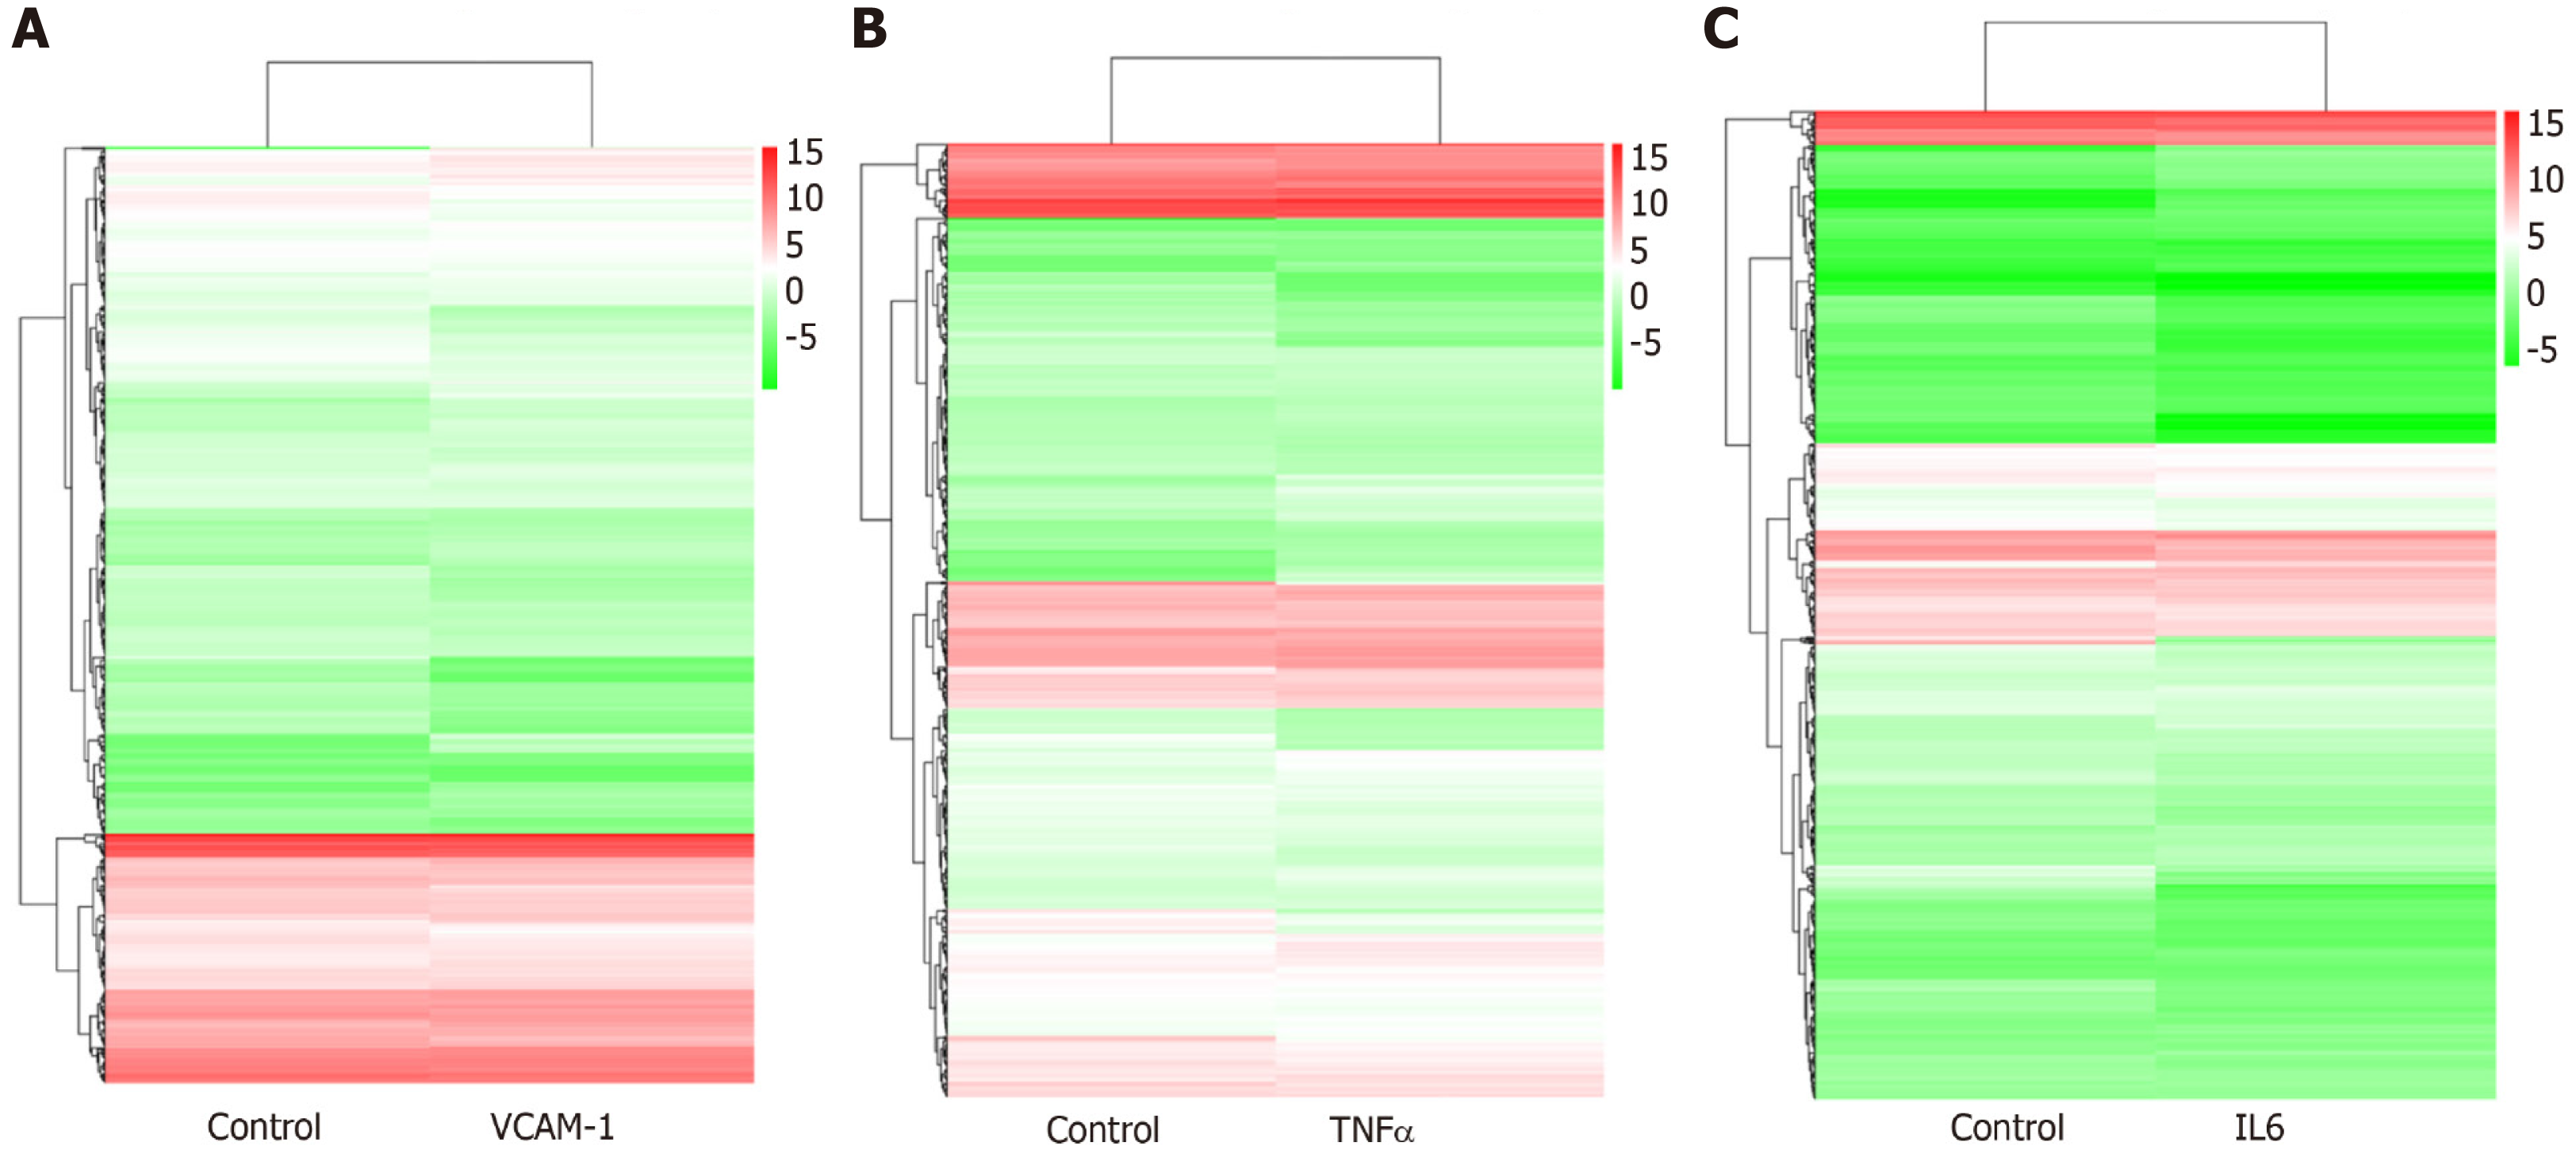
Figure 7 Hierarchical clustering of differentially expressed miRNAs.
A: Vascular cell adhesion molecule-1 group vs control group; B: Tumor necrosis factor α group vs control group; C: Interleukin 6 group vs control group. The X axis represents each pair of differences, and the Y axis represents differentially expressed miRNAs. The colors indicate the fold change, with red showing up-regulation, and blue showing down-regulation. TNF: Tumor necrosis factor; IL6: Interleukin 6.
Figure 8 Gene ontology enrichment analysis of gene targets of differentially expressed miRNAs.
A: Vascular cell adhesion molecule-1 group vs control group; B: Tumor necrosis factor α group vs control group; C: Interleukin 6 group vs control group. The X axis shows the number of differently expressed genes (their square root value), and the Y axis shows GO terms. All GO terms are grouped into three ontologies: Blue indicates biological process, brown indicates cellular components, and red indicates molecular function
Figure 9 Pathway enrichment analysis of gene targets of differentially expressed miRNAs.
A: Comparison of the top 20 enriched pathway terms between vascular cell adhesion molecule-1 (VCAM-1) group and control group; B: Comparison of the Kyoto Encyclopedia of Genes and Genomes (KEGG) classification between VCAM-1 group and control group; C: Comparison of the top 20 enriched pathway terms between tumor necrosis factor (TNF) α group and control group; D: Comparison of the KEGG classification between TNFα group and control group; E: Comparison of the top 20 enriched pathway terms between interleukin 6 (IL6) group and control group; F: Comparison of the KEGG classification between IL6 group and control group. A, C, and E: The top 20 enriched pathway terms displayed as scatterplots. The rich factor is the ratio of target gene numbers annotated in this pathway term to all gene numbers annotated in this pathway term. The greater the rich factor, the greater the degree of enrichment. The Q-value is the corrected P-value and ranges from 0-1; the lower the Q-value, the greater the level of enrichment; B, D, and F: The X axis shows the number of target genes, and the Y axis shows the second KEGG pathway terms. The first pathway terms are indicated using different colors. The second pathway terms are subgroups of the first pathway terms and are grouped together on the X axis on the right side.
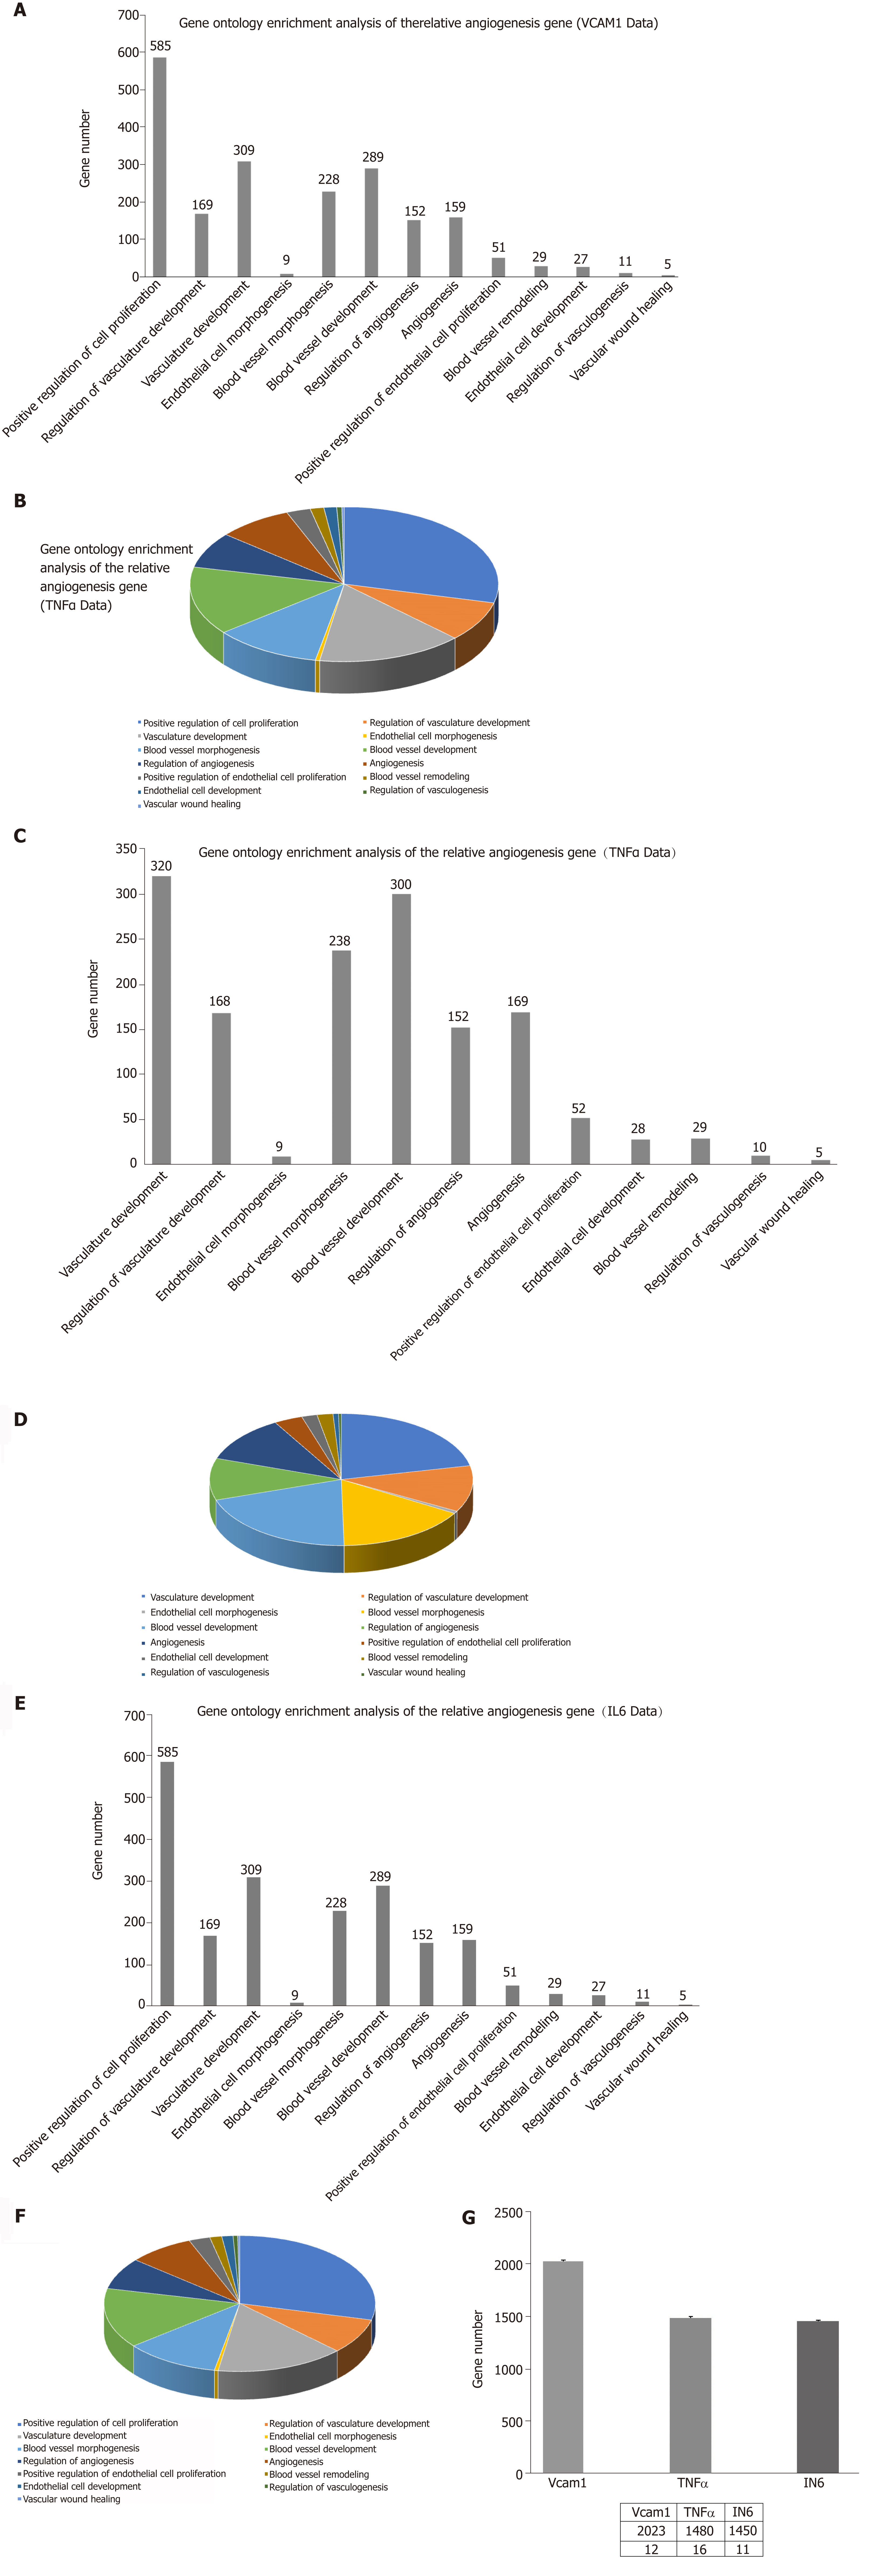
Figure 10 Gene ontology enrichment analysis of angiogenesis-related genes.
A: The number of angiogenesis-related genes in the vascular cell adhesion molecule-1 (VCAM-1) group; B: The proportion of angiogenesis-related genes in the VCAM-1 group; C: The number of angiogenesis-related genes in the tumor necrosis factor (TNF) α group; D: The proportion of angiogenesis-related genes in the TNFα group; E: The number of angiogenesis gene distributions in the interleukin 6 (IL6) group; F: The proportion of angiogenesis-related genes in the IL6 group; G: Comparison of the number of angiogenesis-related genes in the three groups to that of the control group.
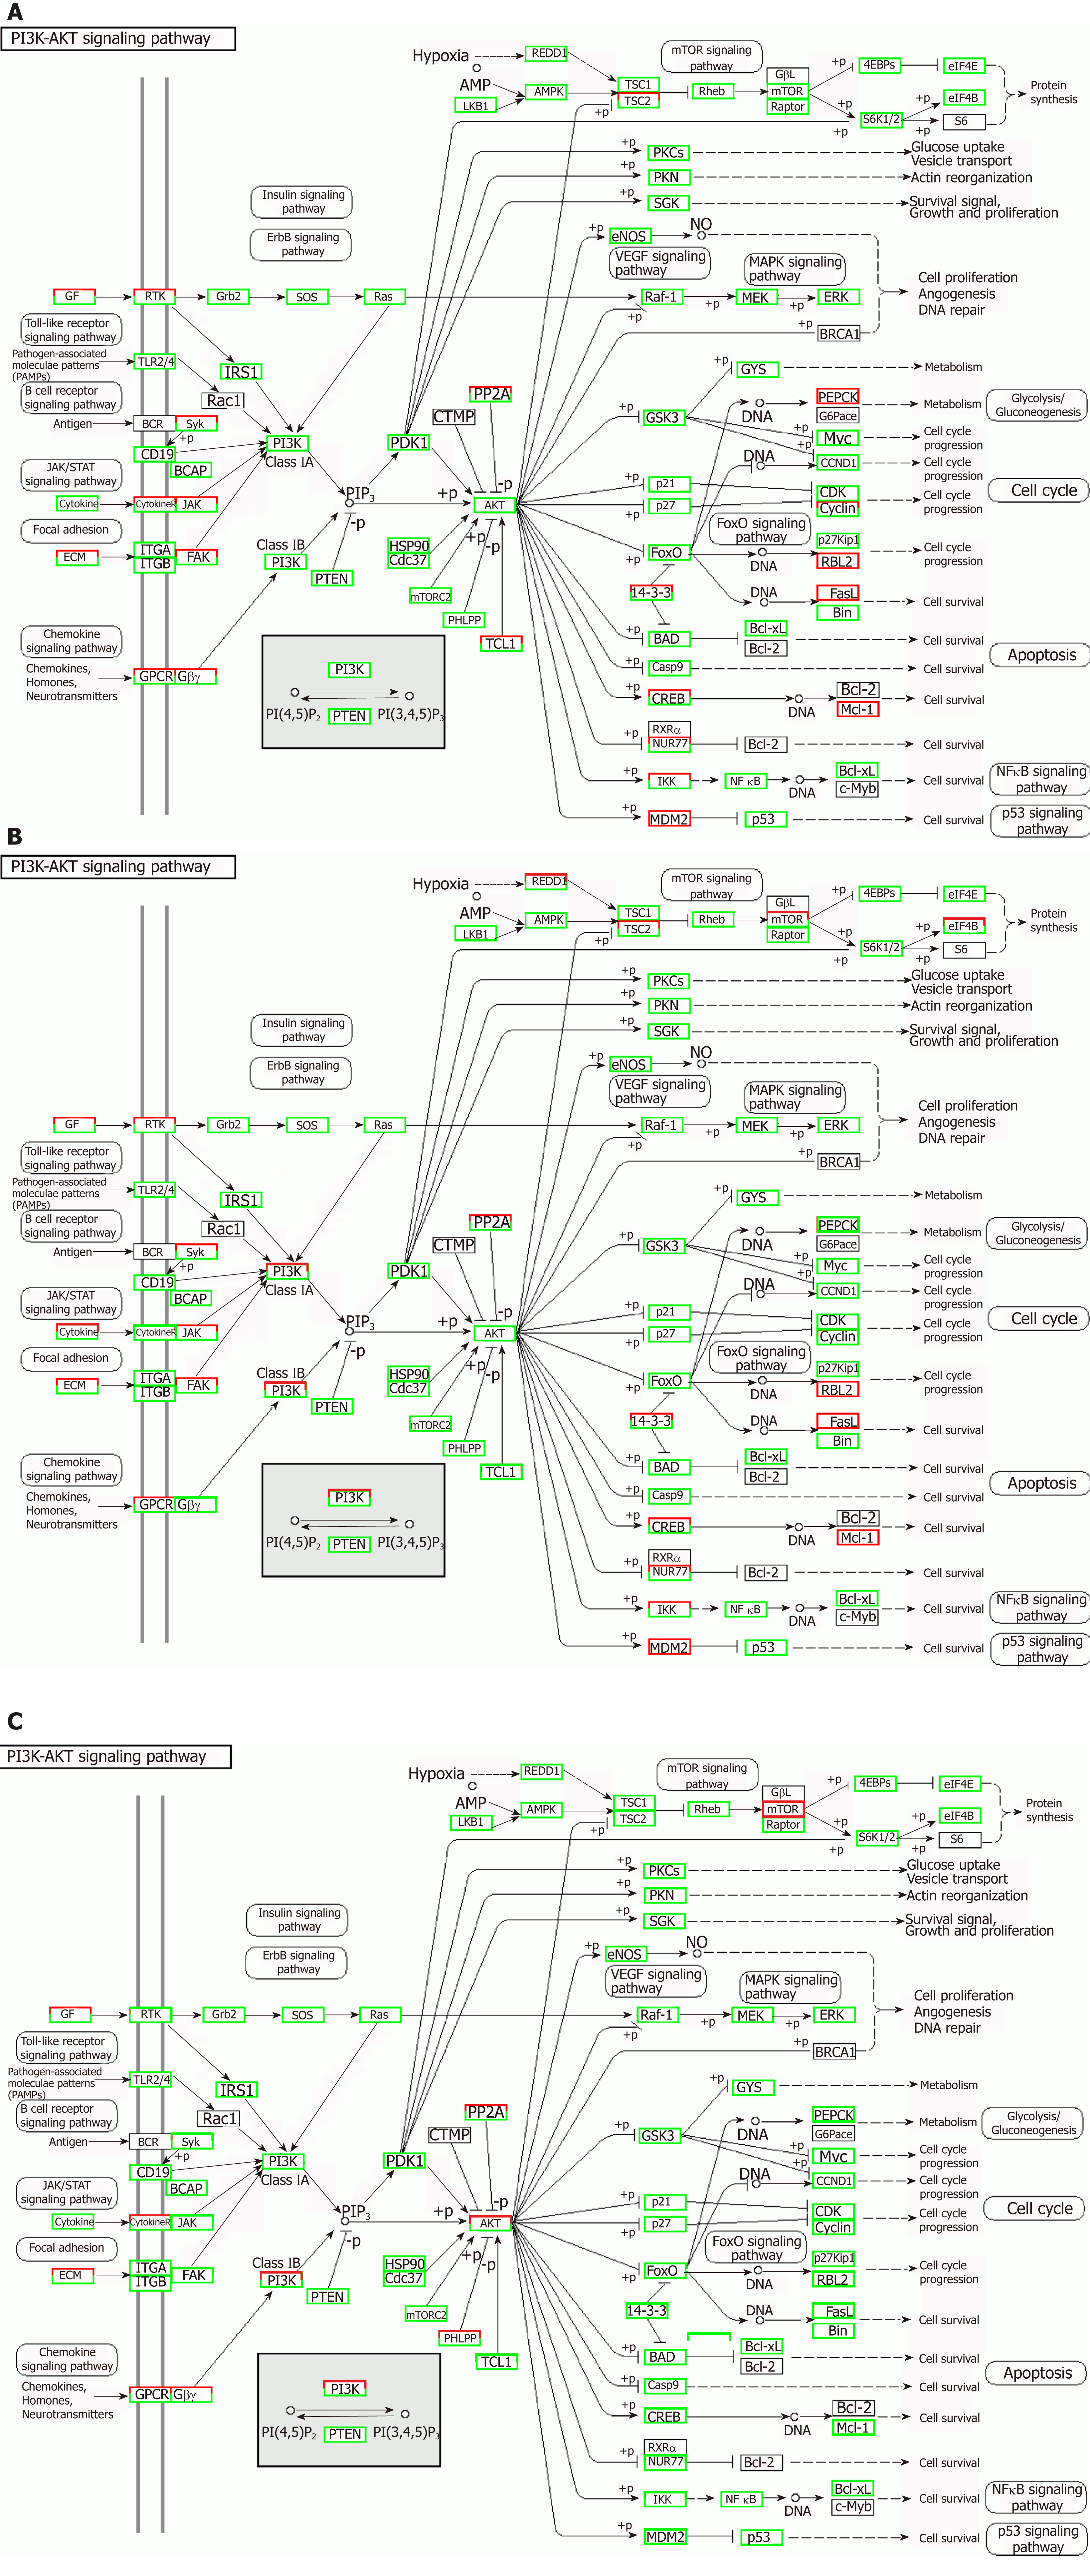
Figure 11 Regulatory mechanism of the PI3K-AKT signal pathway in different groups.
A: Vascular cell adhesion molecule-1 group; B: Tumor necrosis factor α group; C: Interleukin 6 group. Up-regulated genes are marked with red borders and down-regulated genes with green borders. Unchanged genes are marked with black borders.
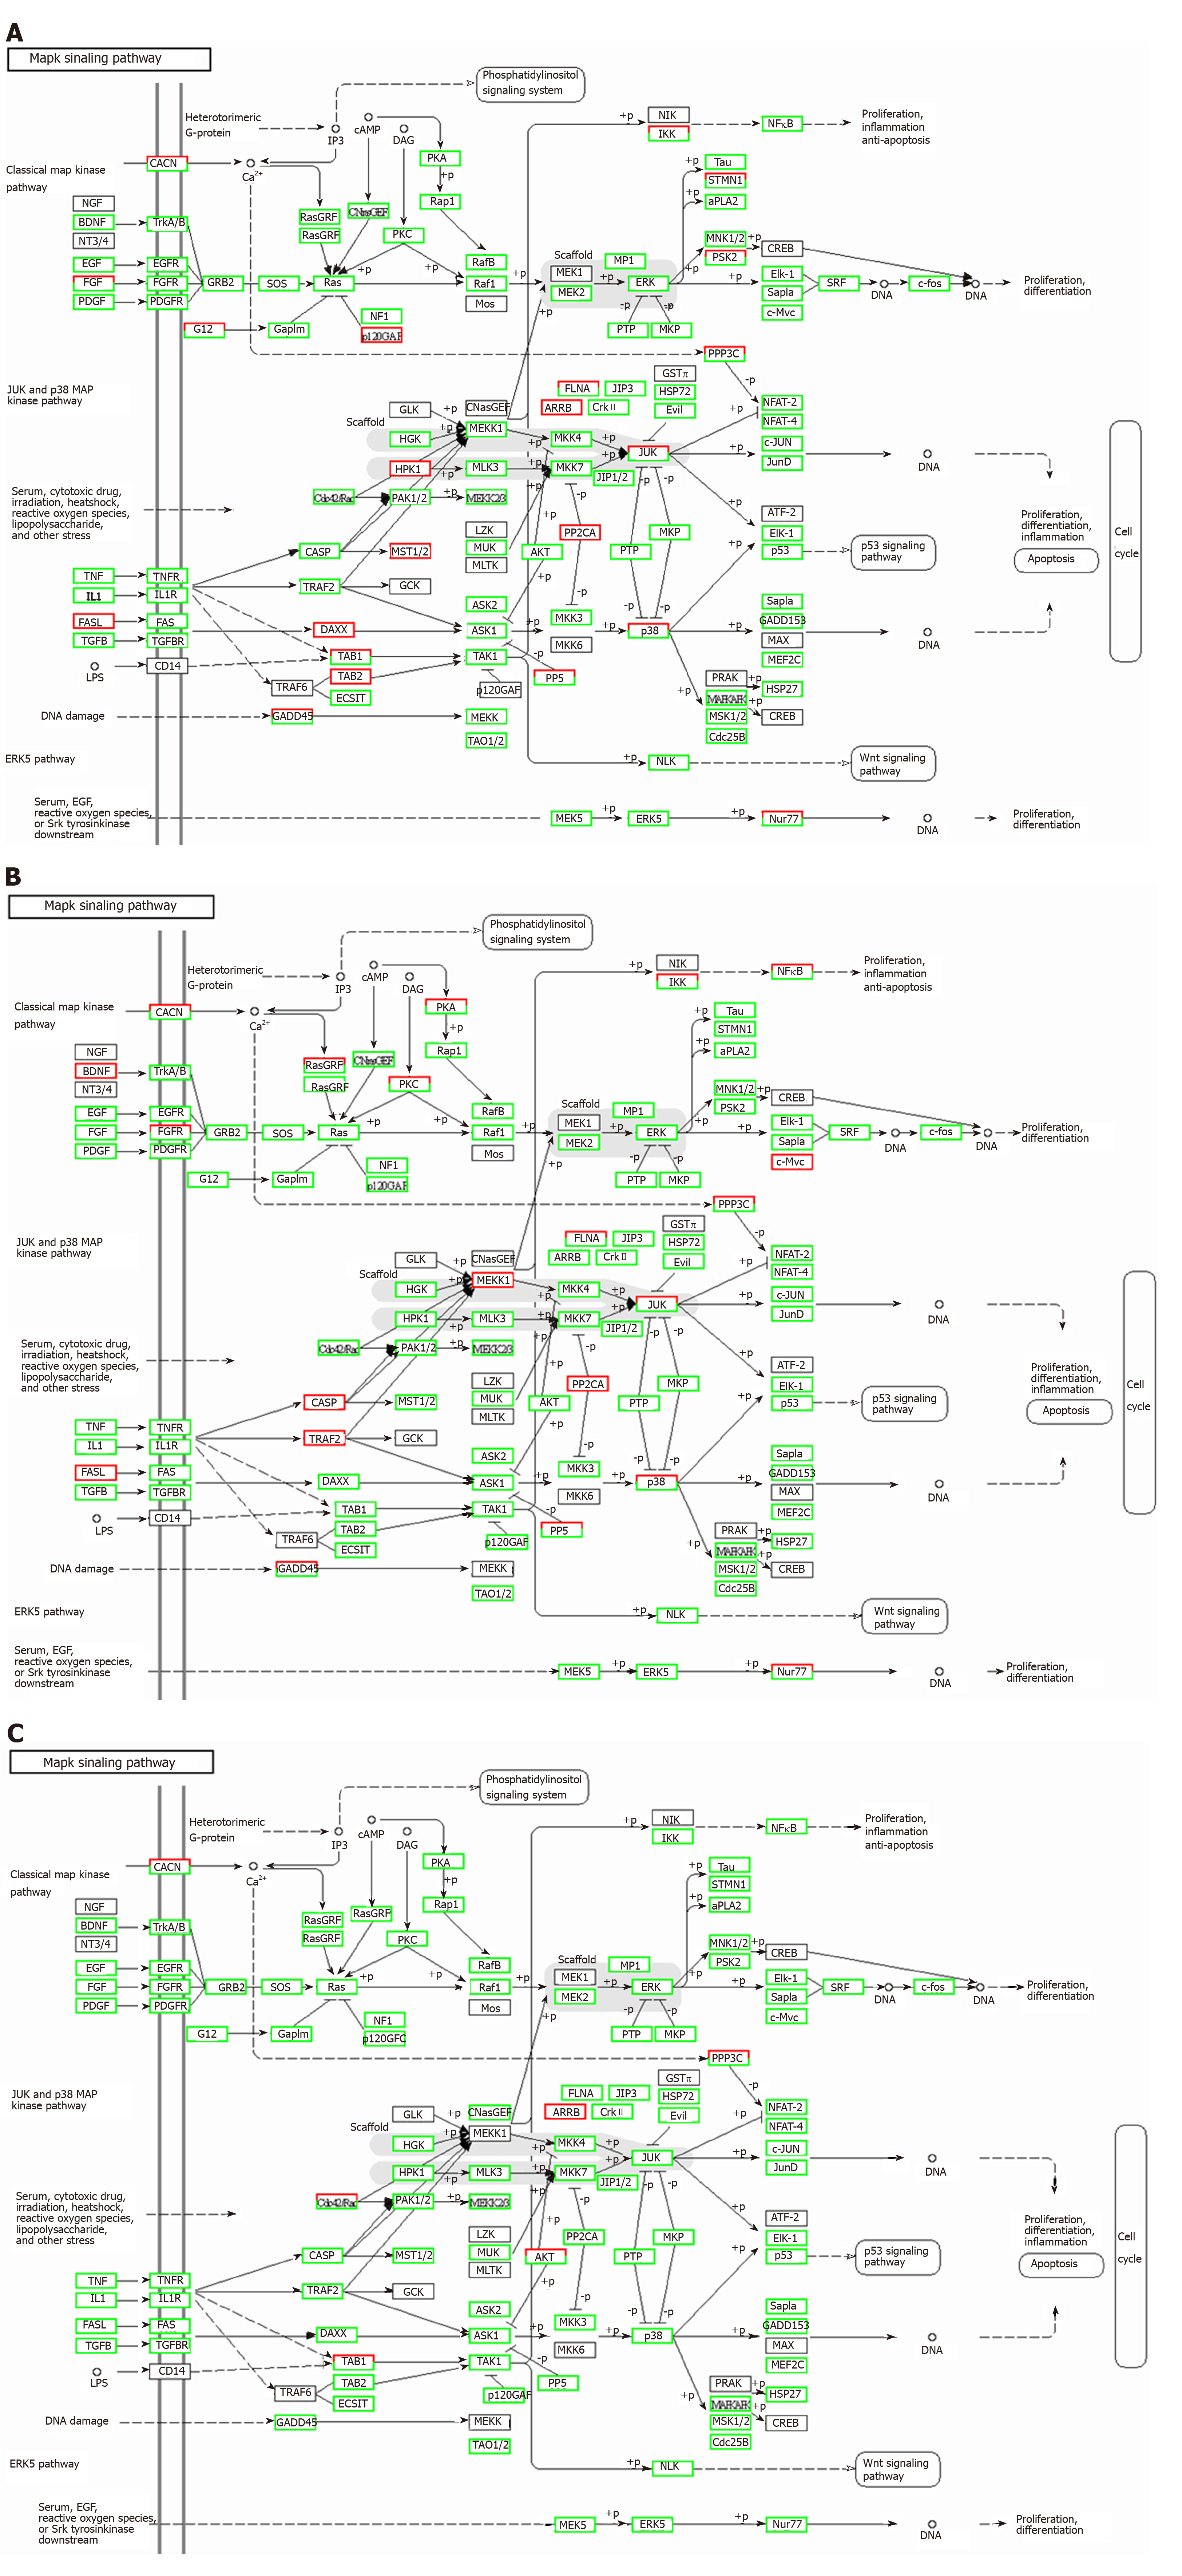
Figure 12 Regulatory mechanism of the MAPK signal pathway in different groups.
A: Vascular cell adhesion molecule-1 group; B: Tumor necrosis factor α group; C: Interleukin 6 group. Up-regulated genes are marked with red borders and down-regulated genes with green borders. Unchanged genes are marked with black borders.
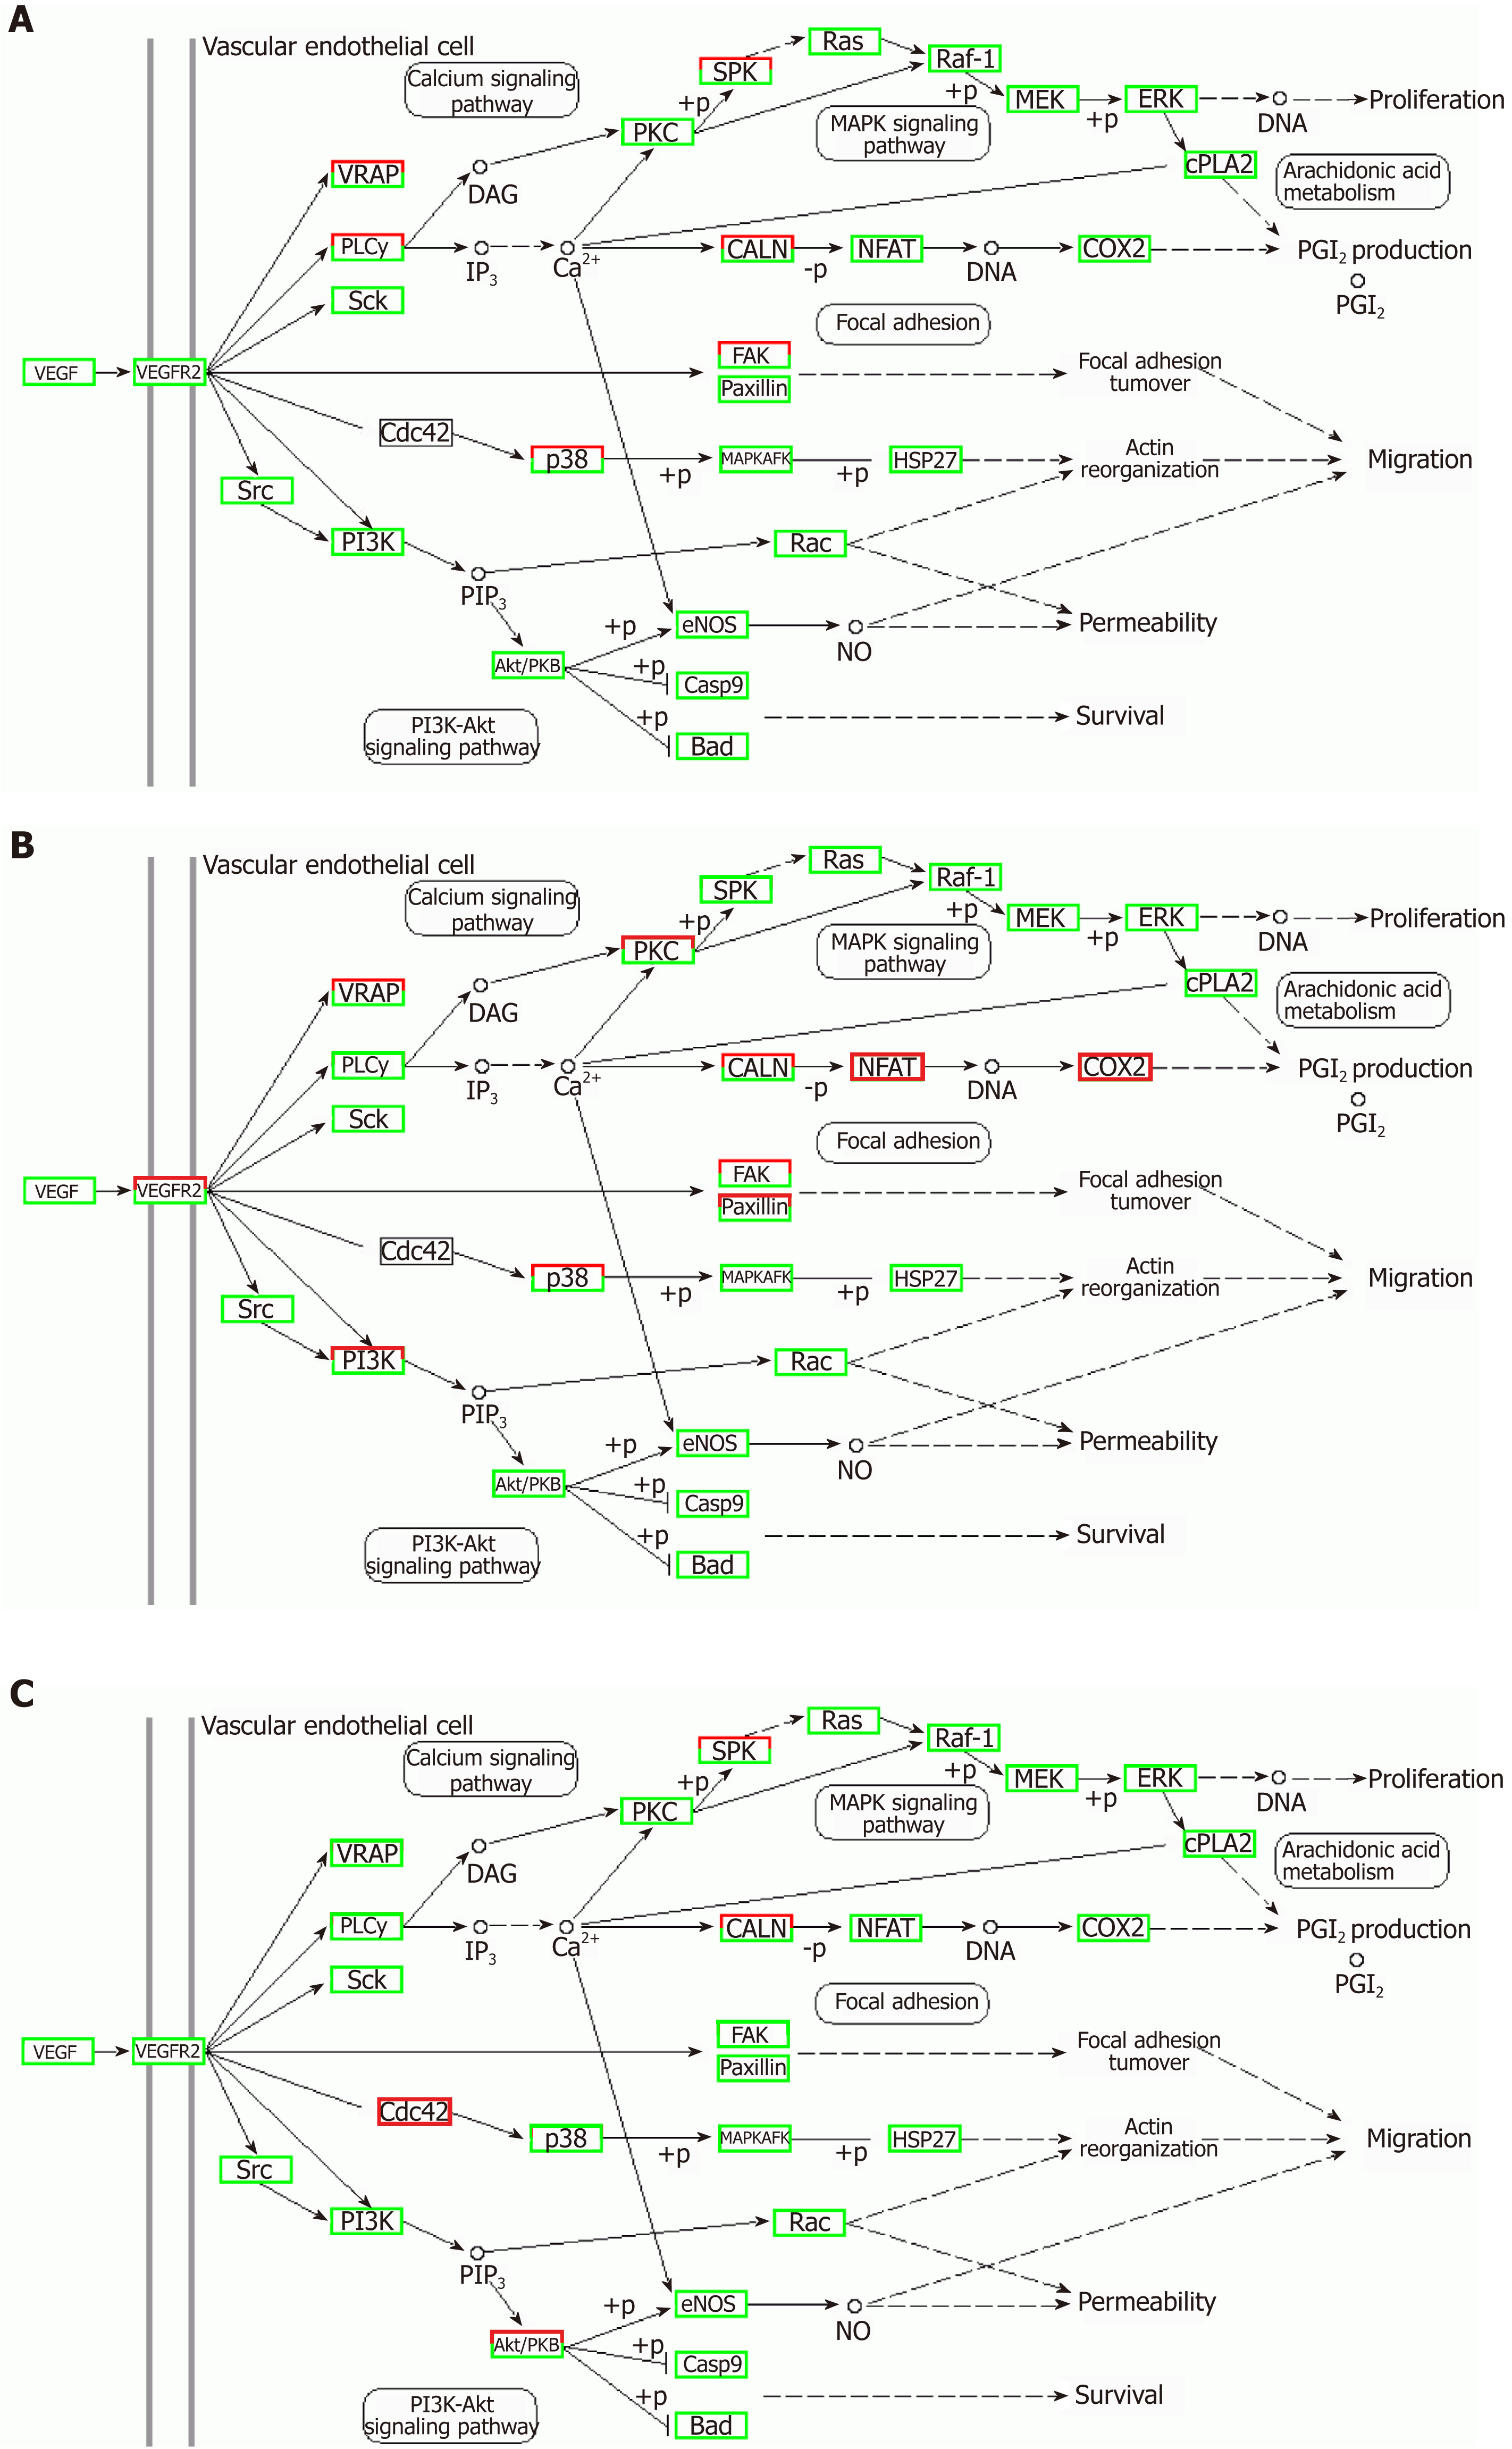
Figure 13 Regulatory mechanism of the VEGF signal pathway in different groups.
A: Vascular cell adhesion molecule-1 group; B: Tumor necrosis factor α group; C: Interleukin 6 group. Up-regulated genes are marked with red borders and down-regulated genes with green borders. Unchanged genes are marked with black borders.
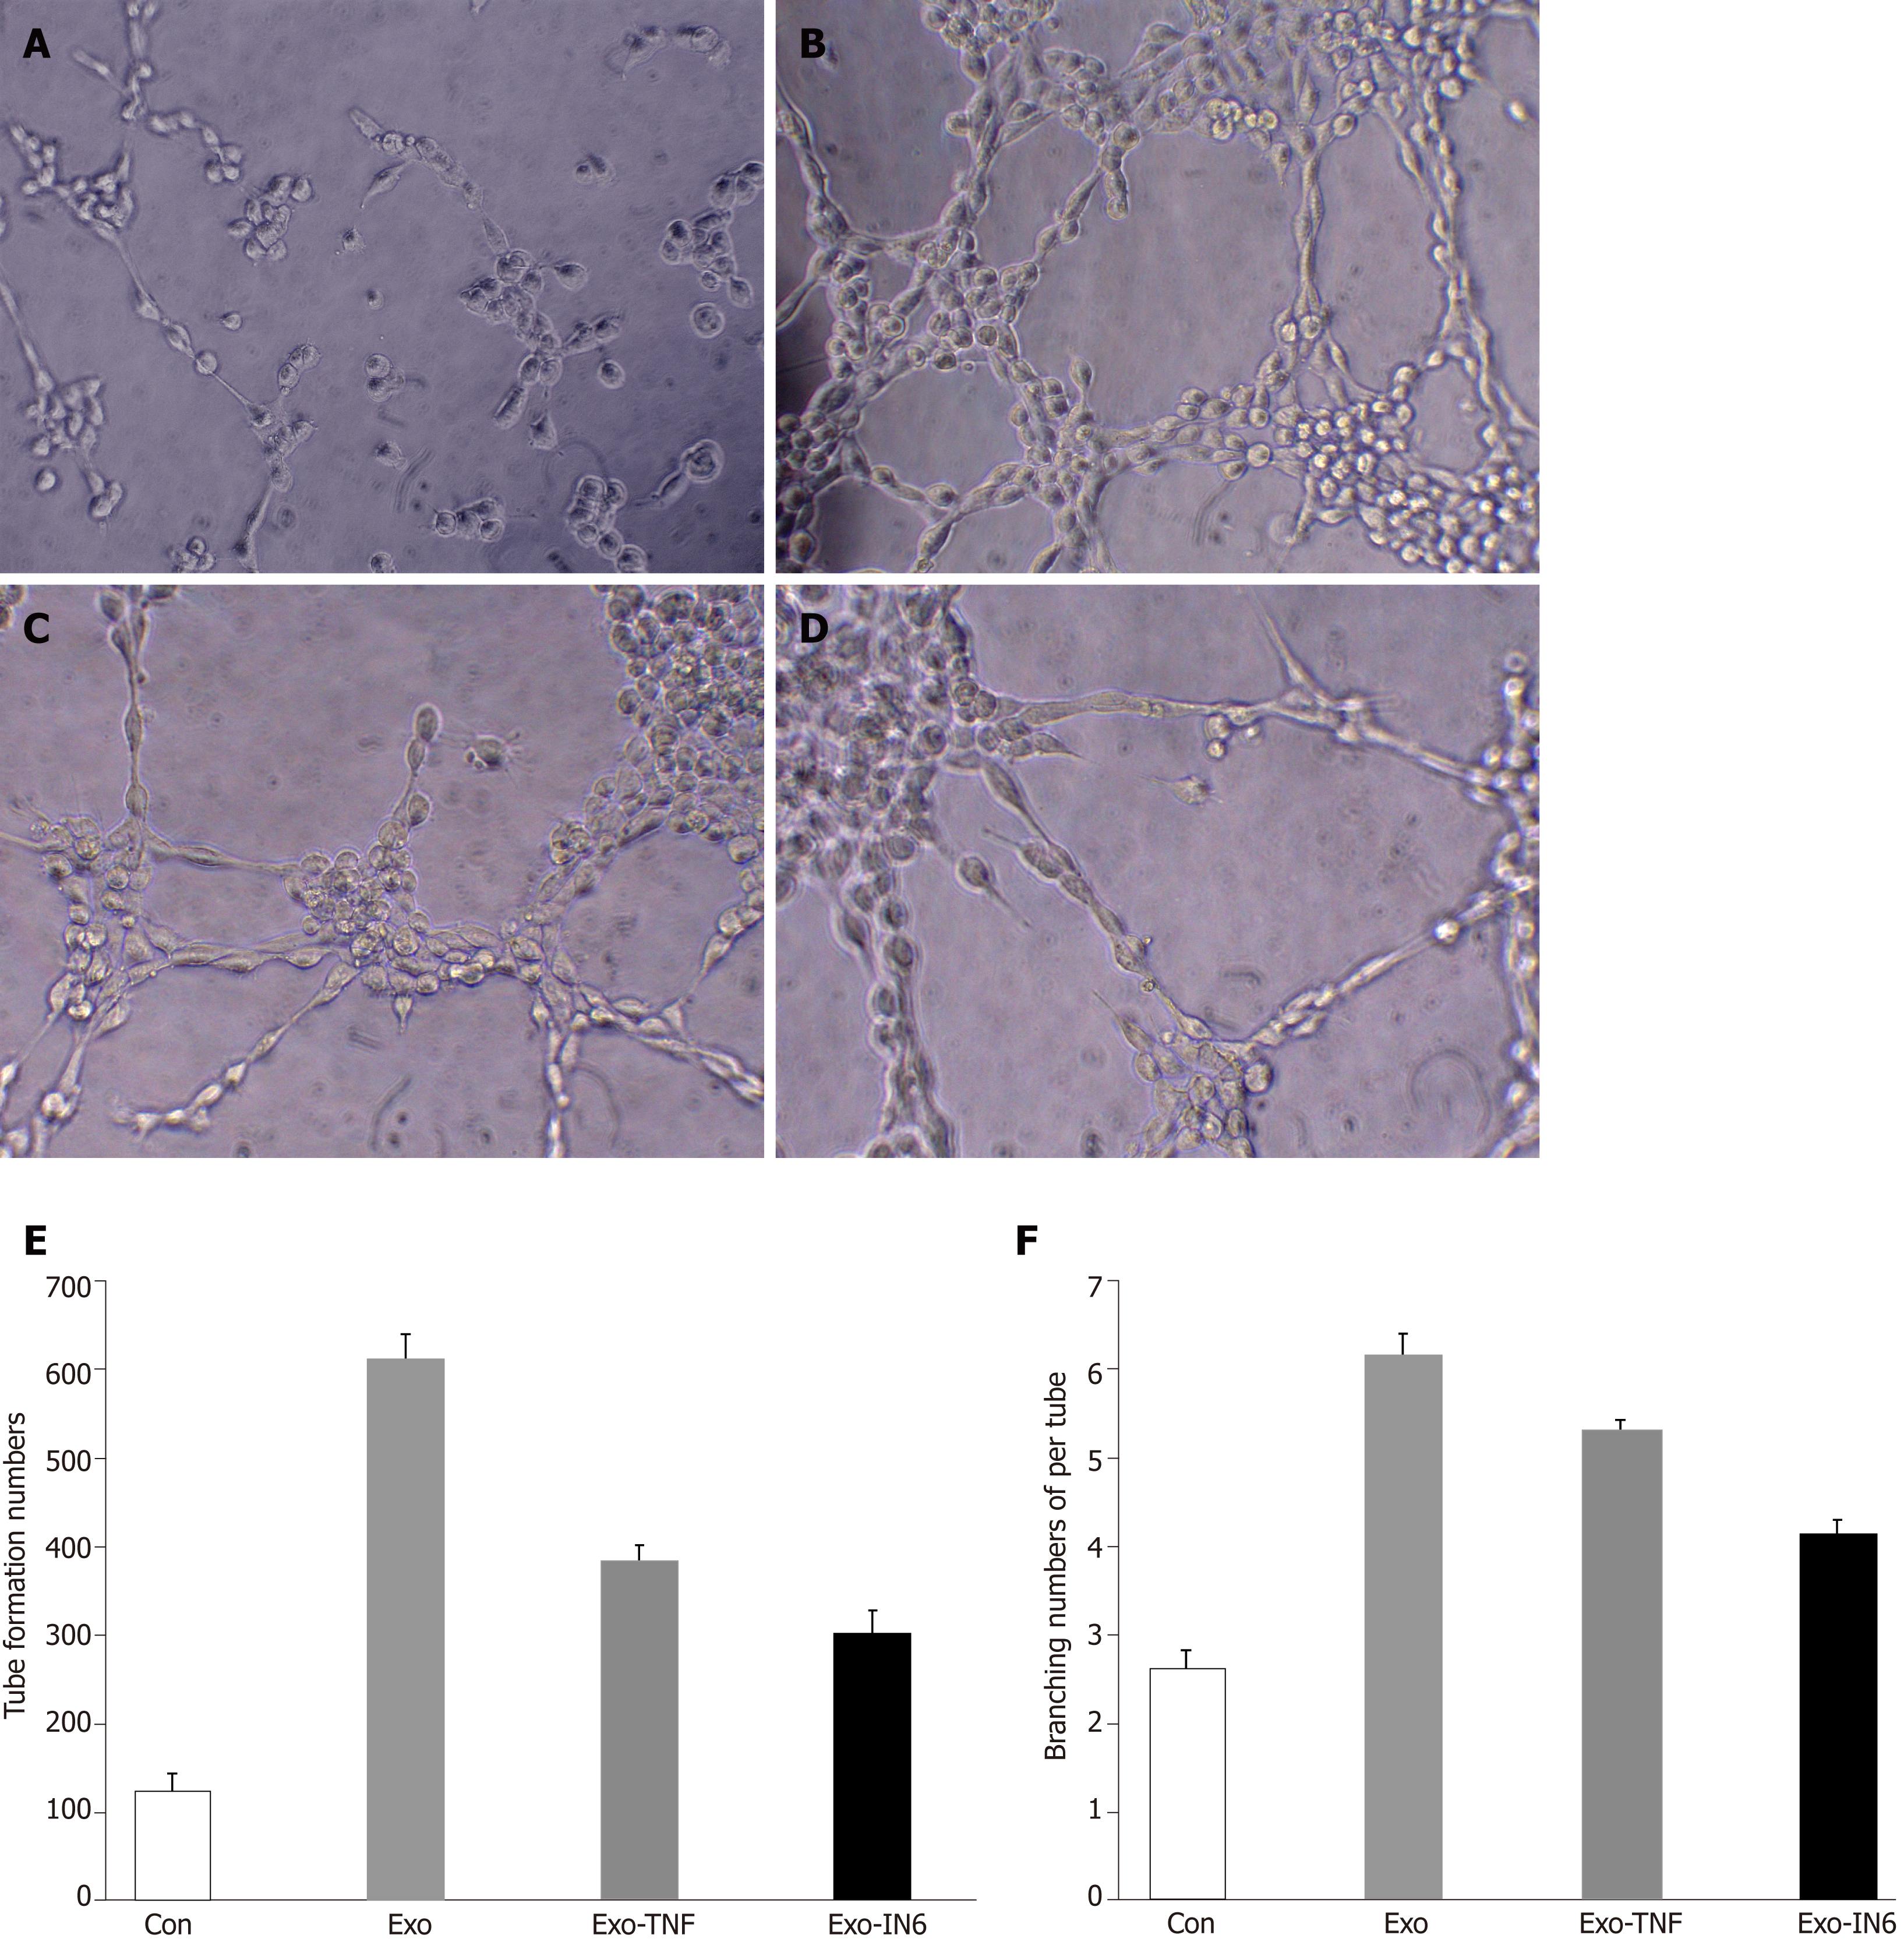
Figure 14 Tube formation in endothelial cells treated with mesenchymal stem cell exosomes.
A: Micrograph showing human umbilical vein endothelial cells (HUVECs) cultured on Matrigel-coated plates in medium with phosphate buffered saline (control); B: Micrograph showing HUVECs cultured on Matrigel-coated plates in medium with mesenchymal stem cell exosomes (MSC-exo); C: Micrograph showing HUVECs cultured on Matrigel-coated plates in medium with MSCs-exo stimulated with tumor necrosis factor α; D: Micrograph showing HUVECs cultured on Matrigel-coated plates in medium with MSCs-exo stimulated with interleukin 6; E: The number of tubes formed in each group; F: The number of branching points in each group.
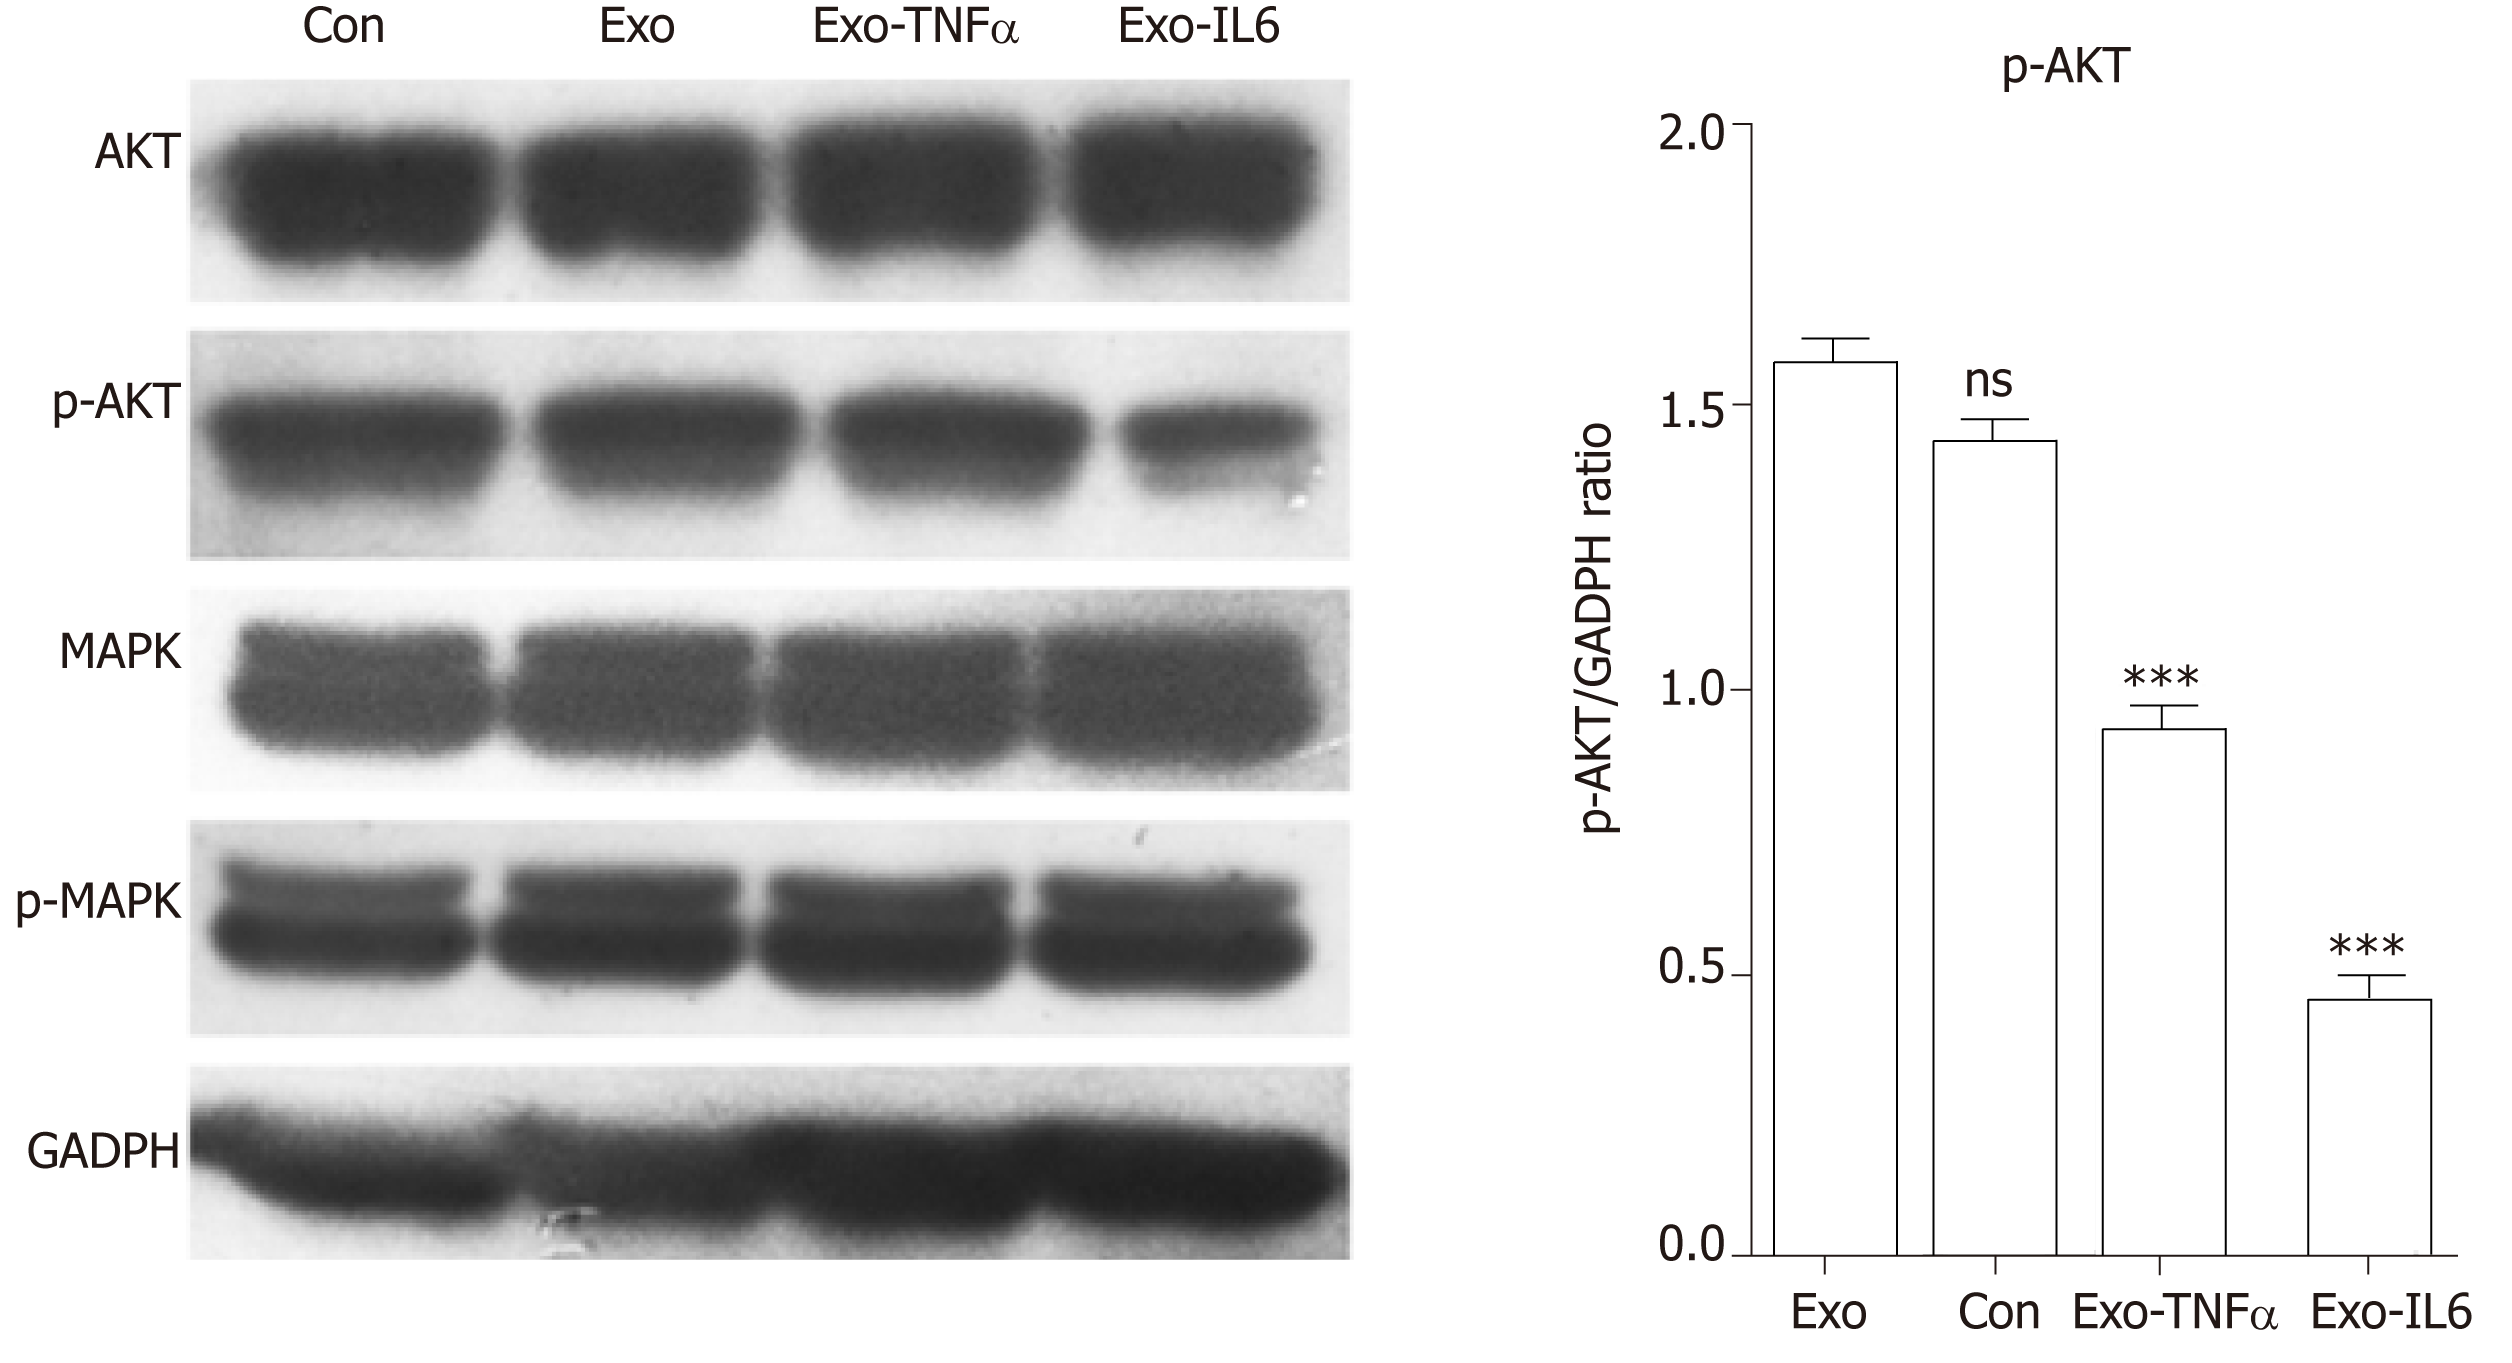
Figure 15 Western blot analysis.
Western blot was performed to detect the expression of the indicated proteins in endothelial cells treated with phosphate buffered saline (control), mesenchymal stem cell exosomes (MSCs-exo), MSCs-exoTNFα (stimulated with tumor necrosis factor α), MSCs-exoIL6 (stimulated with interleukin 6). GAPDH was used as an internal loading control. TNF: Tumor necrosis factor; IL6: Interleukin 6.
- Citation: Huang C, Luo WF, Ye YF, Lin L, Wang Z, Luo MH, Song QD, He XP, Chen HW, Kong Y, Tang YK. Characterization of inflammatory factor-induced changes in mesenchymal stem cell exosomes and sequencing analysis of exosomal microRNAs. World J Stem Cells 2019; 11(10): 859-890
- URL: https://www.wjgnet.com/1948-0210/full/v11/i10/859.htm
- DOI: https://dx.doi.org/10.4252/wjsc.v11.i10.859


