Copyright
©The Author(s) 2003.
World J Gastroenterol. Dec 15, 2003; 9(12): 2650-2653
Published online Dec 15, 2003. doi: 10.3748/wjg.v9.i12.2650
Published online Dec 15, 2003. doi: 10.3748/wjg.v9.i12.2650
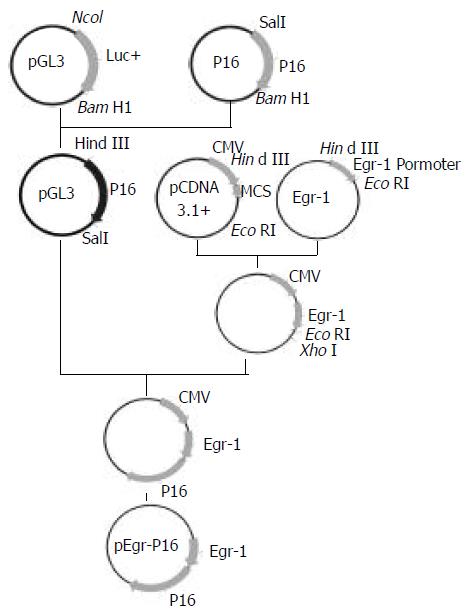
Figure 1 Diagram of the construction of the plasmid pEgr-P16.
Figure 2 Expression of P16 in EC9706 cells after γ-irradiation.
Lane 1: control; Lane 2: 0Gy; Lane 3: 2Gy; Lane 4: 4Gy; Lane 5: 8Gy; Lane 6: 10Gy; Lane 7: 20Gy.
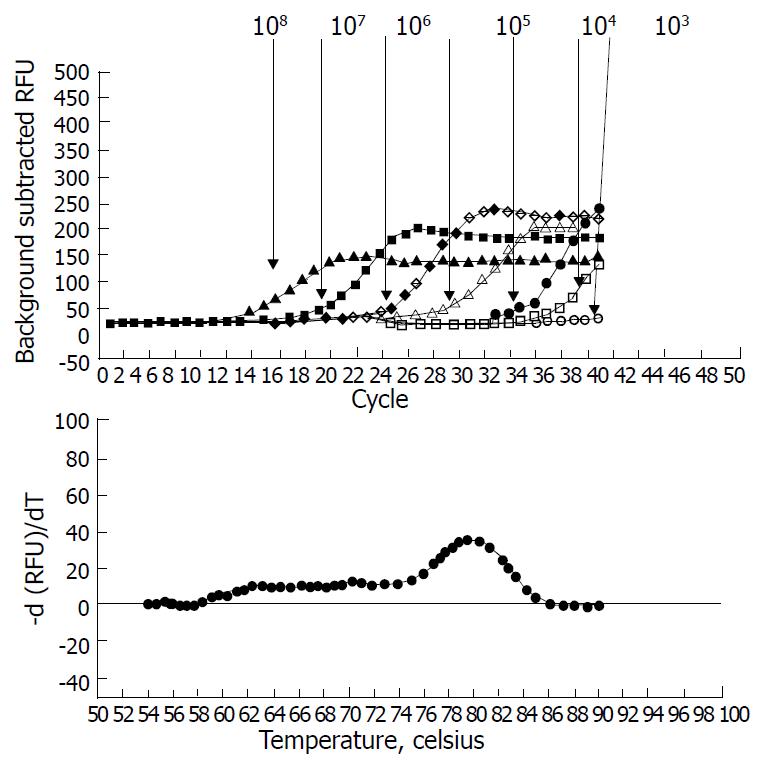
Figure 3 Amplification curves and post-amplification disso-ciation curves for P16 in EC9706 cells.
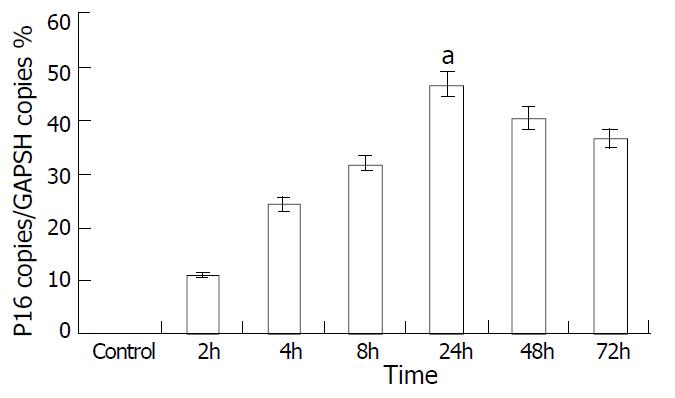
Figure 4 Expression of P16 in EC9706 cells at different time points after 2Gy γ-irradiation, aP < 0.
01 vs. 2 h group.
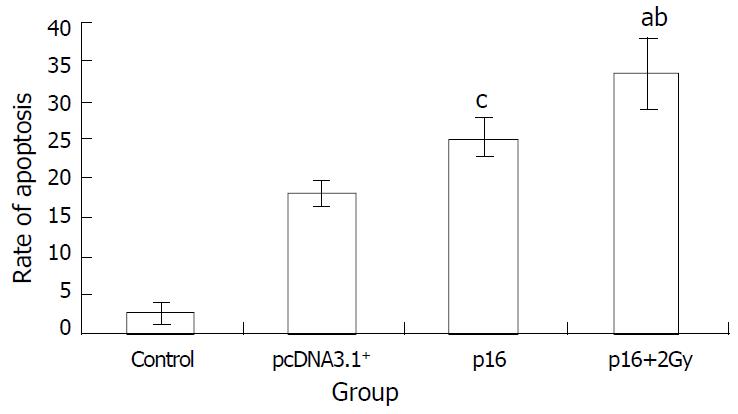
Figure 5 Apoptotic changes of transfected EC9706 cells.
aP < 0.01 vs pcDNA3.1+group, bP < 0.001 vs control group, cP < 0.05 vs pcDNA3.1+ group.
- Citation: Wu CM, Huang TH, Xie QD, Wu DS, Xu XH. Expression properties of recombinant pEgr-P16 plasmid in esophageal squamous cell carcinoma induced by ionizing irradiation. World J Gastroenterol 2003; 9(12): 2650-2653
- URL: https://www.wjgnet.com/1007-9327/full/v9/i12/2650.htm
- DOI: https://dx.doi.org/10.3748/wjg.v9.i12.2650


