Copyright
©The Author(s) 1998.
World J Gastroenterol. Dec 15, 1998; 4(6): 506-510
Published online Dec 15, 1998. doi: 10.3748/wjg.v4.i6.506
Published online Dec 15, 1998. doi: 10.3748/wjg.v4.i6.506
Figure 1 Light microscope of hHCC4 and hHCC15 showing high nuclear-cytoplasmic radio.
A: HHC4, B: HHC15
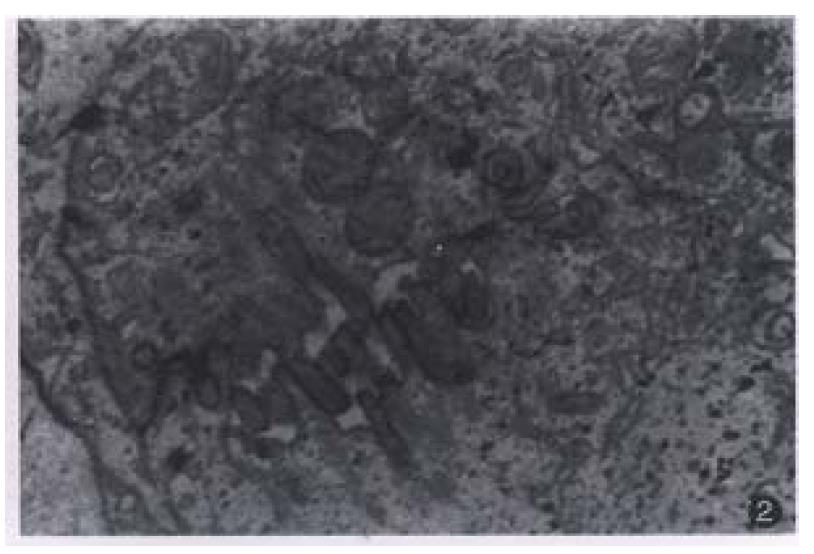
Figure 2 The bile canaliculi between two carcinoma cells.
× 15000
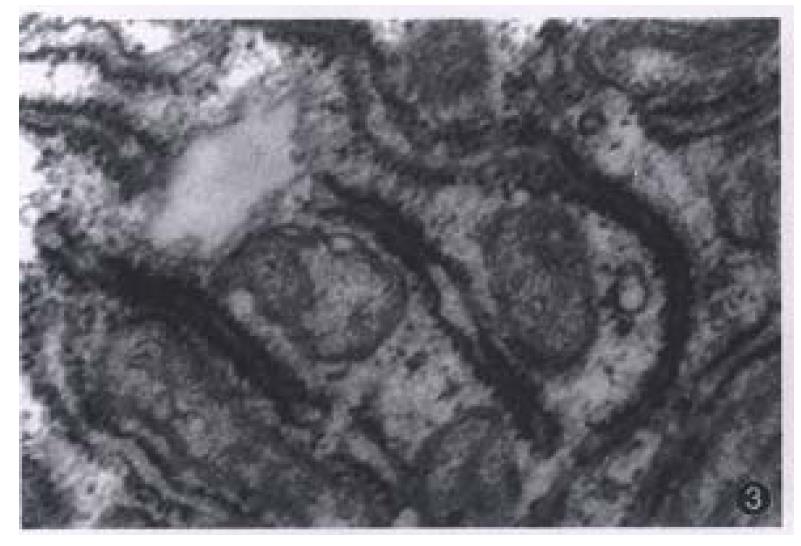
Figure 3 The filament of HBsAg in the rough Endoplasmic reticulum of hepatoma cell of hHCC4.
× 40000
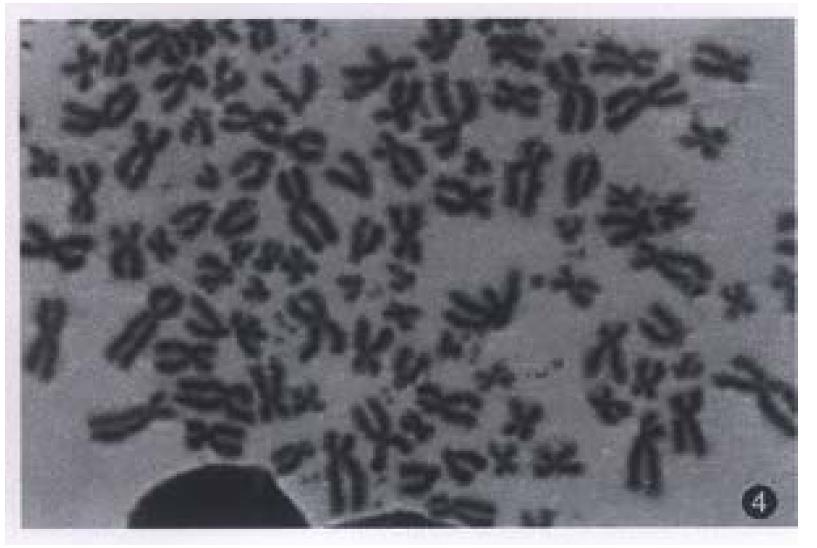
Figure 4 Karyotype of hHCC15.
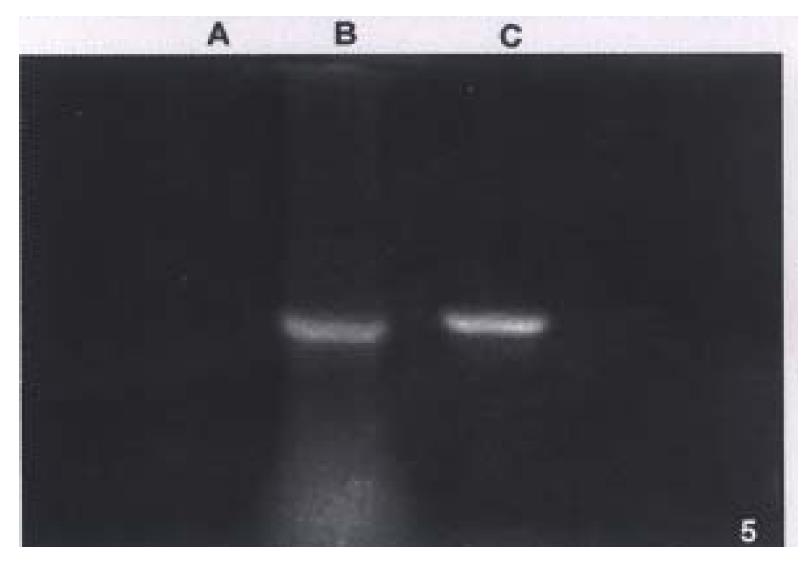
Figure 5 Electrophoresis of HBV PCR product from hHCC15.
A. negative control, B. HHC15, C. positive control
Figure 6 Dot blot hybridization of p53 PCR product.
A. hHCC4, B. hHCC15, C. ph p53β plasmid for positive control, D. pBR322 for negative control
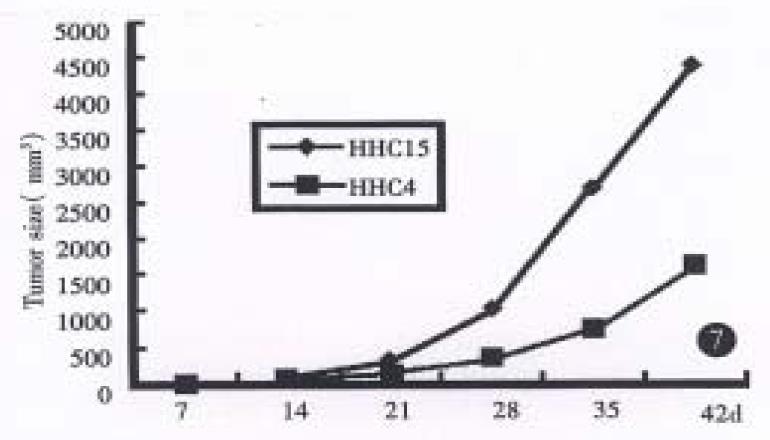
Figure 7 Growth curves of hHCC4 and hHCC15 in nude mice.
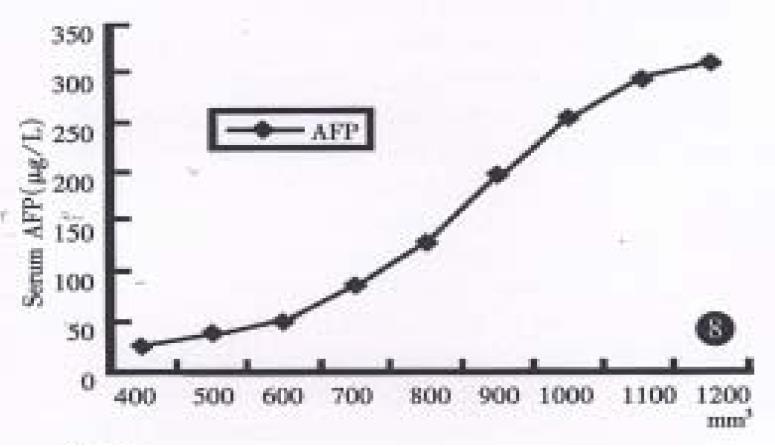
Figure 8 The relationship between the volume of orthotopical xenograf and the AFP values in the sera of a nude mouse bearing hHCC15.
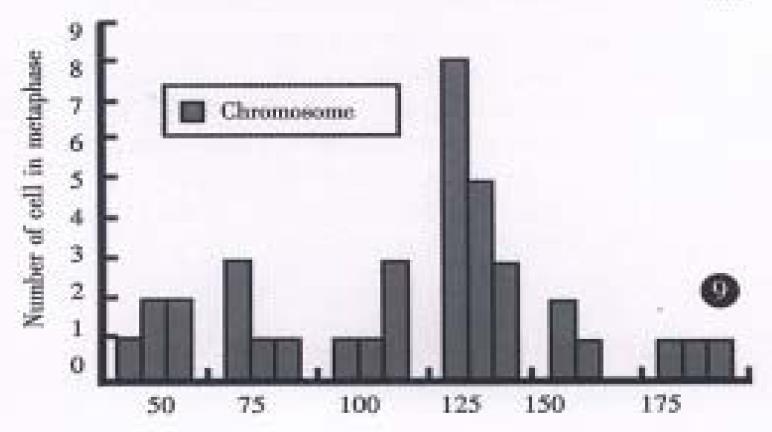
Figure 9 The histograms of chromosome numbers in hHCC15 cell passage 21.
Figure 10 Restriction fragment length polymorphism analysis of PCR products.
A. ph p53β plasmid for positive control, B. DNA marker (pBR322/Hae III), C. hHCC4, D. hHCC15
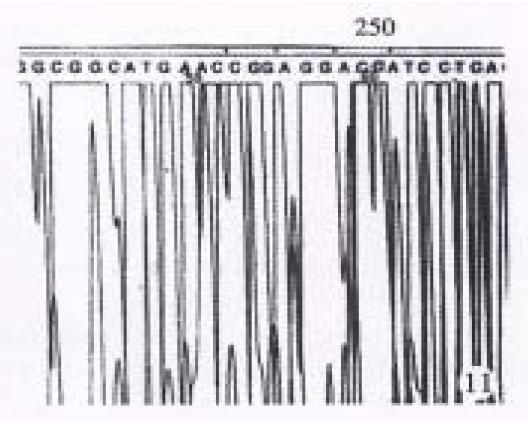
Figure 11 Dna sequencing results of partial PCR fragment showing C→A mutation at 250 code of p53 gene from hHCC4.
Figure 12 DNA sequencing results of partial PCR fragment showing G→T mutation at 249 code of p53 gene from hHCC15.
- Citation: Yang SM, Zhou H, Chen RC, Wang YF, Chen F, Zhang CG, Zhen Y, Yan JH, Su JH. Sequencing of p53 mutation in established human hepatocellular carcinoma cell line of HHC4 and HHC15 in nude mice. World J Gastroenterol 1998; 4(6): 506-510
- URL: https://www.wjgnet.com/1007-9327/full/v4/i6/506.htm
- DOI: https://dx.doi.org/10.3748/wjg.v4.i6.506


