Copyright
©The Author(s) 2023.
World J Gastroenterol. Aug 14, 2023; 29(30): 4685-4700
Published online Aug 14, 2023. doi: 10.3748/wjg.v29.i30.4685
Published online Aug 14, 2023. doi: 10.3748/wjg.v29.i30.4685
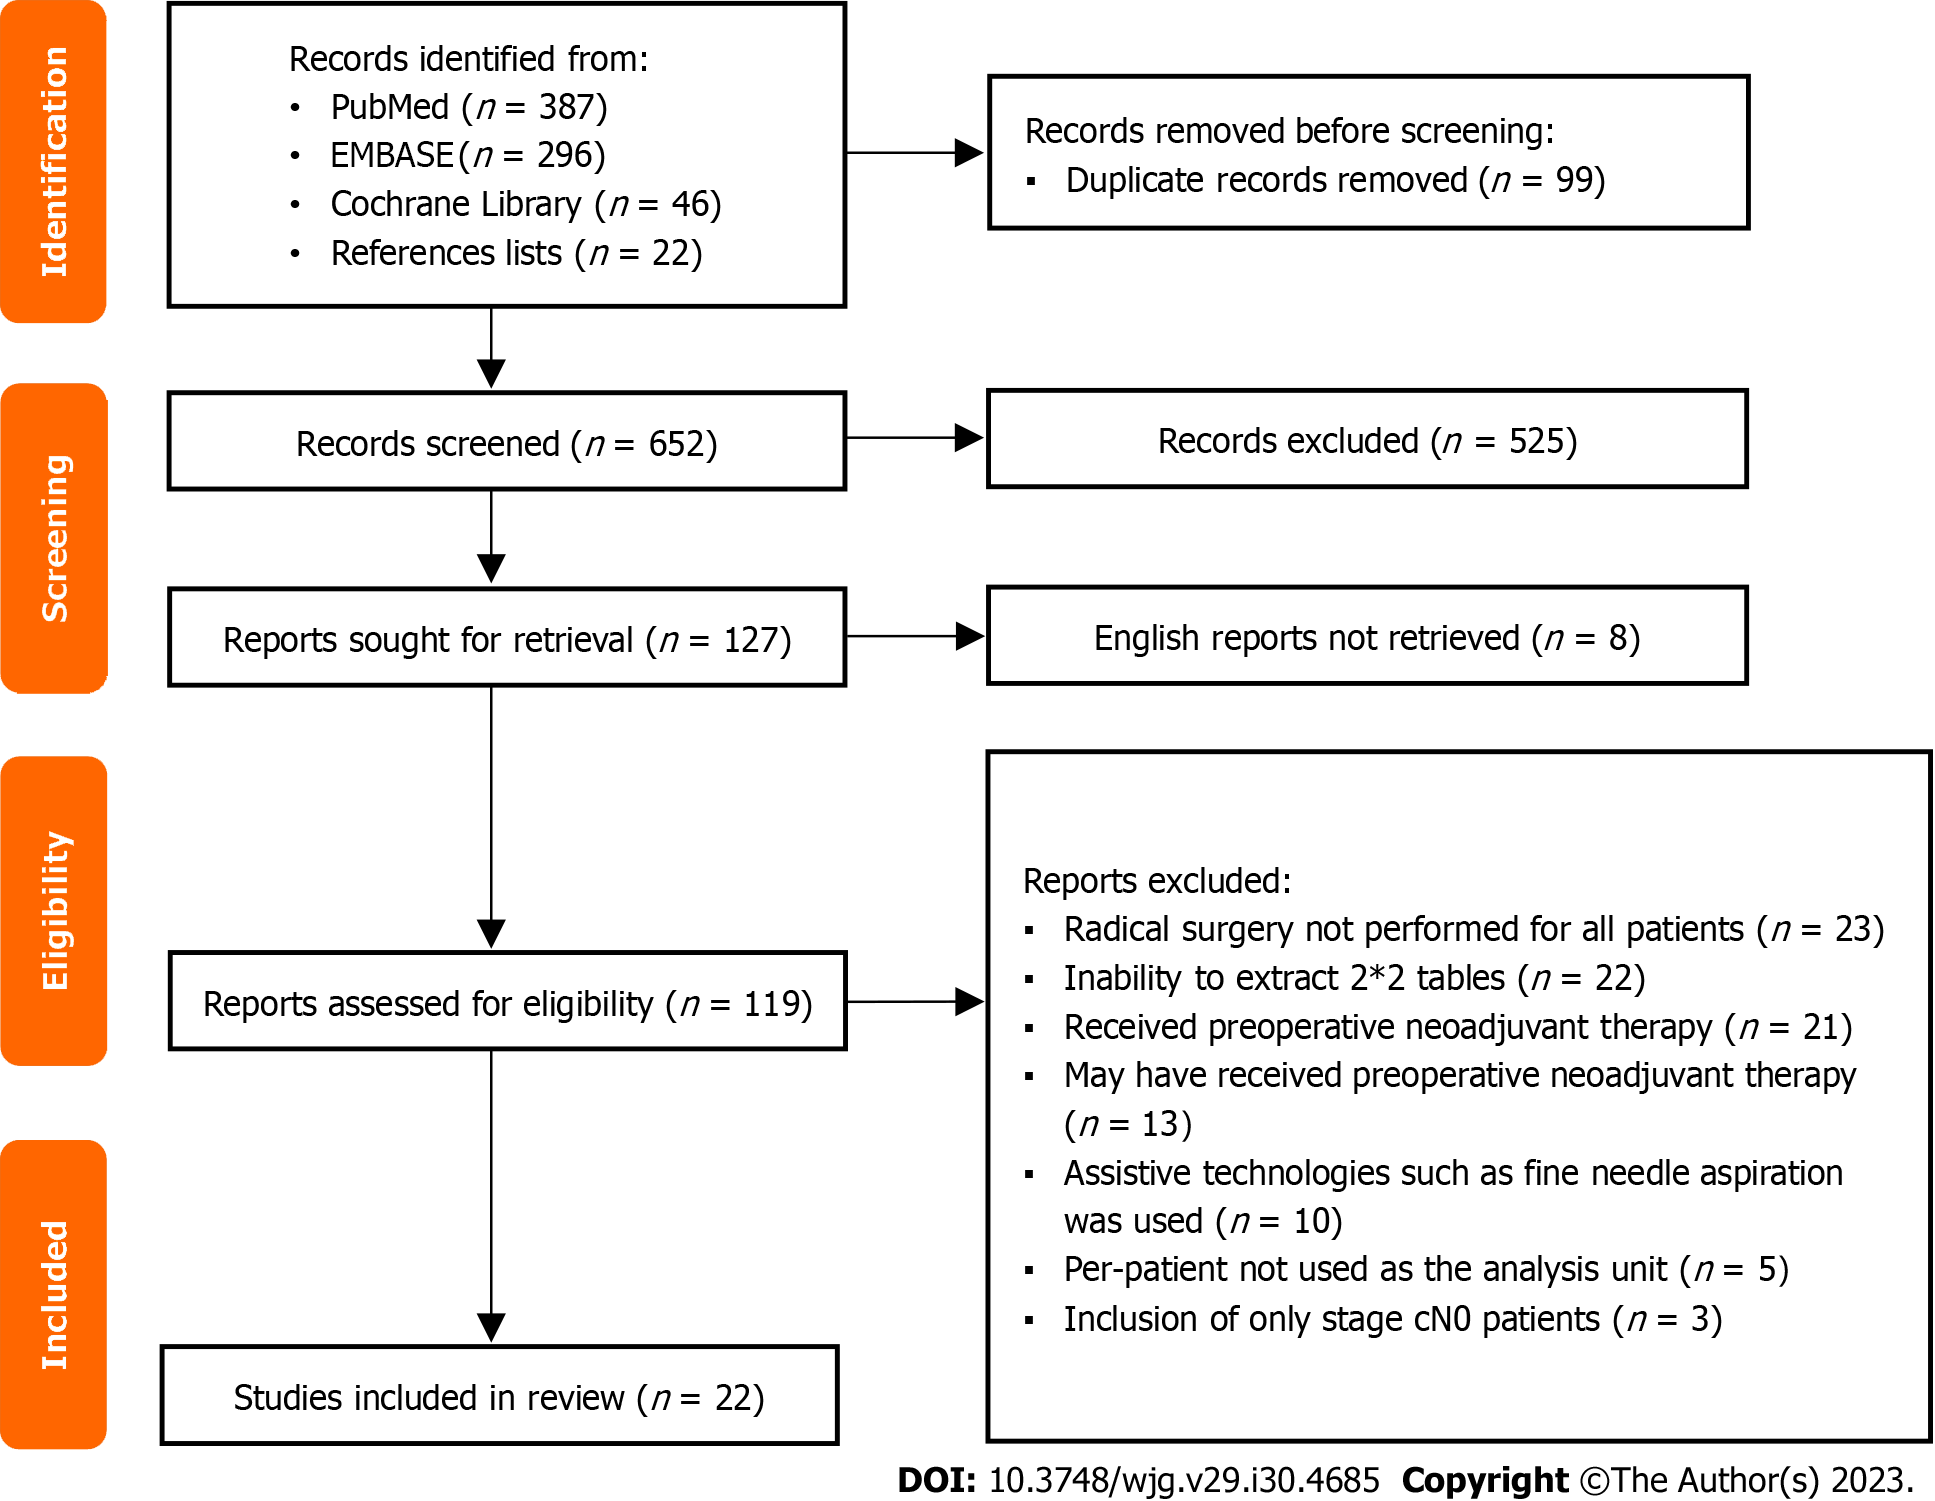
Figure 1 Flow chart for study selection.
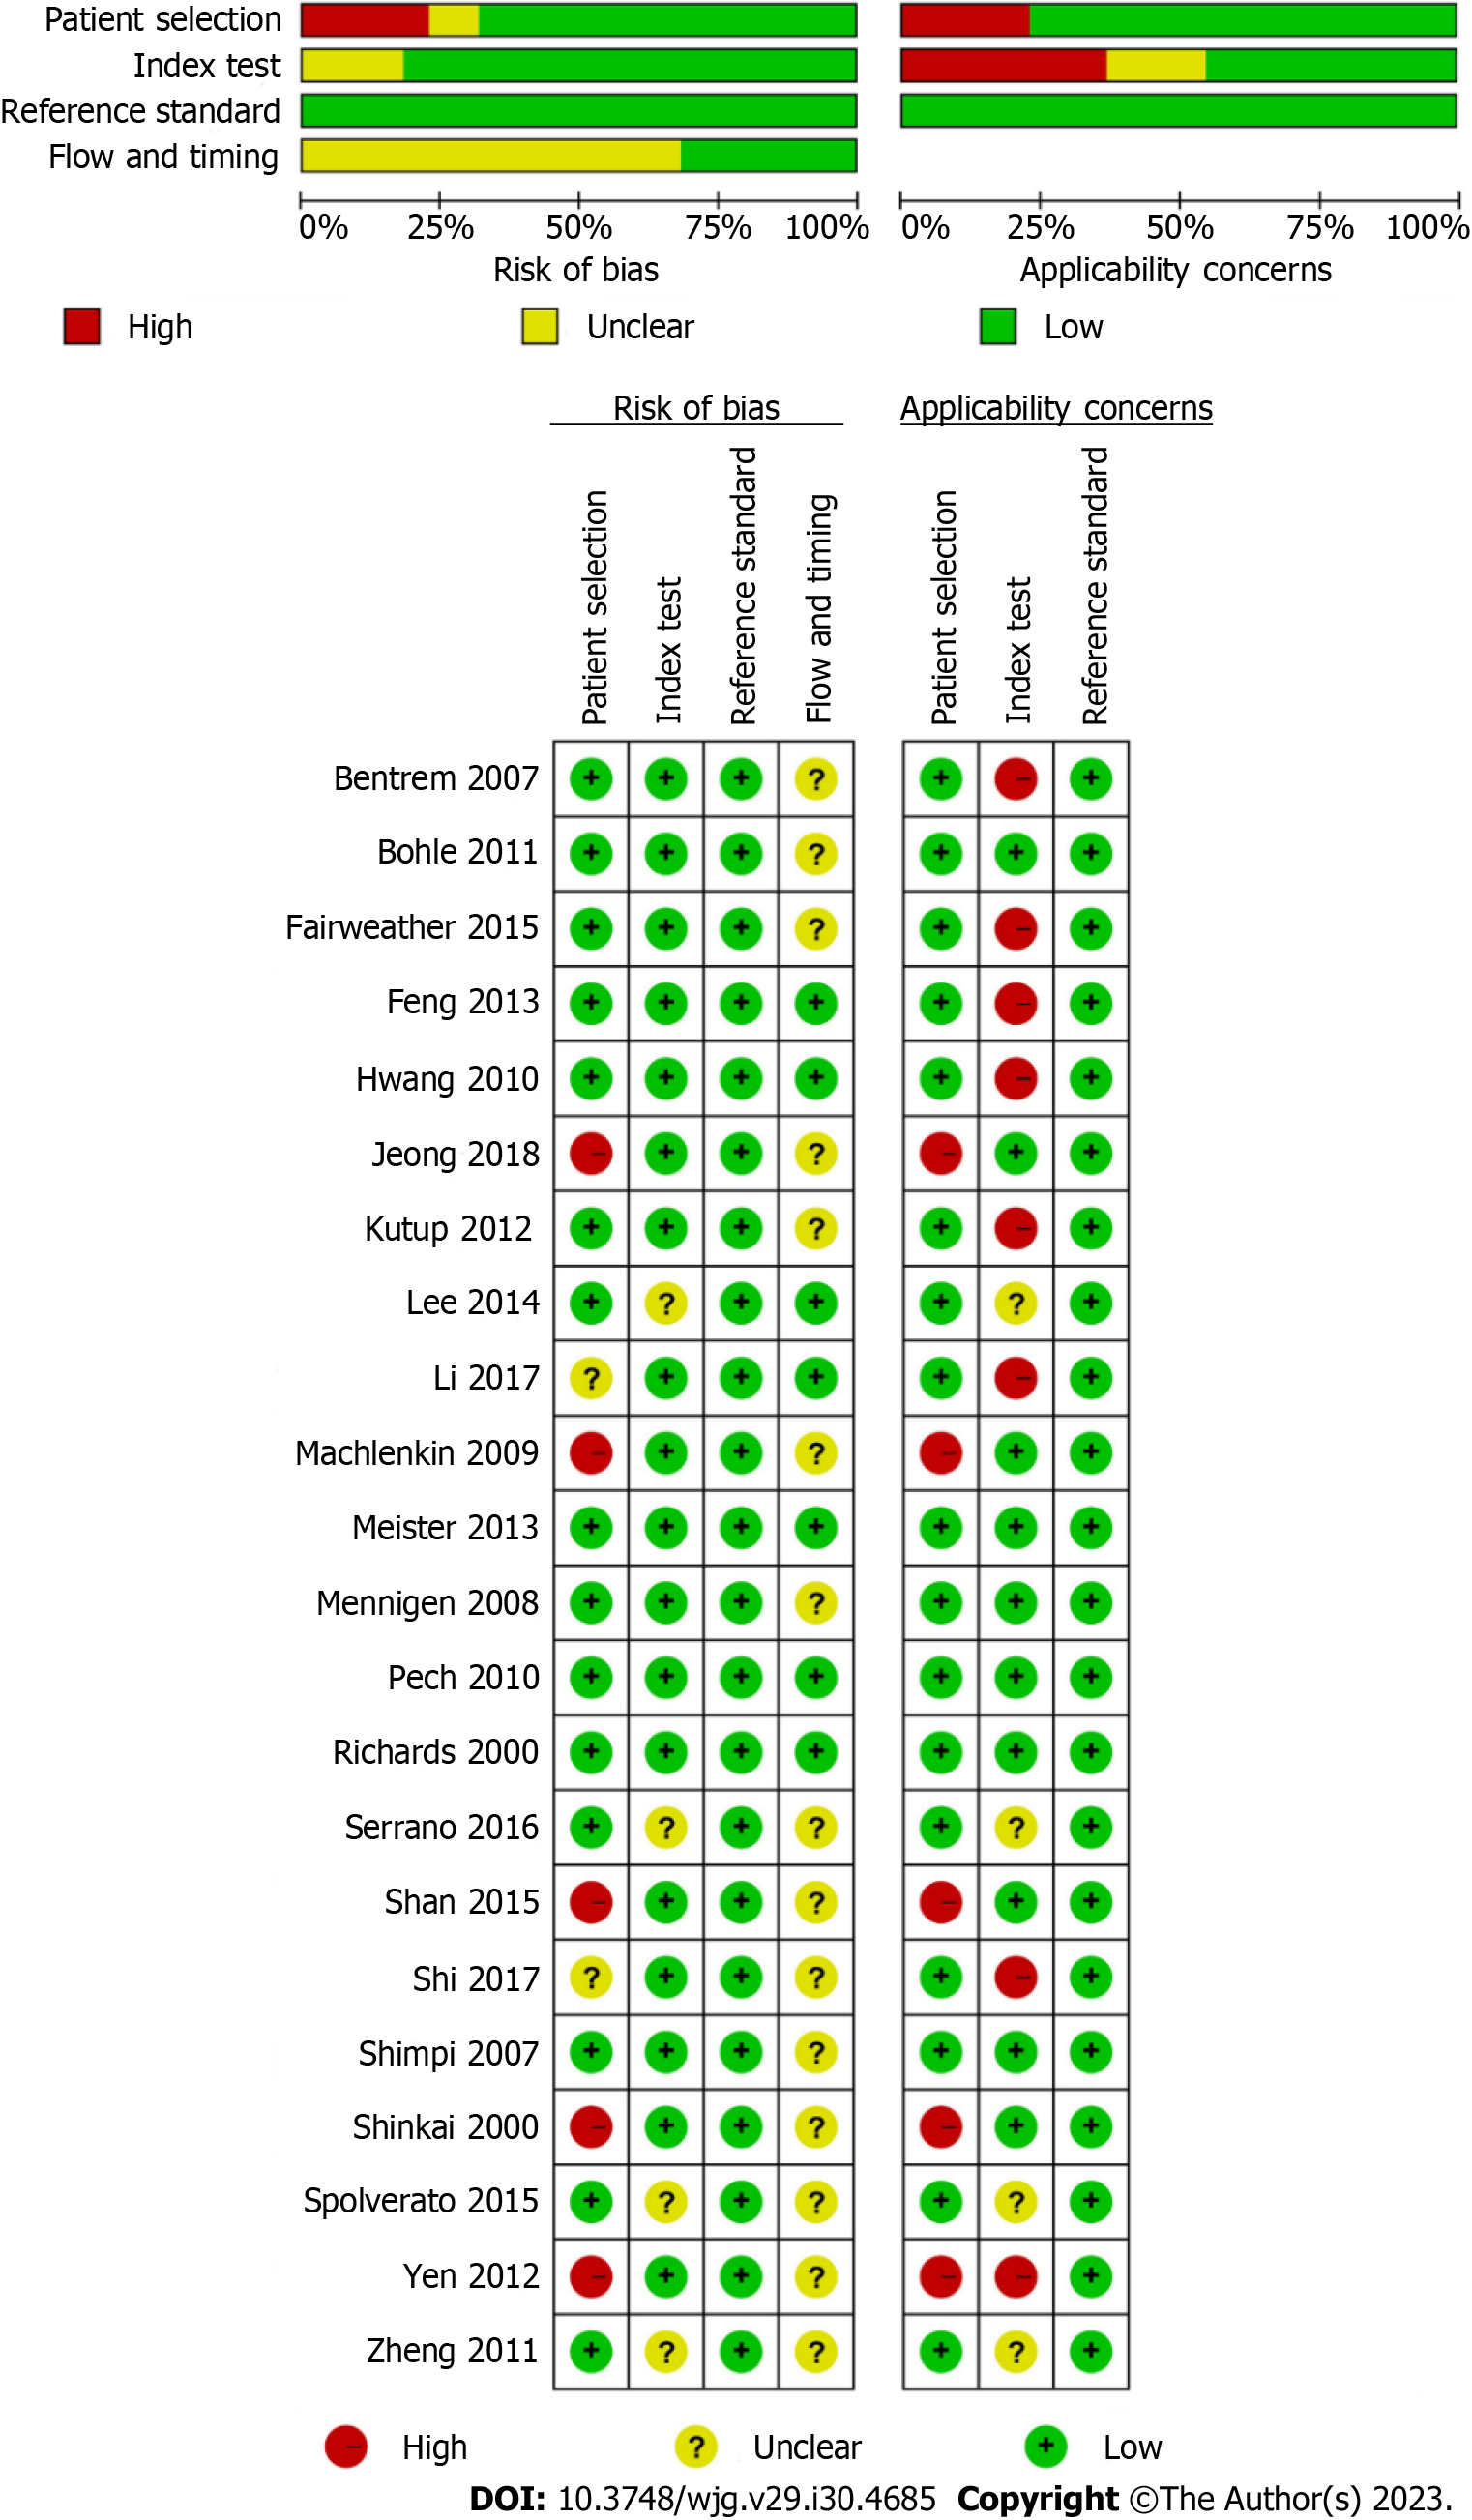
Figure 2 Quality assessment of included studies based on the Quality Assessment of Diagnostic Accuracy Studies tool criteria.
Figure 3 Forest plots showing the pooled evaluation indicators and heterogeneity test results.
A: Pooled sensitivity and specificity; B: Pooled positive likelihood ratio and negative likelihood ratio; C: Pooled diagnostic score and diagnostic odds ratio. CI: Confidence interval.
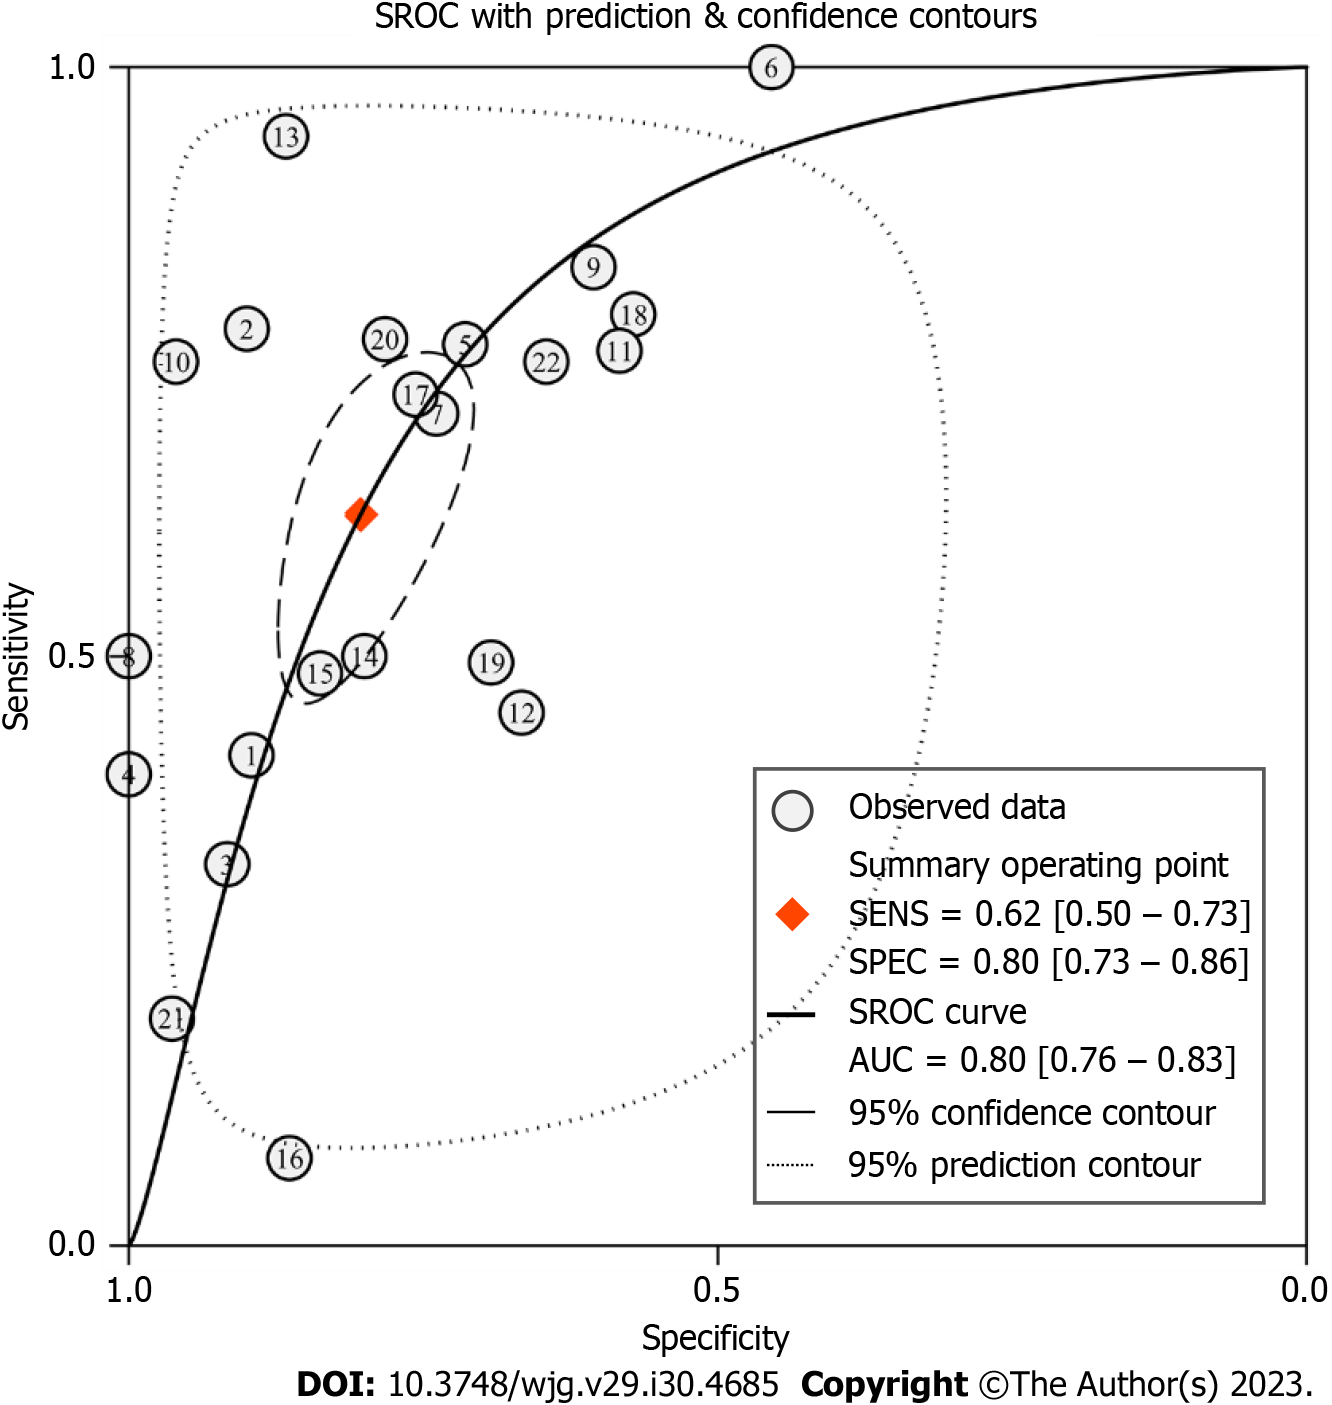
Figure 4 Summary receiver operating characteristic curve for evaluating the diagnostic performance of conventional endoscopic ultrasound.
SROC: Summary receiver operating characteristic; SENS: Sensitivity; SPEC: Specificity; AUC: Area under the curve.
Figure 5 Likelihood ratio scatter diagram for evaluating the diagnostic performance of conventional endoscopic ultrasound.
PLR: Positive likelihood ratio; NLR: Negative likelihood ratio.
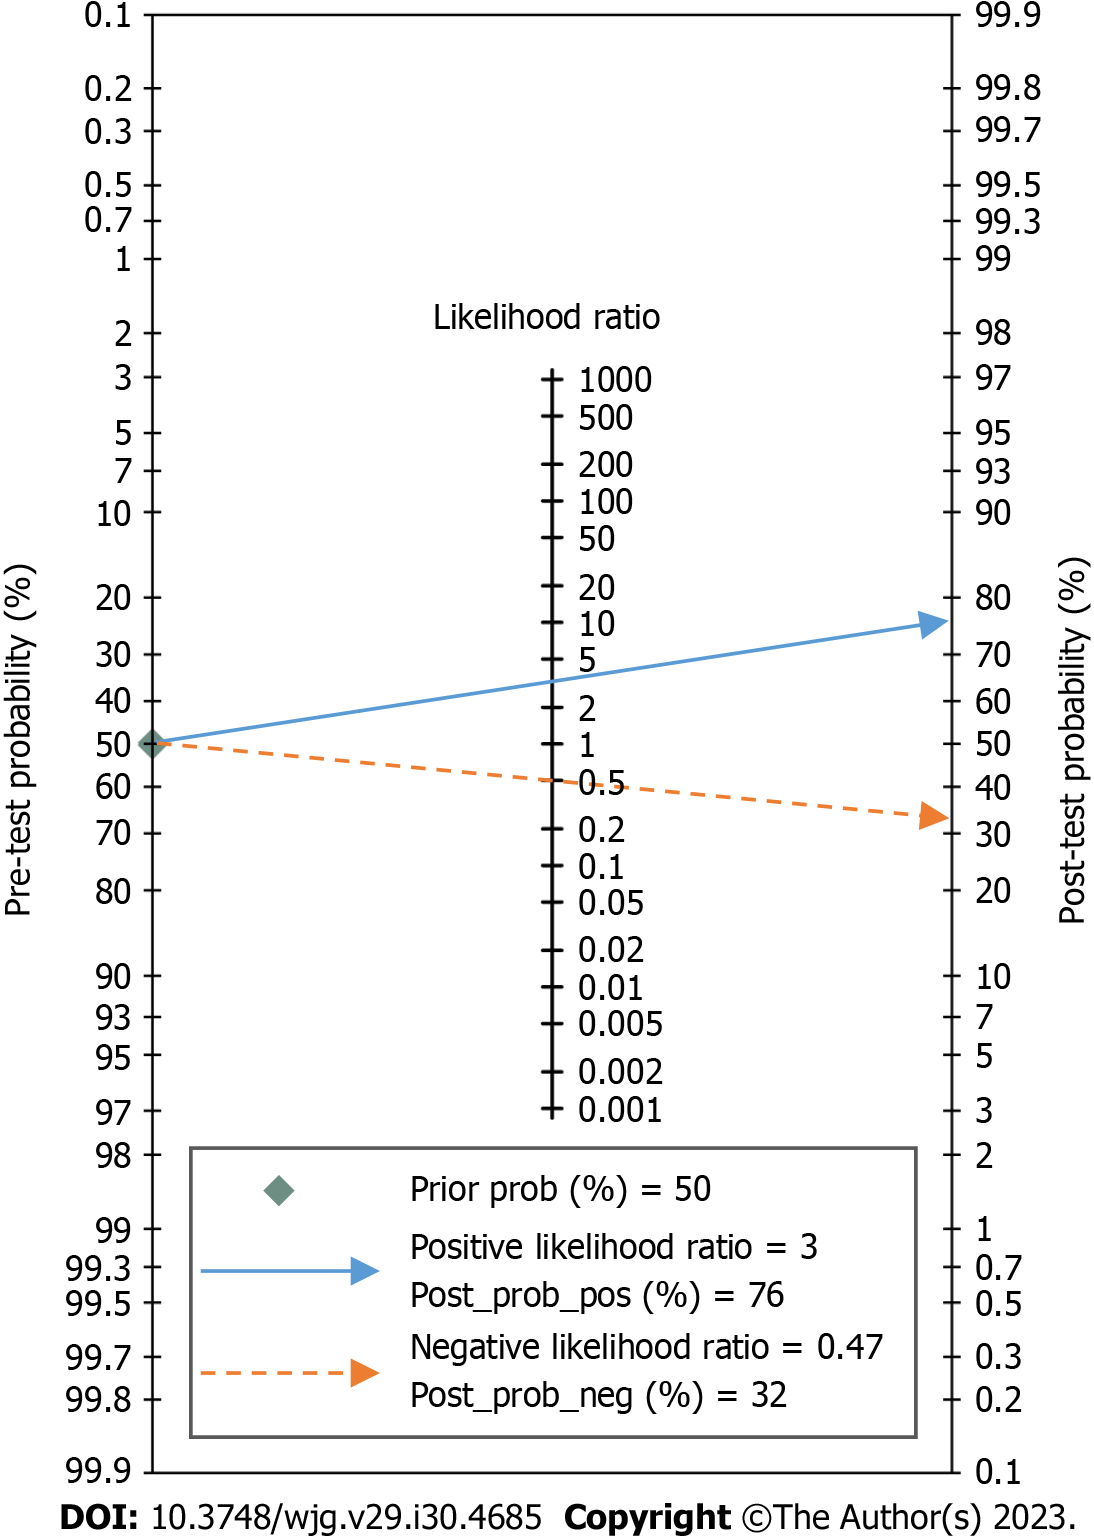
Figure 6 Fagan’s nomogram for the diagnosis of lymph node metastasis with conventional endoscopic ultrasound.
Figure 7 Receiver operating characteristic plane for testing the threshold effect.
ROC: Receiver operating characteristic.
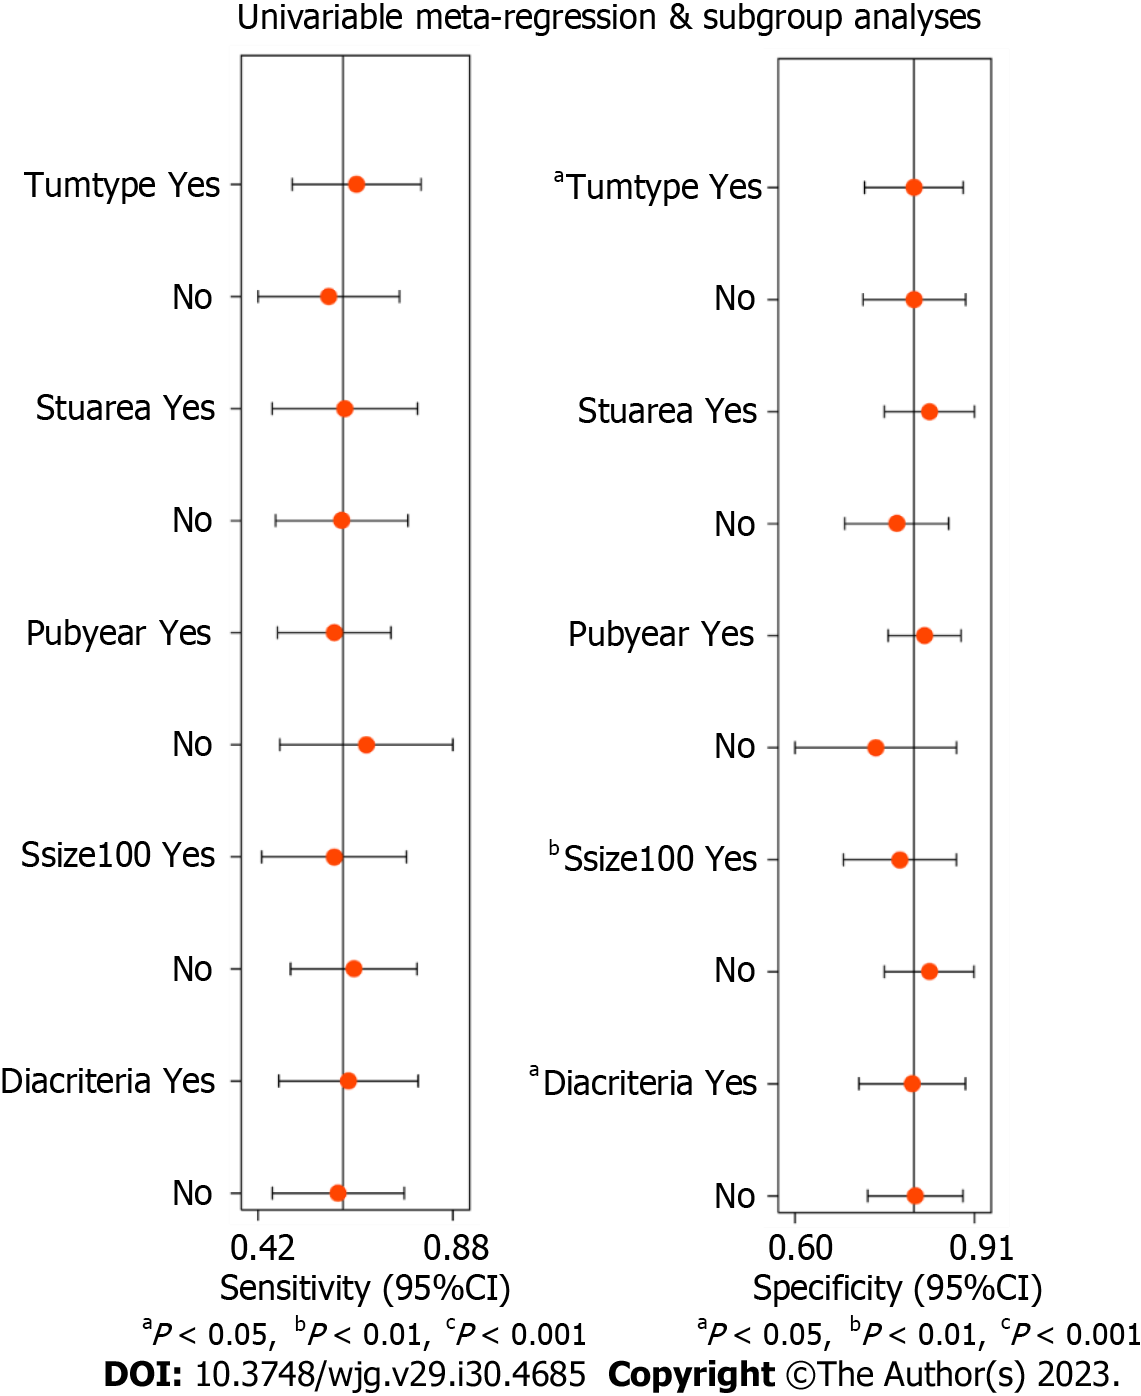
Figure 8 Univariable meta-regression and subgroup analyses for finding sources of heterogeneity.
Tumtype: Tumor type (Yes: Esophageal cancer; No: Gastric cancer); Stuarea: Study area (Yes: Eastern countries; No: Western countries); Pubyear: Publication year (Yes: 2010-2018; No: 2000-2009); Ssize: Sample size (Yes: At least 100 cases; No: Less than 100 cases); Diacriteria: Diagnostic criteria (Yes: Hypoechoic, round, well-defined margin, diameter ≥ 10mm; No: Others). CI: Confidence interval.
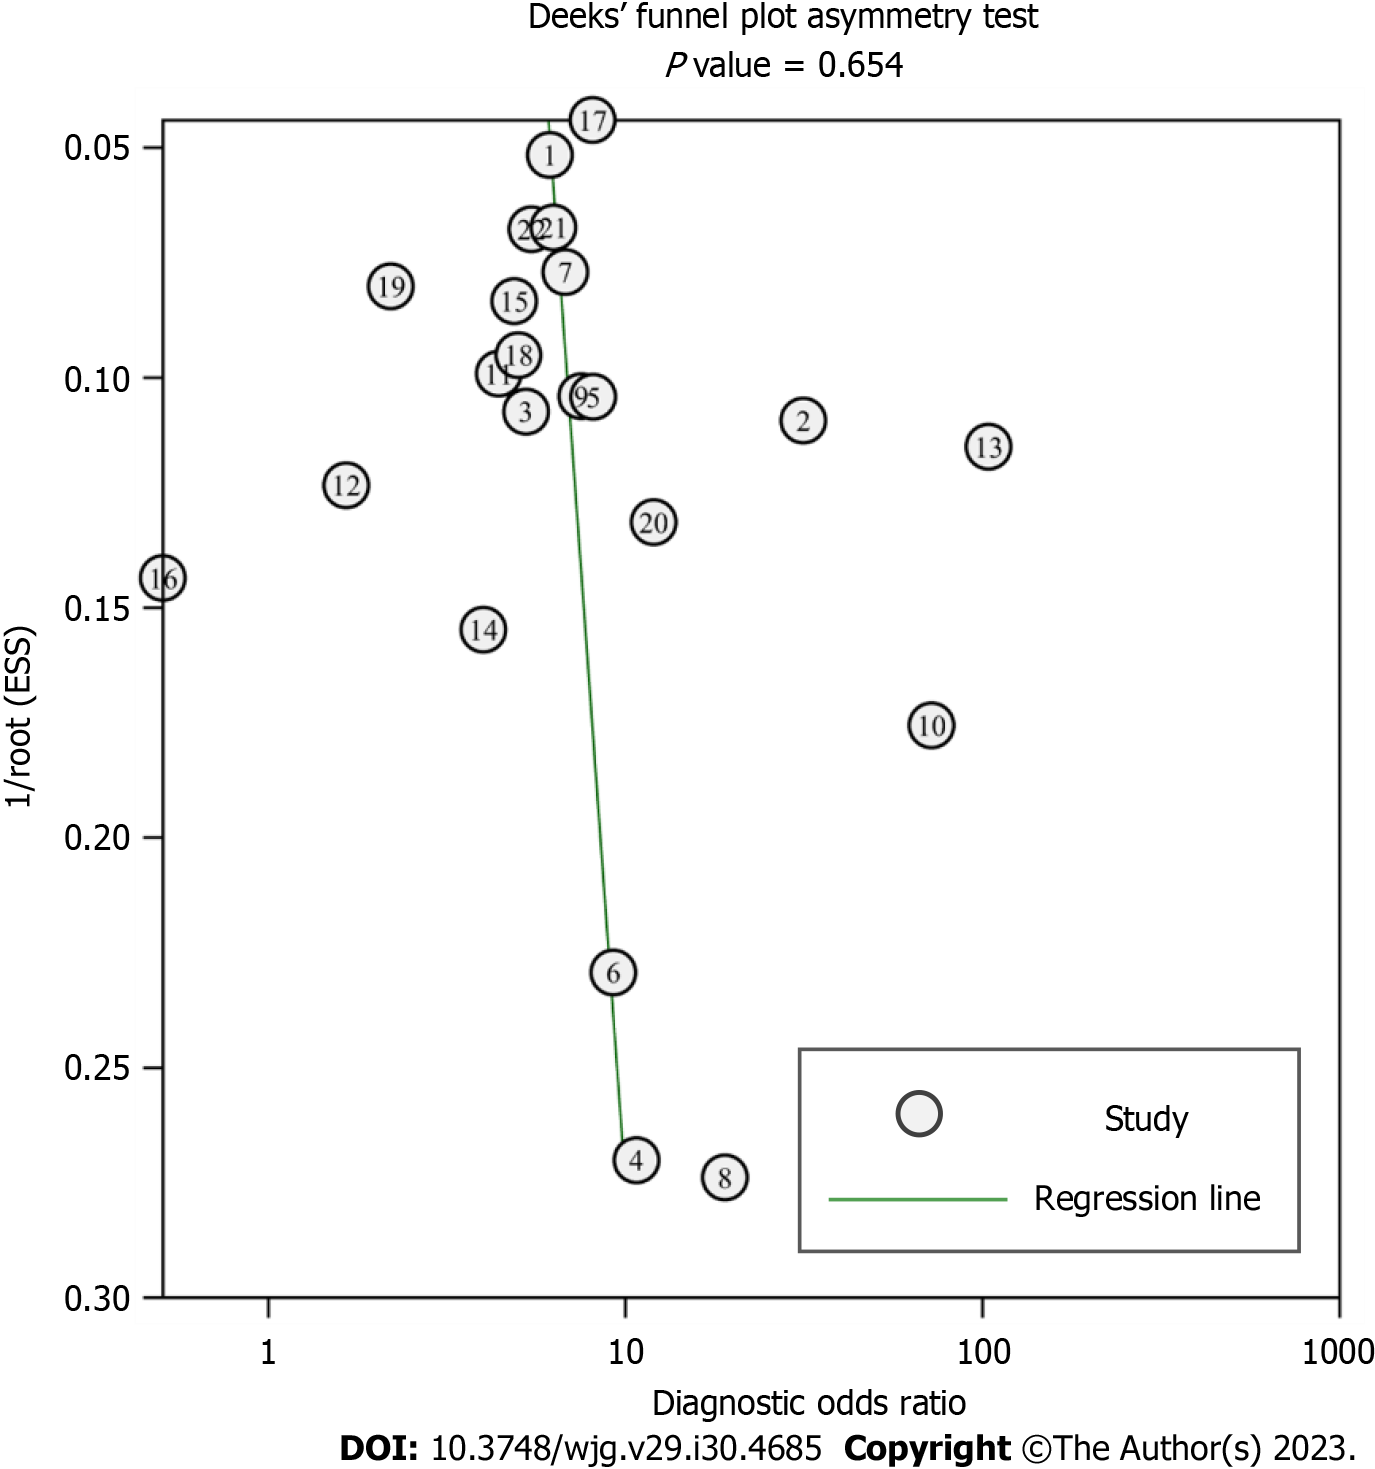
Figure 9 Deeks’ funnel plot for assessing publication bias of the included studies.
- Citation: Chen C, Song YL, Wu ZY, Chen J, Zhang Y, Chen L. Diagnostic value of conventional endoscopic ultrasound for lymph node metastasis in upper gastrointestinal neoplasia: A meta-analysis. World J Gastroenterol 2023; 29(30): 4685-4700
- URL: https://www.wjgnet.com/1007-9327/full/v29/i30/4685.htm
- DOI: https://dx.doi.org/10.3748/wjg.v29.i30.4685


