Copyright
©The Author(s) 2023.
World J Gastroenterol. Jun 28, 2023; 29(24): 3793-3806
Published online Jun 28, 2023. doi: 10.3748/wjg.v29.i24.3793
Published online Jun 28, 2023. doi: 10.3748/wjg.v29.i24.3793
Figure 1 RNA-sequencing analysis of distributions of all differentially expressed genes.
A: Volcano map of the distributions of all differentially expressed genes in formyl peptide receptor 2 (Fpr2)-/- and wild-type (WT) mice (n = 4). Red, green, and blue colors respectively represent upregulated genes, downregulated genes, and genes with no difference in expression; B: Venn diagram of gene counts expressed in the Fpr2-/- and WT mice (n = 4). 9578 genes show identical expression between Fpr2-/- and WT mice. 541 and 371 specific genes are expressed in Fpr2-/- and WT mice, respectively. Fpr2: Formyl peptide receptor 2; WT: Wild-type.
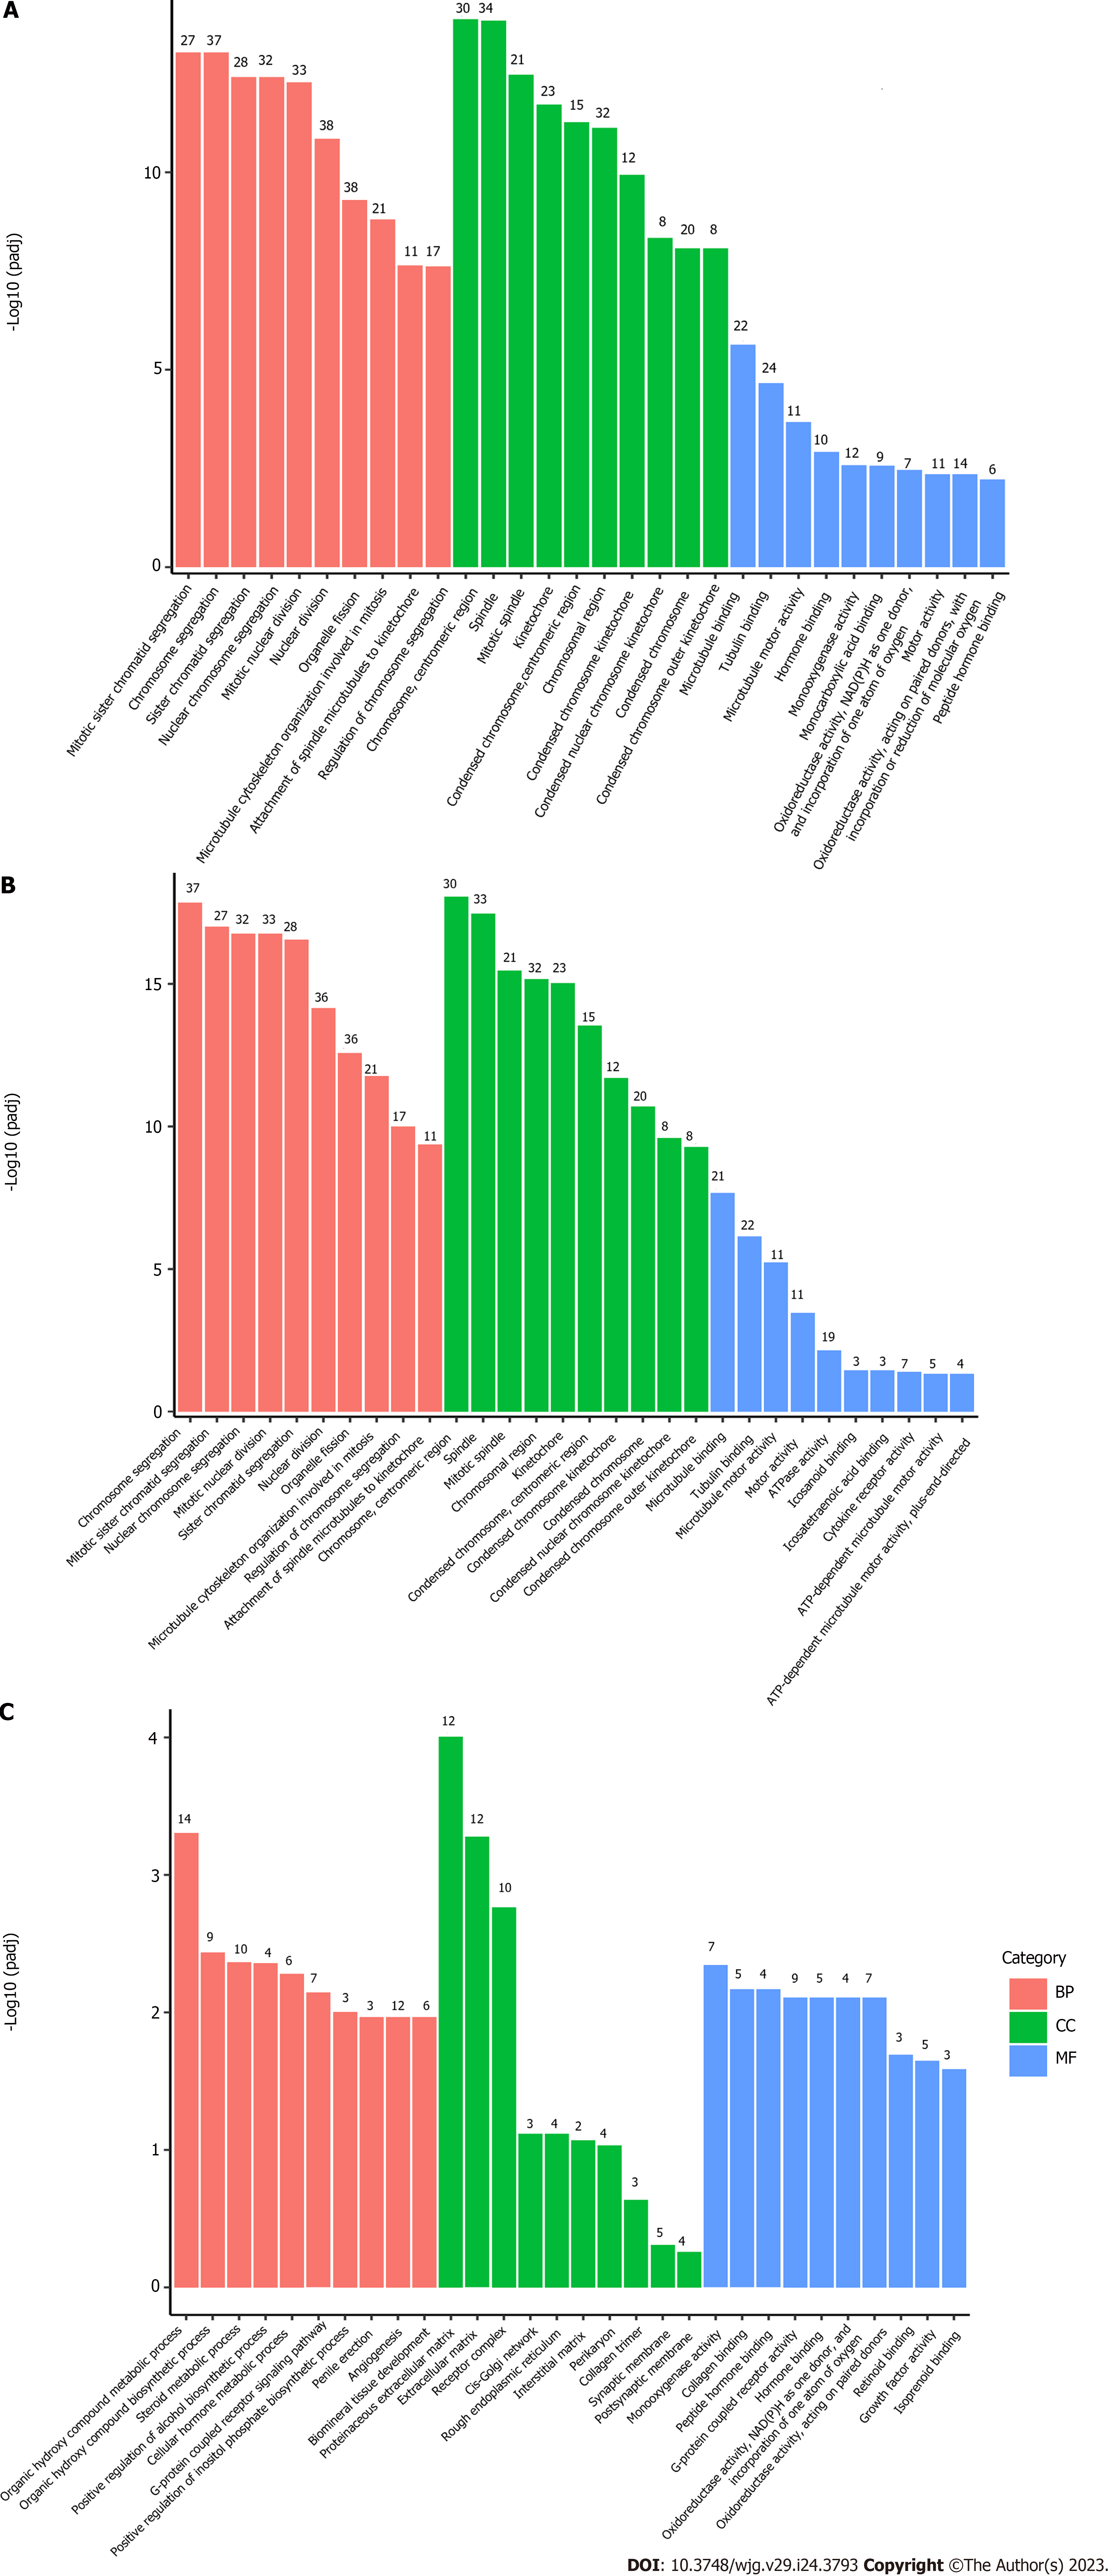
Figure 2 Gene Ontology pathway enrichment analysis of differentially expressed genes.
The bar graph shows the top 10 (red for biological processes, green for cellular component and blue for molecular function) enriched Gene Ontology pathways. A: Gene Ontology (GO) pathway enrichment analysis of all differentially expressed genes (DEGs); B: GO pathway enrichment analysis of upregulated DEGs; C: GO pathway enrichment analysis of downregulated DEGs. BP: Biological process; CC: Cellular component; MF: Molecular function.
Figure 3 Significant enrichment of Kyoto Encyclopedia of Genes and Genomes pathways with differentially expressed genes.
The size of the bubble indicates the enrichment score, and the color indicates the significance of the enrichment.
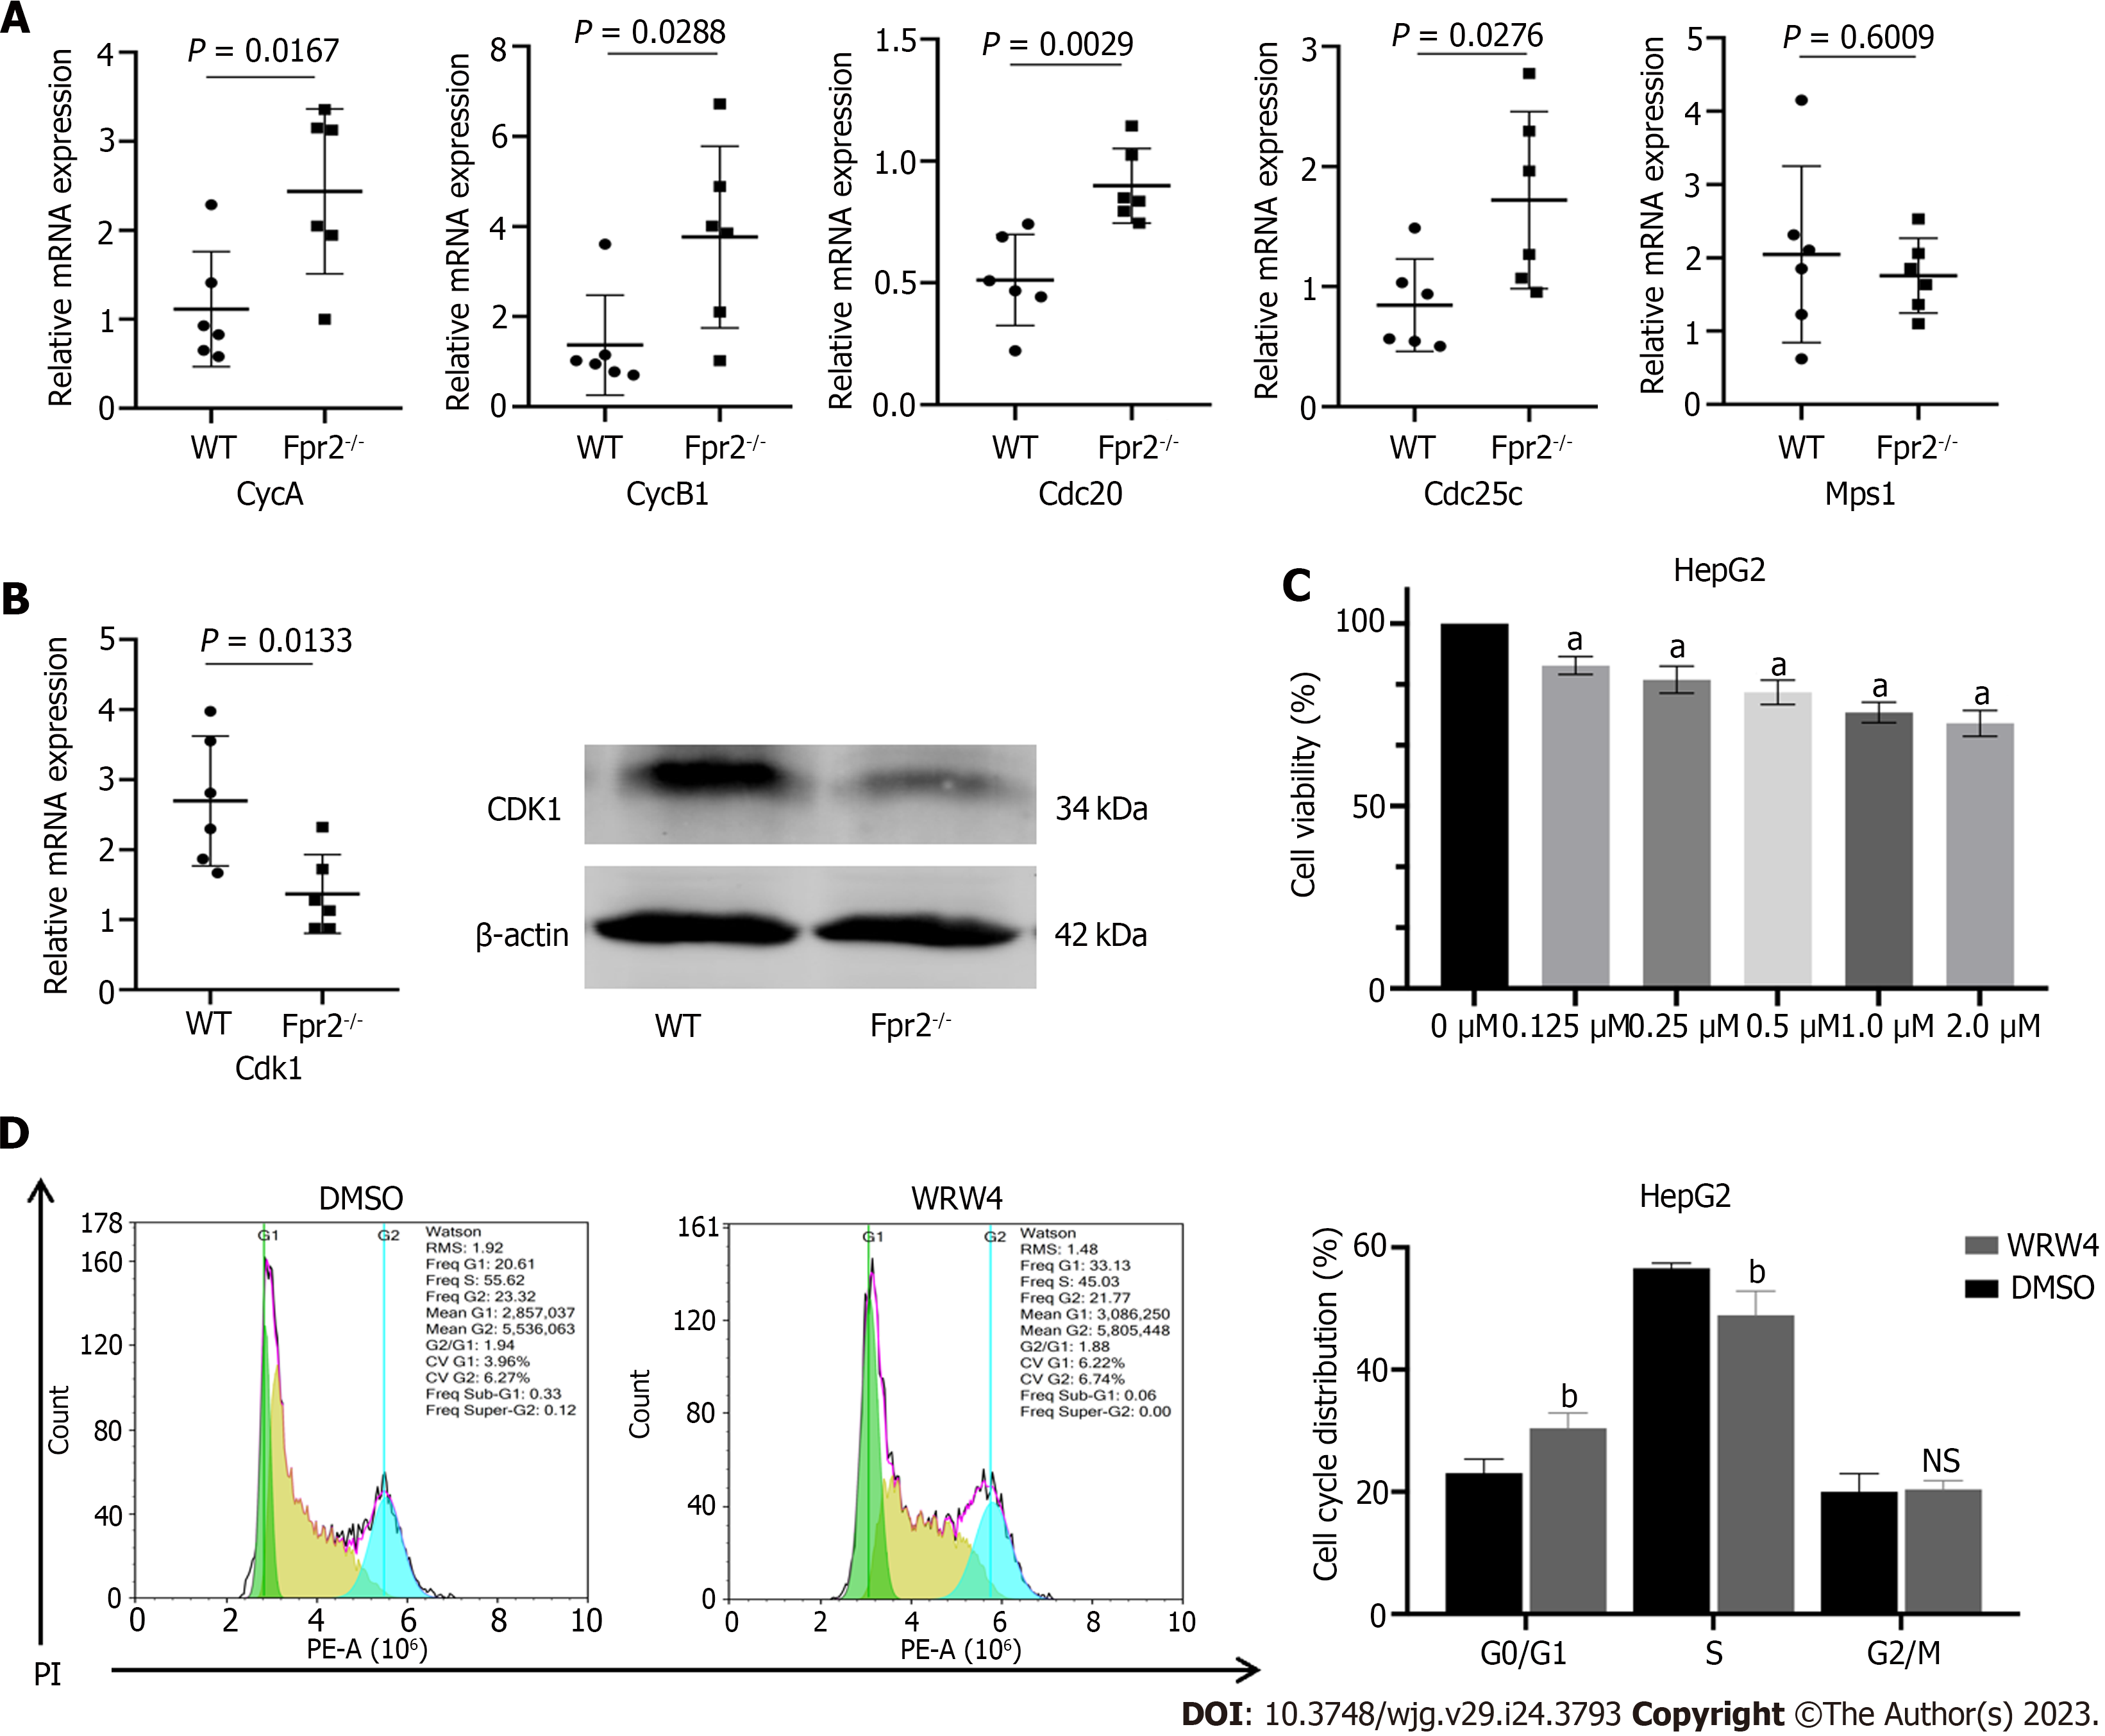
Figure 4 The effect of formyl peptide receptor 2 deletion on cell cycle.
A: Quantitative real time-polymerase chain reaction (qRT-PCR) validates the expression of key cell cycle genes regulated by formyl peptide receptor 2 (Fpr2), including CycA, CycB1, Cdc20, Cdc25c, and Mps1 (n = 6). P values are indicated on the graphs; B: qRT-PCR and western blot analyses are used to validate the changes in expression of CDK1; C: The effect of different concentrations of WRW4 on the proliferation activity of HepG2 cells detected by CCK-8 (n = 5); D: The cell cycle distribution of HepG2 cells treated with WRW4 (1 μM) and dimethyl sulfoxide determined by flow cytometry (n = 3). Data are shown as mean ± SD. aP < 0.0001 vs the 0 μM group; bP < 0.05 vs the dimethyl sulfoxide group; NS: No significant; Fpr2: Formyl peptide receptor 2; WT: Wild-type; DMSO: Dimethyl sulfoxide.
Figure 5 Liver function test in serum of wild-type and formyl peptide receptor 2-/- mice (n = 4).
The values are expressed as g/L for albumin levels, and U/L for alanine transaminase, lactate dehydrogenase, aspartate transaminase, and alkaline phosphatase levels. Data are expressed as mean ± SD. aP < 0.05, bP < 0.01 vs the wild-type group; NS: No significant; ALB: Albumin; ALP: Alkaline phosphatase; ALT: Alanine transaminase; AST: Aspartate transaminase; LDH: Lactate dehydrogenase; Fpr2: Formyl peptide receptor 2; WT: Wild-type.
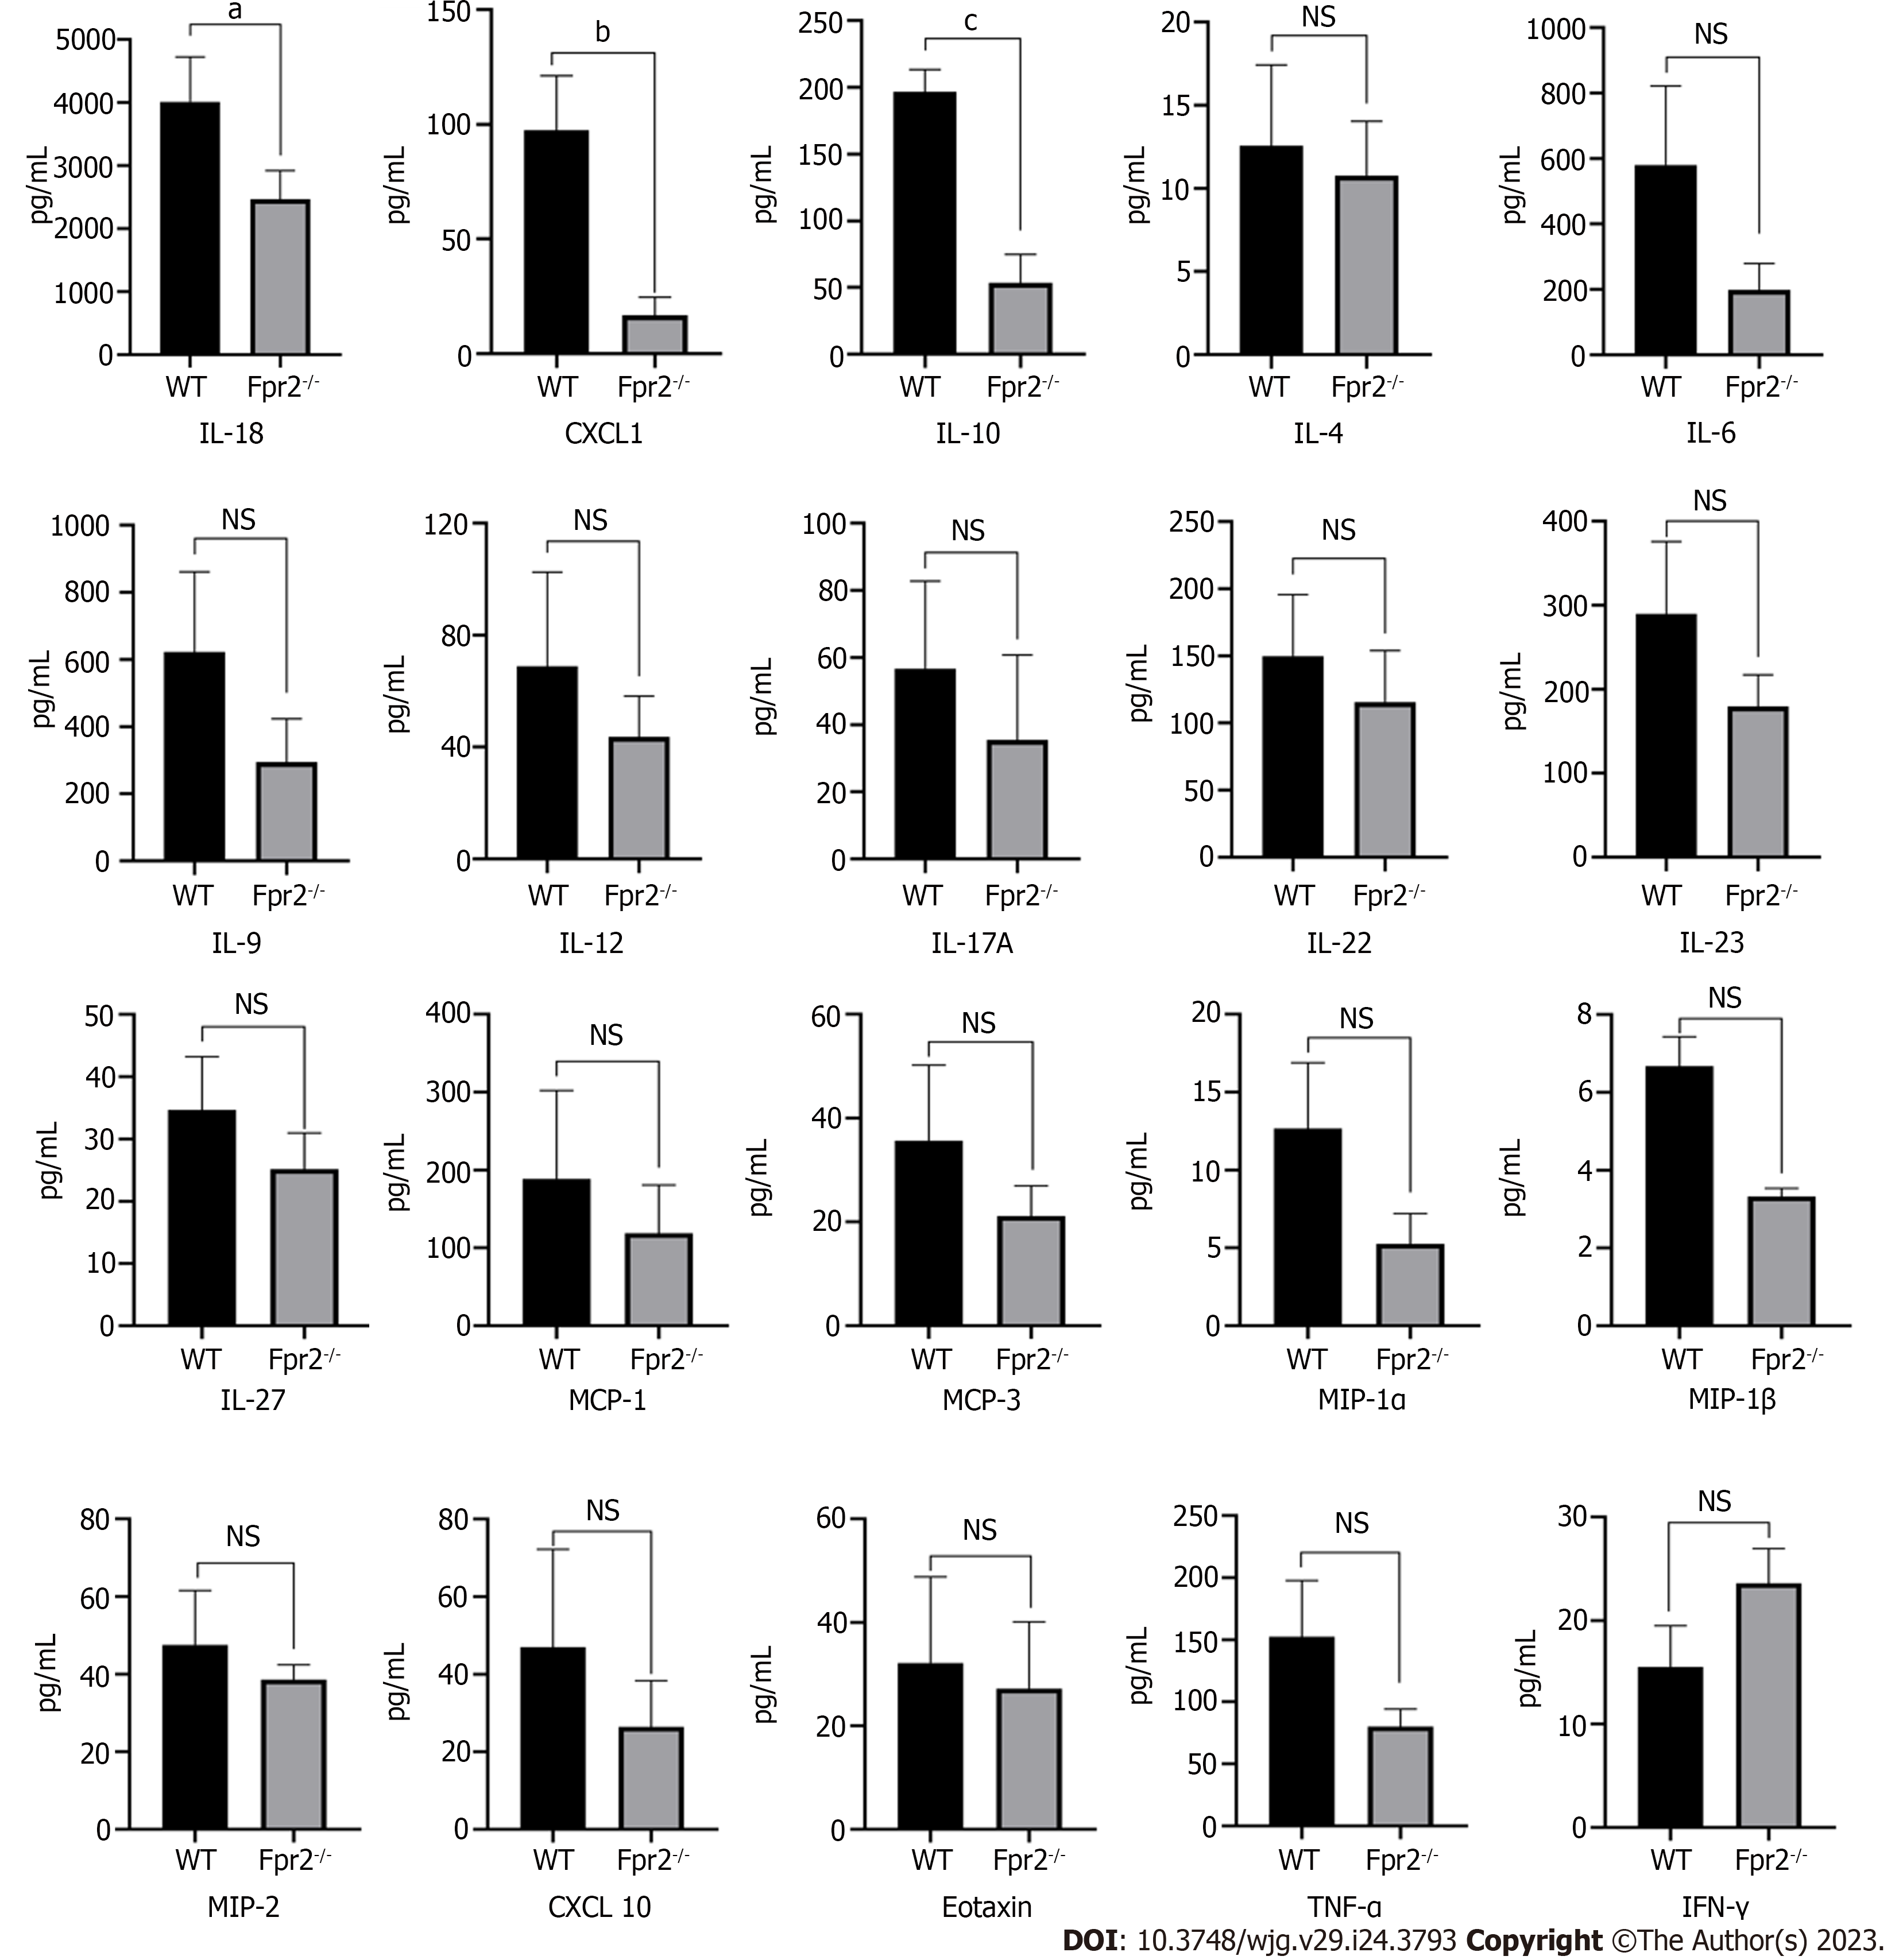
Figure 6 Luminex assay analyses cytokines/chemokines concentration in liver of wild-type and formyl peptide receptor 2-/- mice (n = 3).
Mean concentration values are shown as normalized to tissue weight. Data are expressed as mean ± SD. aP < 0.05, bP < 0.01, cP < 0.001 vs the wild-type group; NS: No significant; CXCL: Chemokine (C-X-C motif) ligand; IFN-γ: Interferon gamma; IL: Interleukin; MCP: Monocyte chemoattractant protein; MIP: Macrophage inflammatory protein; TNF: Tumor necrosis factor; Fpr2: Formyl peptide receptor 2; WT: Wild-type.
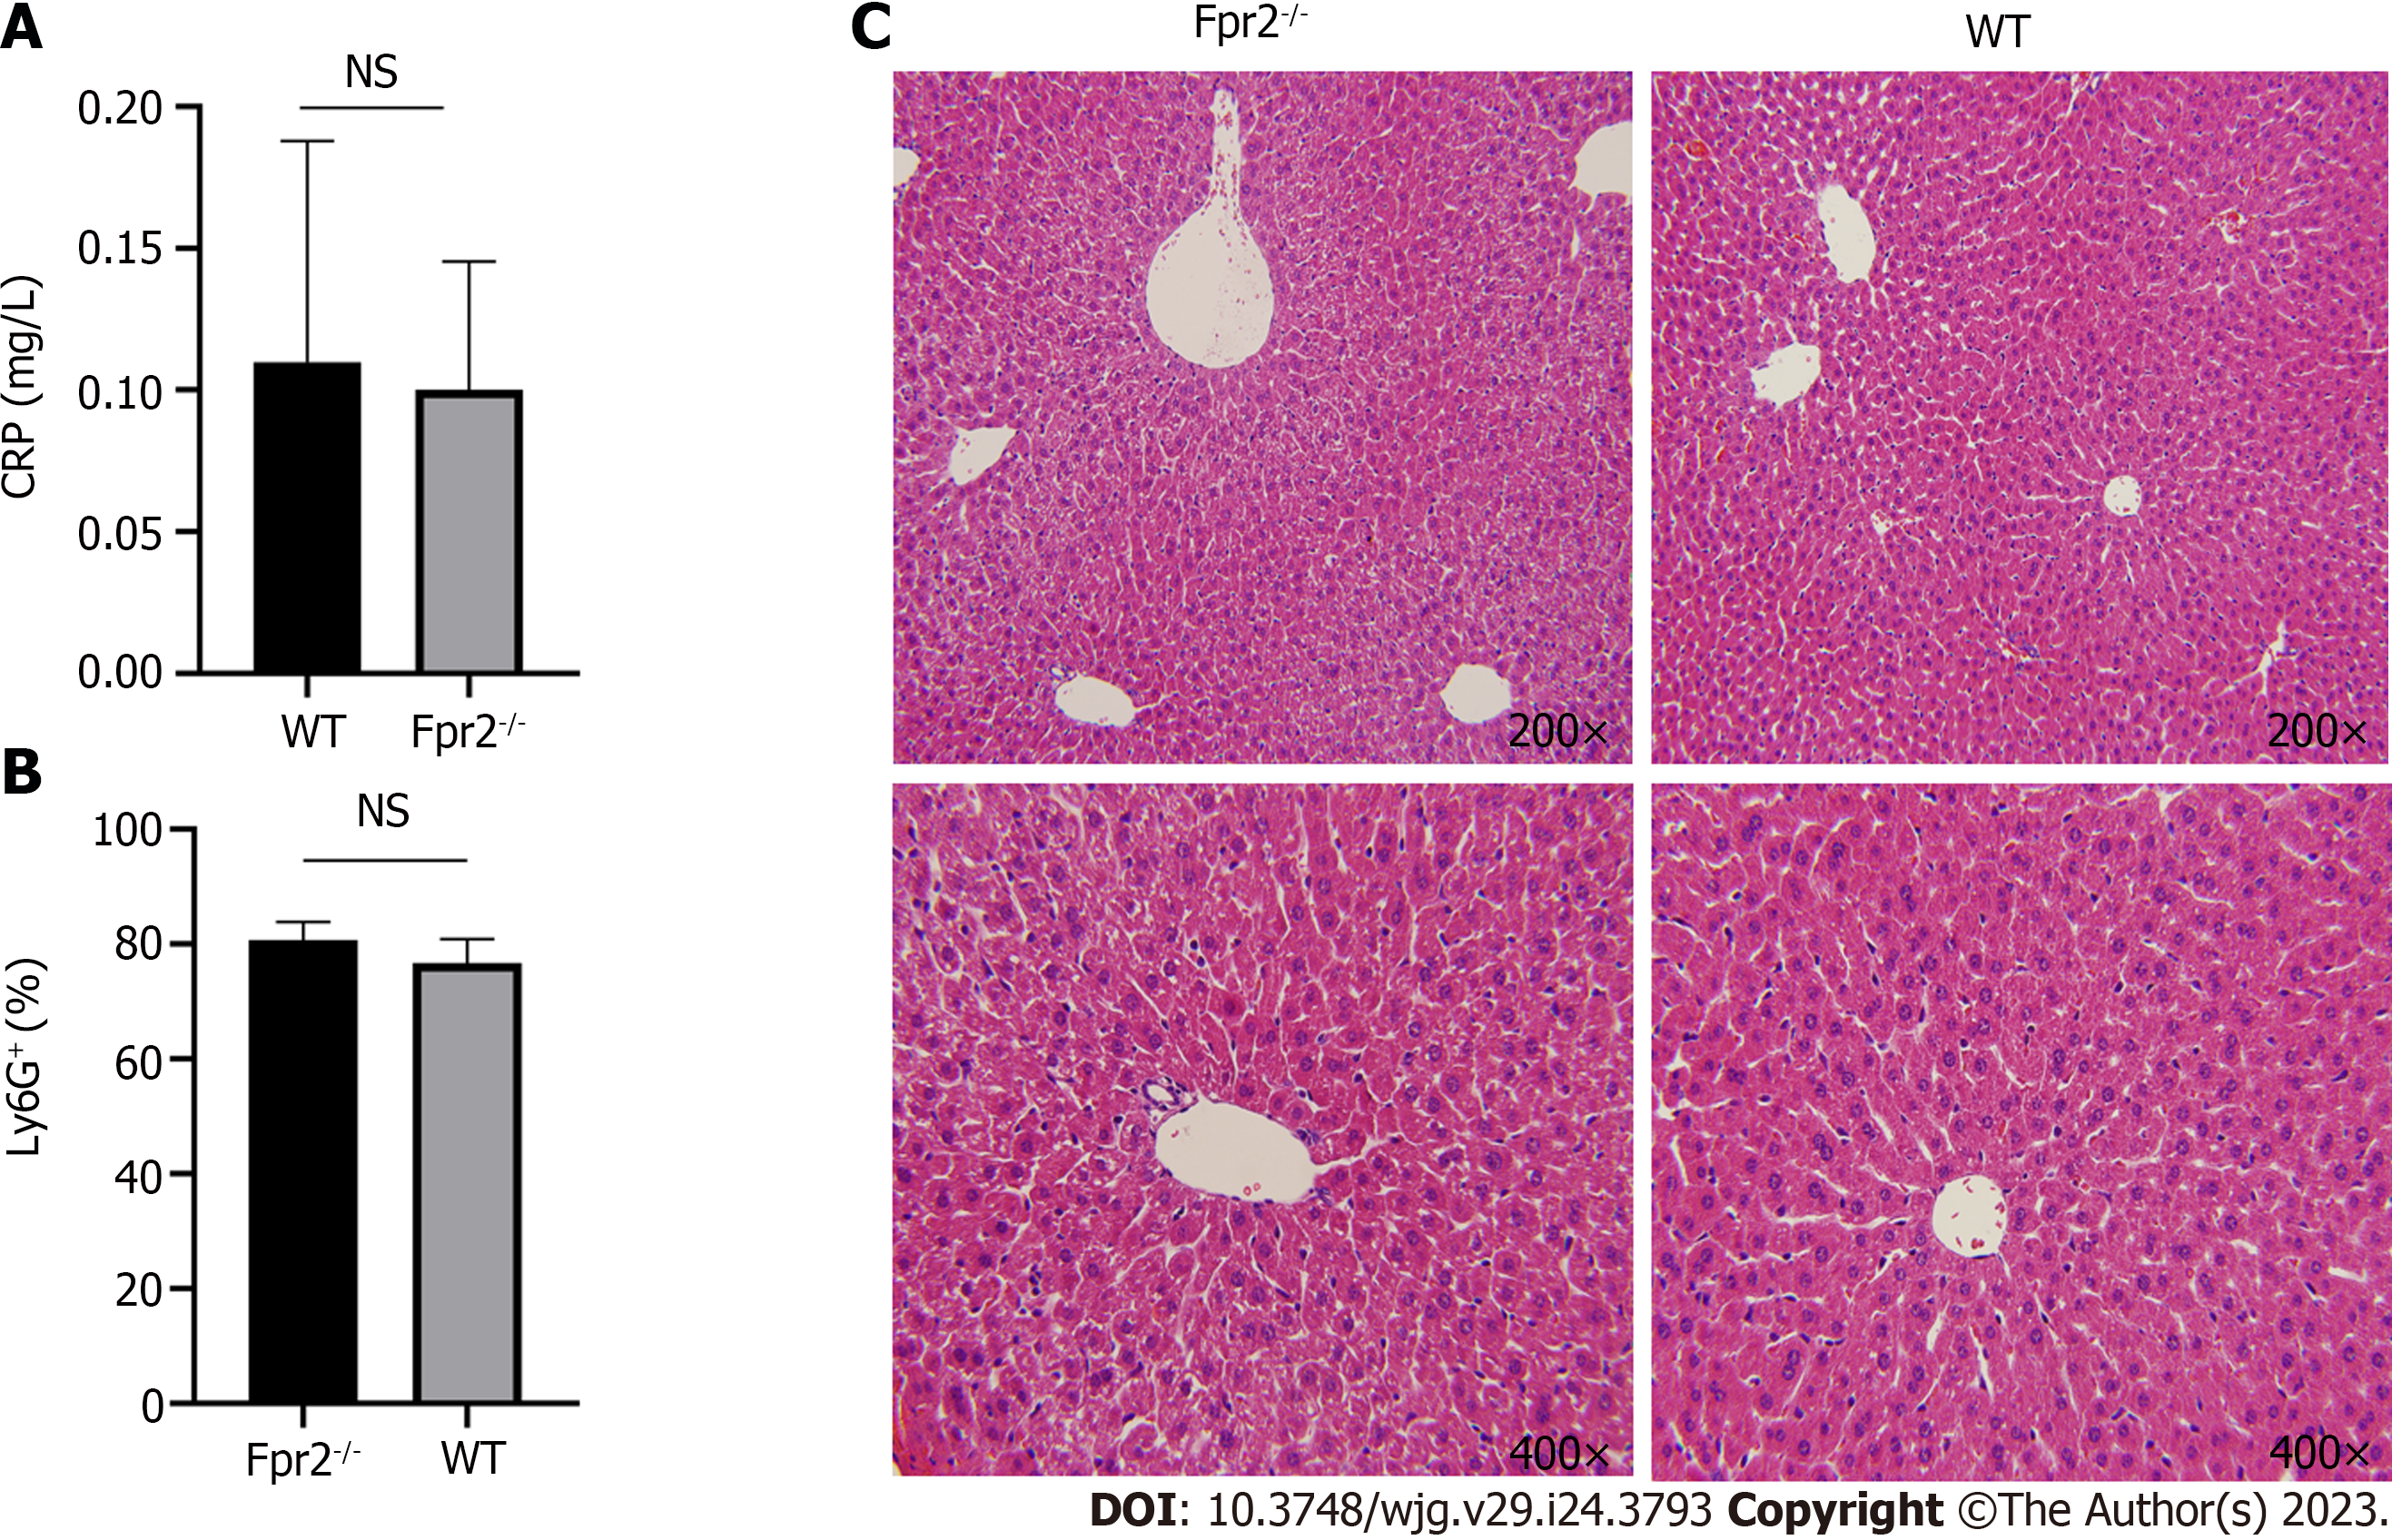
Figure 7 Evaluation of liver inflammation status.
A: Serum C-reactive protein level in wild-type (WT) and formyl peptide receptor 2 (Fpr2)-/- mice (n = 4); B: Flow cytometry analysis of the number of neutrophils (% of Ly6G+ cells) in the liver of WT and Fpr2-/- mice (n = 3); C: Representative images of hematoxylin-eosin staining of liver tissue sections of Fpr2-/- and WT mice. The image magnification is 200 × and 400 ×. NS: No significant difference. Fpr2: Formyl peptide receptor 2; WT: Wild-type; CRP: C-reactive protein.
- Citation: Liu H, Sun ZY, Jiang H, Li XD, Jiang YQ, Liu P, Huang WH, Lv QY, Zhang XL, Li RK. Transcriptome sequencing and experiments reveal the effect of formyl peptide receptor 2 on liver homeostasis. World J Gastroenterol 2023; 29(24): 3793-3806
- URL: https://www.wjgnet.com/1007-9327/full/v29/i24/3793.htm
- DOI: https://dx.doi.org/10.3748/wjg.v29.i24.3793


