Copyright
©The Author(s) 2023.
World J Gastroenterol. Apr 21, 2023; 29(15): 2294-2309
Published online Apr 21, 2023. doi: 10.3748/wjg.v29.i15.2294
Published online Apr 21, 2023. doi: 10.3748/wjg.v29.i15.2294
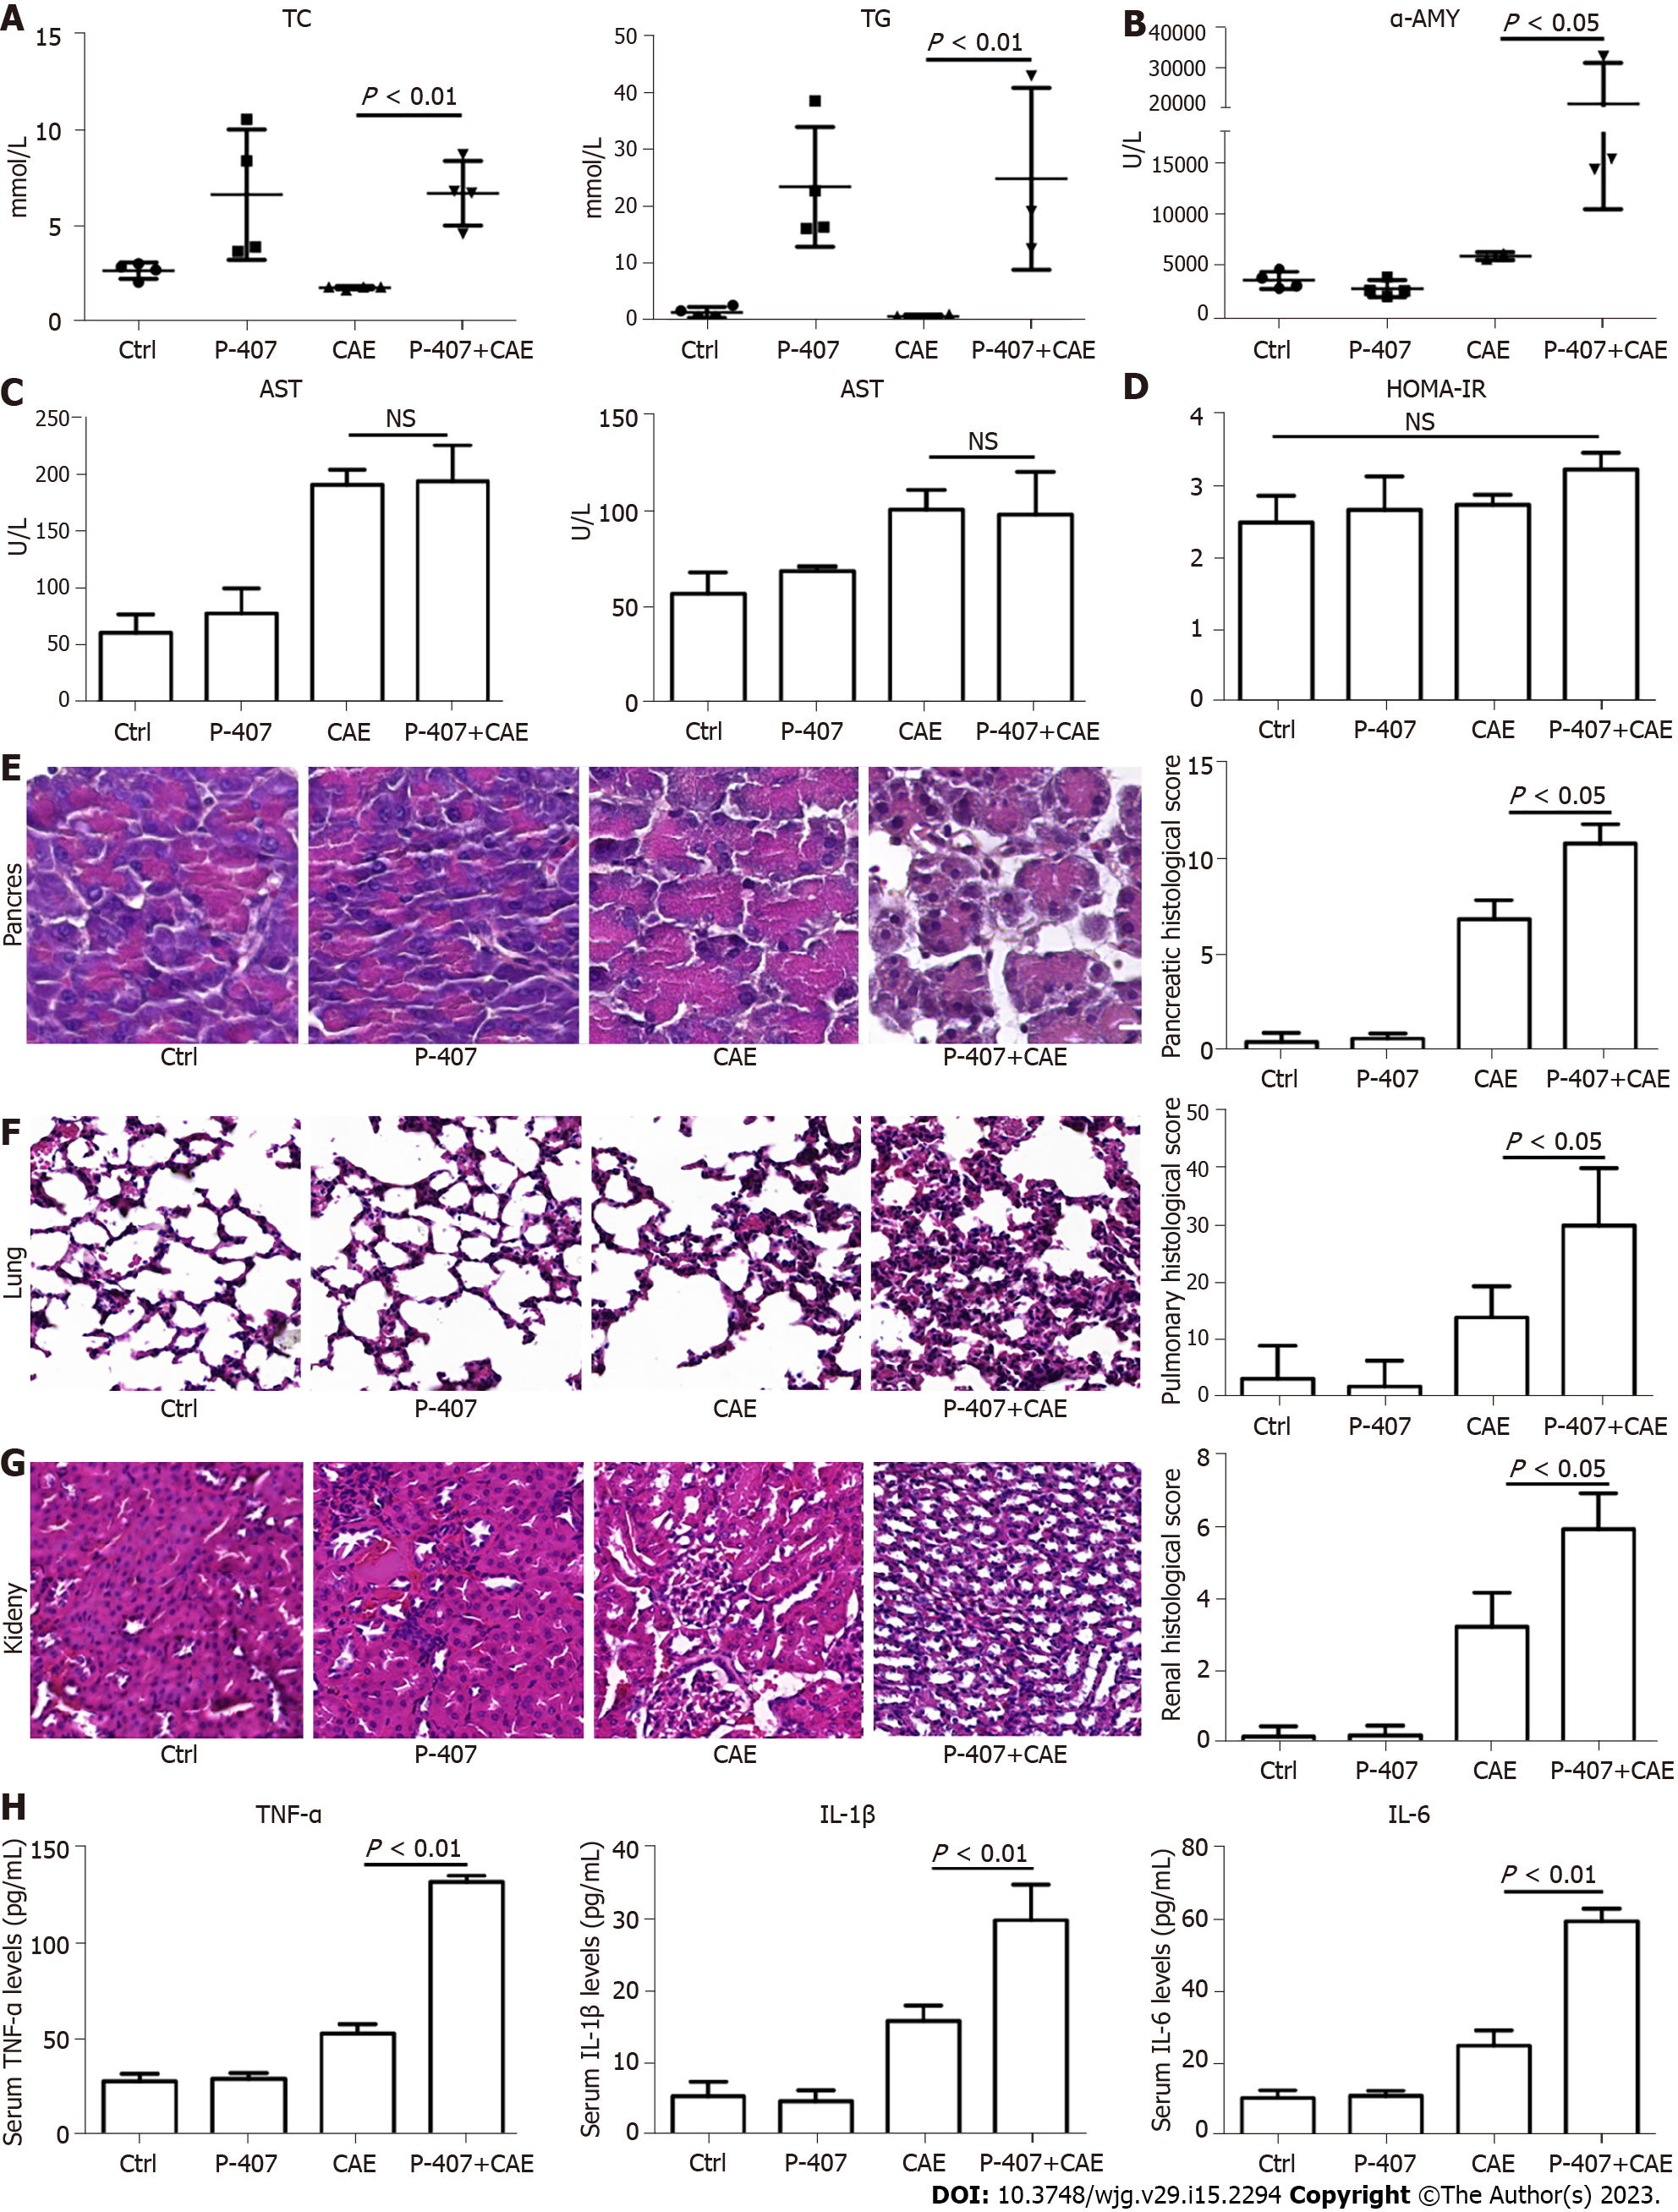
Figure 1 P-407 and caerulein-induced hypertriglyceridemic pancreatitis in mice (n = 4).
A: Serum total cholesterol and triglyceride levels; B: Serum amylase; C: Alanine aminotransferase and Alanine aminotransferase levels; D: Homeostasis model assessment insulin resistance index levels in mice exposed to P-407 and caerulein (CAE); E: Hematoxylin–eosin (HE) staining and histological scores of the pancreas; F: HE staining and histological scores of the lung; G: HE staining and histological scores of the kidney; H: Serum Tumor necrosis factor-α, interleukin (IL)-1β, and IL-6 levels after P-407 and CAE exposure. AST: Aspartate transaminase; ALT: Alanine aminotransferase; HOMA-IR: Homeostasis model assessment insulin resistance index; HE: Hematoxylin–eosin; CAE: Caerulein; AMY: Amylase; TNF: Tumor necrosis factor; IL: Interleukin; NS: Not significant.
Figure 2 Effects of P-407 and caerulein on the pancreas revealed by proteome sequencing (n = 3).
A: Principal component analysis; B: Heatmap showing relationships among different sample groups; C: Exhibition of changed protein numbers among the sample groups; D: Volcano plots showing proteins differentially expressed between sample groups; E: Biological process; F: Kyoto Encyclopedia of Genes and Genomes pathways enriched with proteins differentially expressed in pair-wise comparisons of ‘CAE group’ vs WT group’’ and ‘P-407 + CAE group’ vs CAE group’. CAE: Caerulein; WT: Wide type; PC: Principal component.
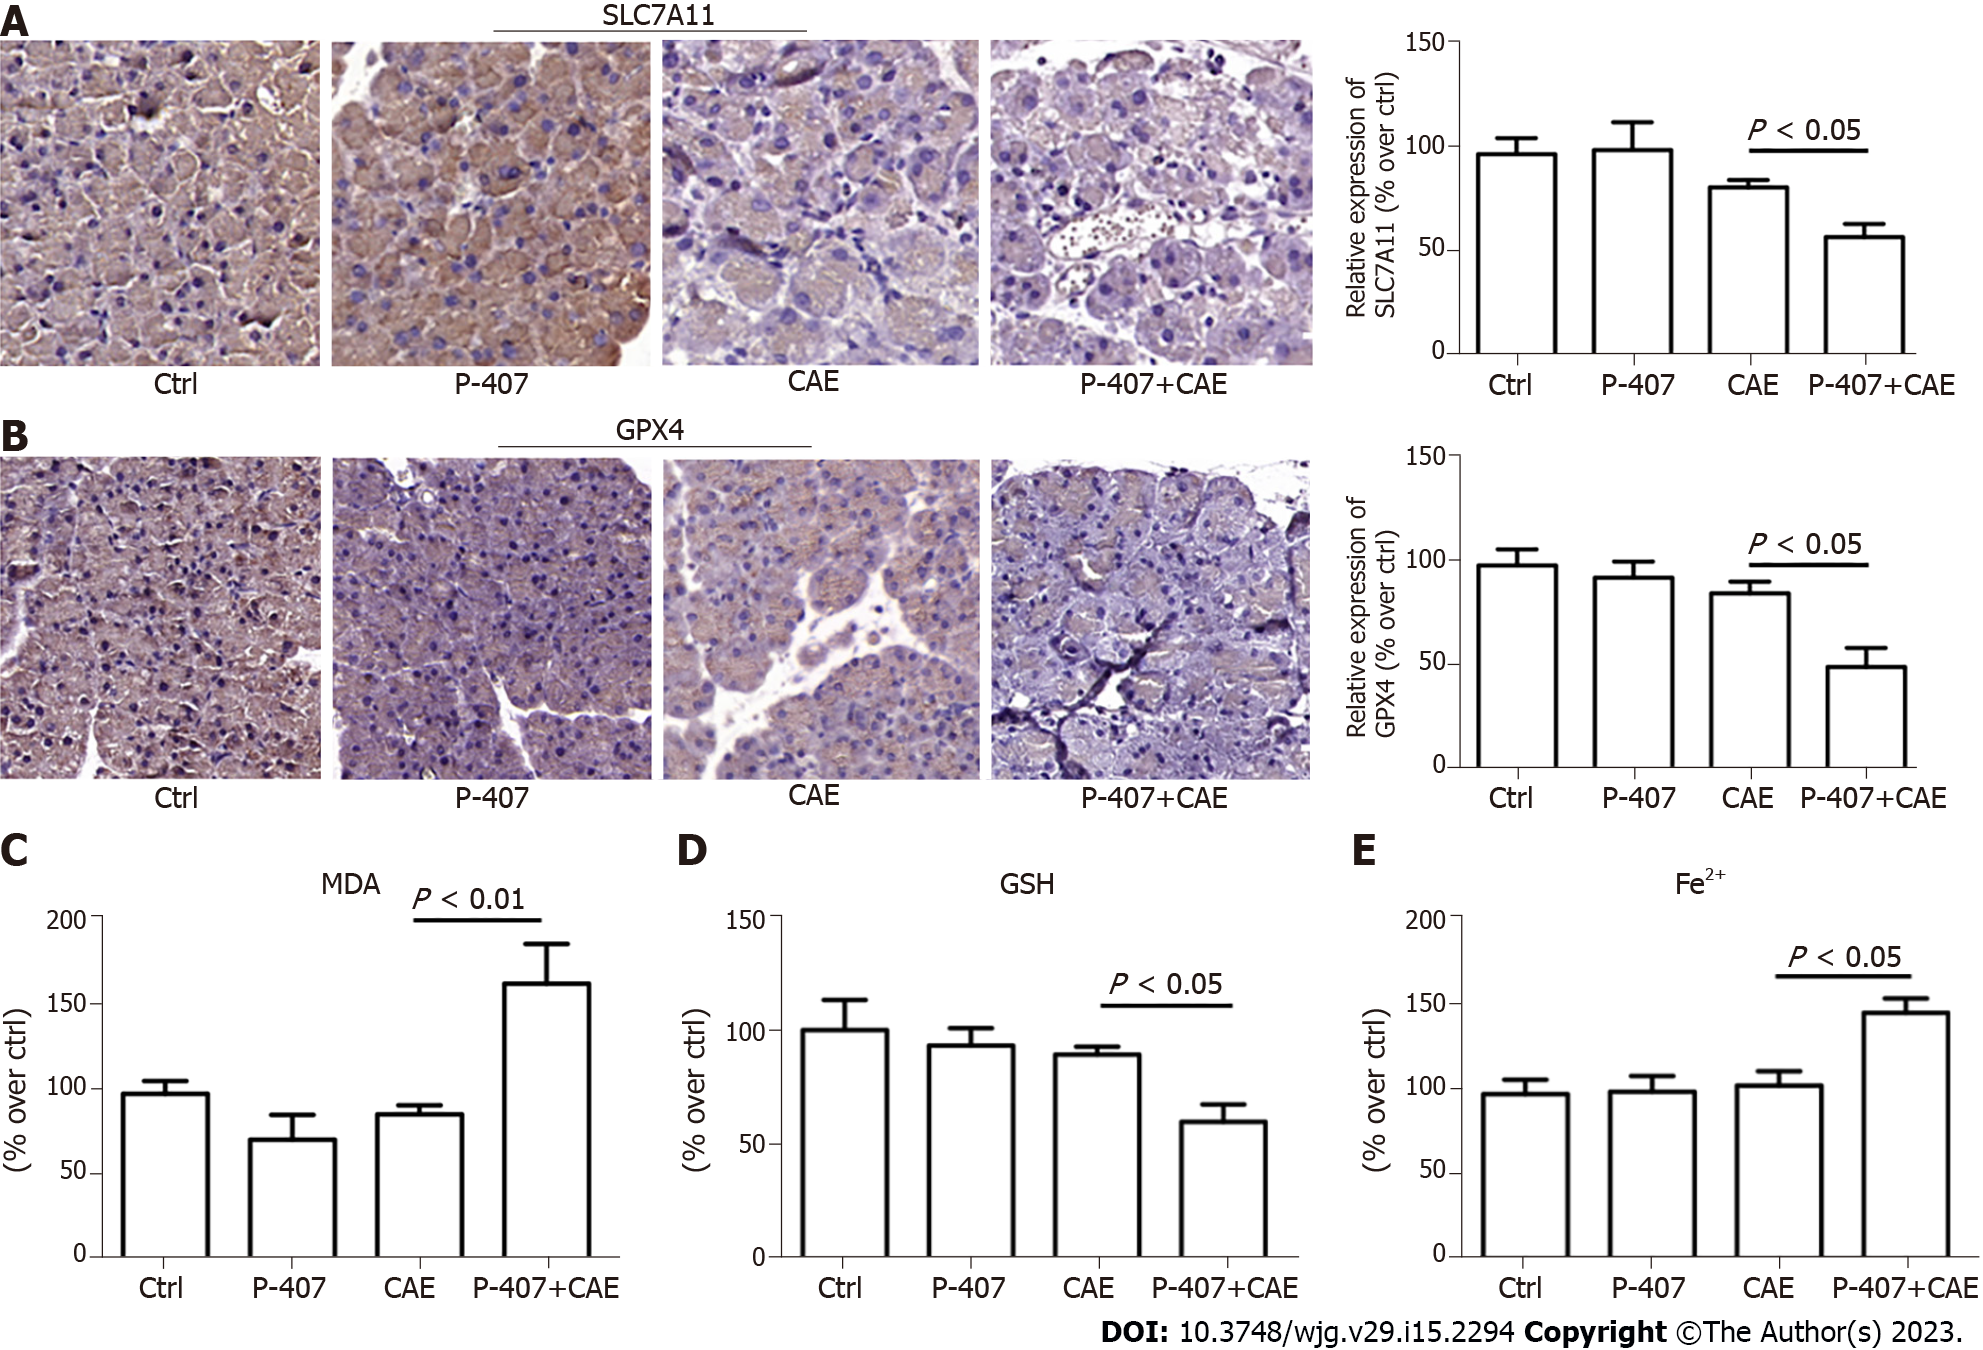
Figure 3 P-407 + Caerulein-induced pancreas ferroptosis in mice as established by immunohistochemistry (n = 4).
A: Solute carrier family 7 member 11 in the pancreas tissues of the P-407 + Caerulein (CAE) group; B: Glutathione peroxidase 4 in the pancreas tissues of the P-407 + CAE group. The scale bar represents 50 mm; C: Malonaldehyde levels; D: Glutathione levels; E: Fe2+ levels in the pancreases of the mice in the P-407 + CAE group. CAE: Caerulein; SLC7A11: Solute carrier family 7 member 11; MDA: Malonaldehyde; GSH: Glutathione; GPX4: Glutathione peroxidase 4.
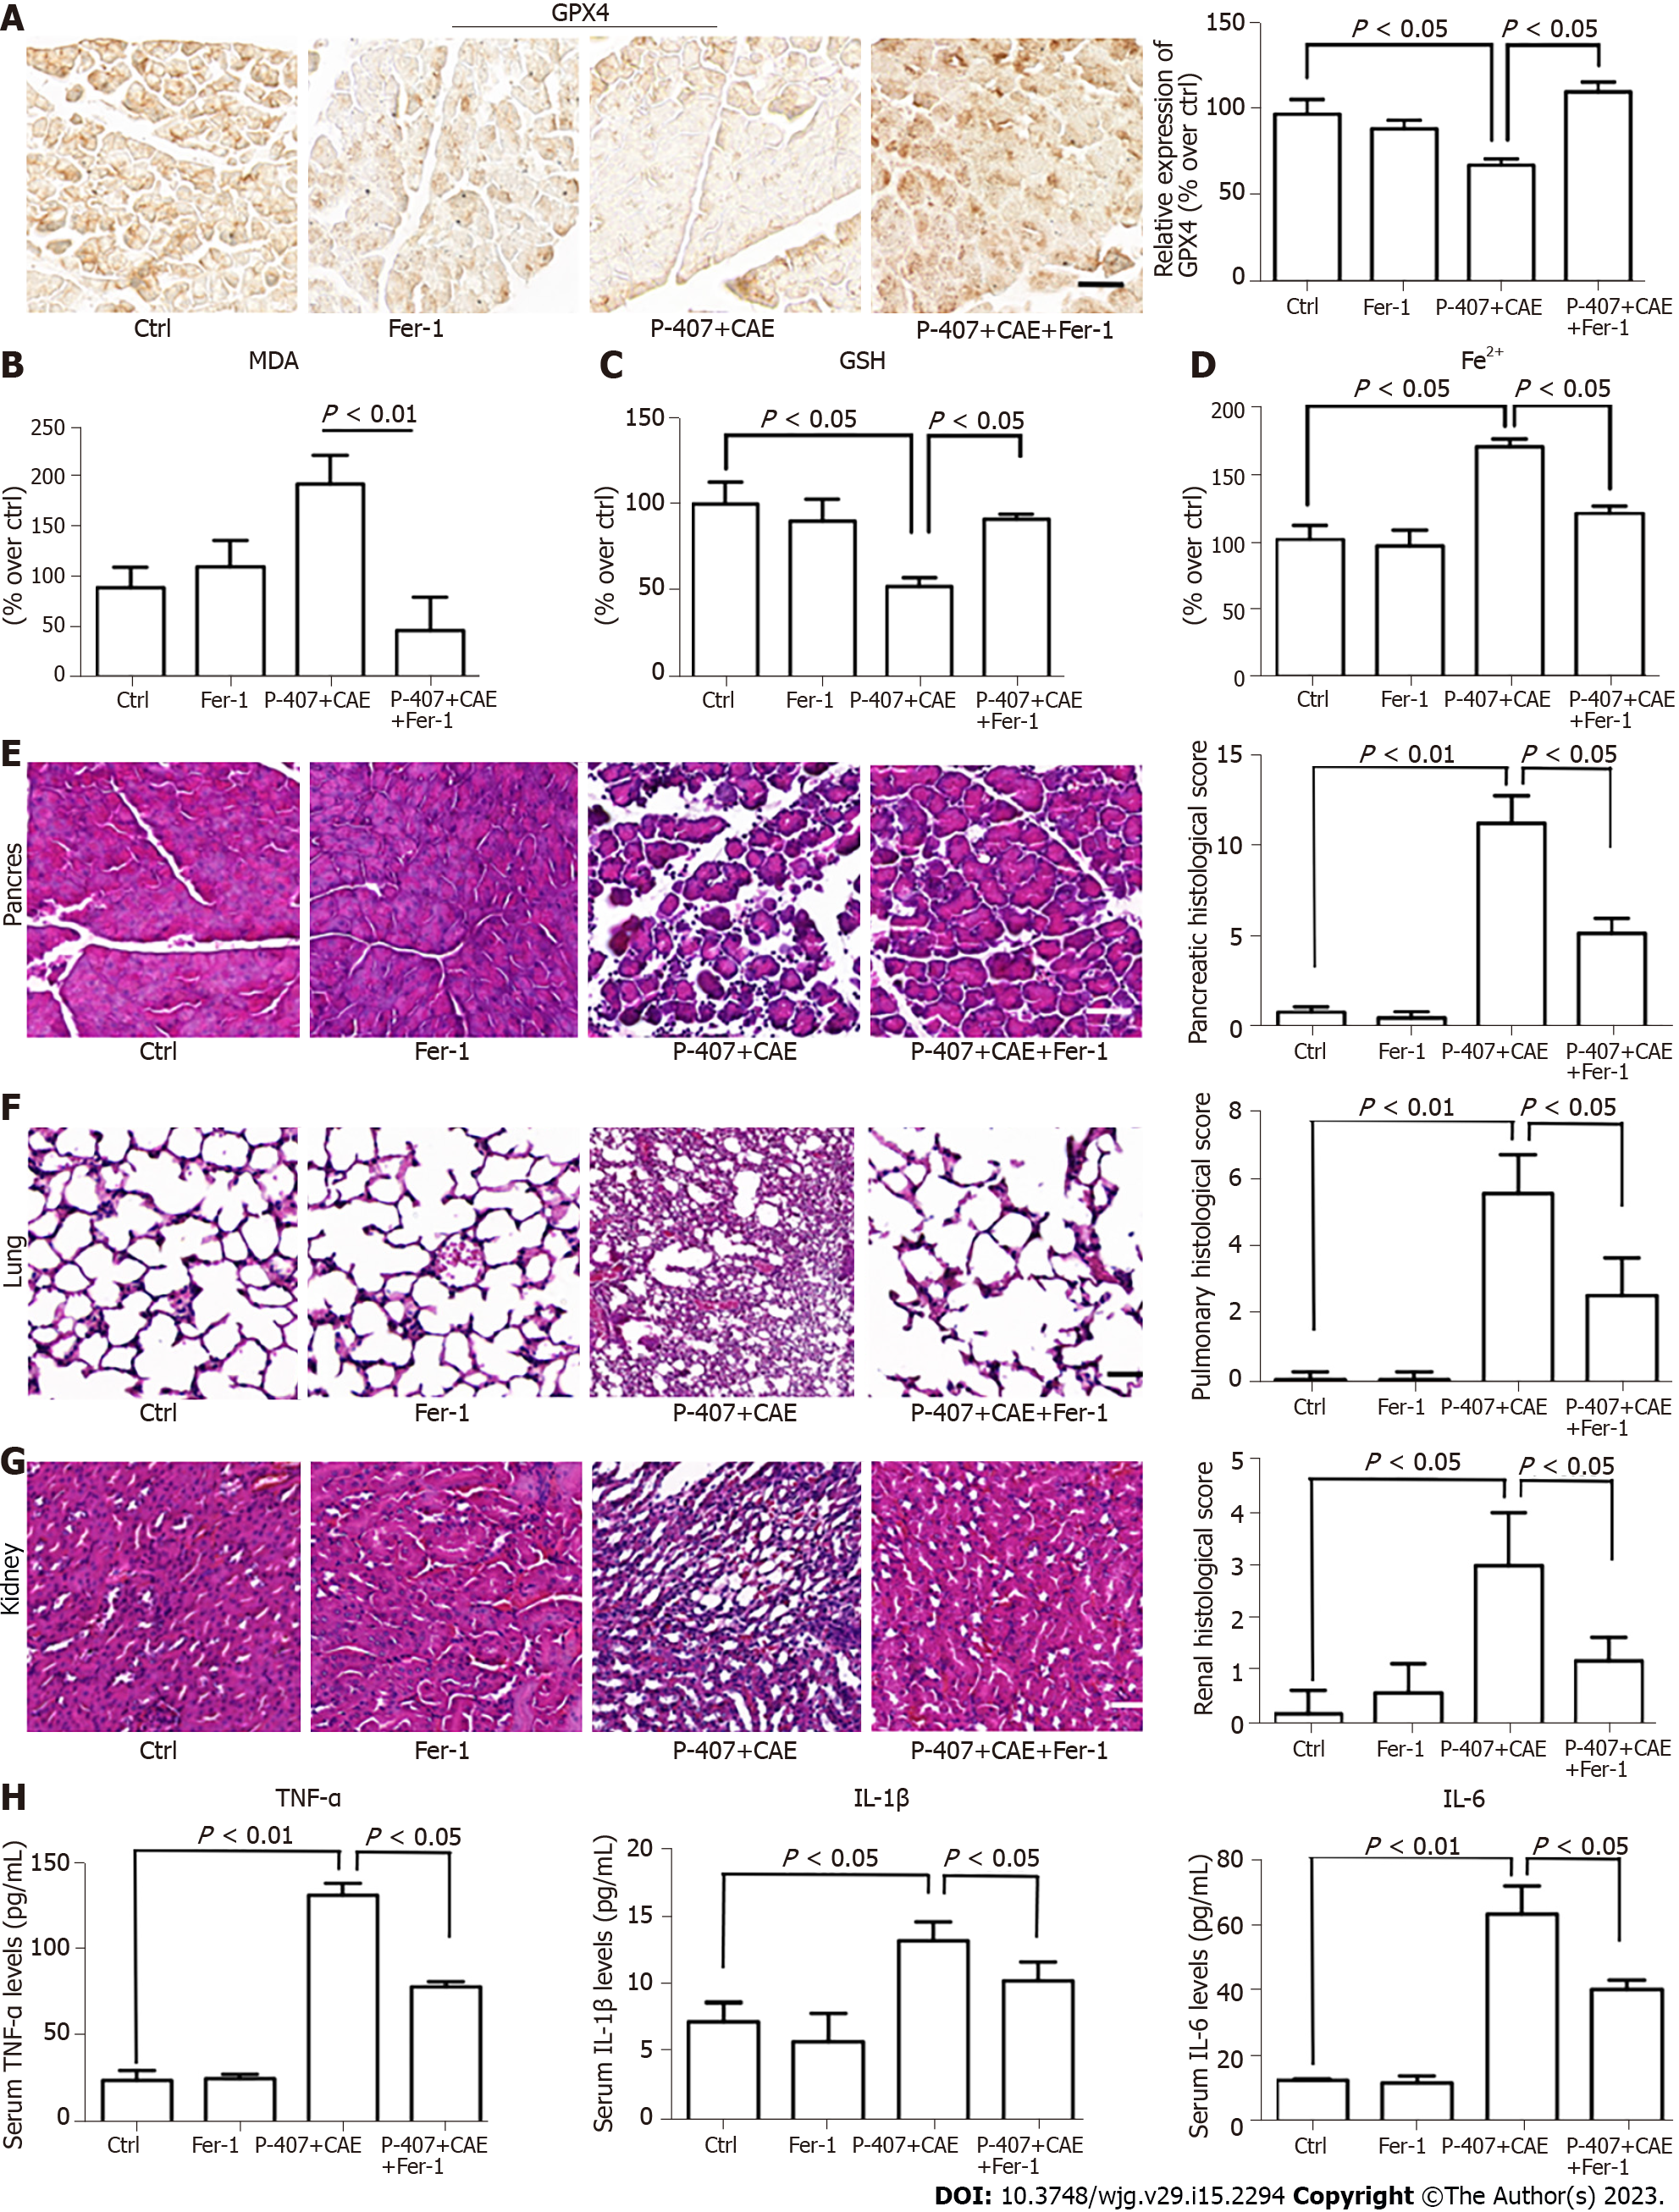
Figure 4 The inhibition of ferroptosis attenuated P-407 + Caerulein-induced hypertriglyceridemic pancreatitis in mice (n = 4).
A: Immunohistochemistry for Glutathione peroxidase 4 in the pancreas tissues of the P-407 + Caerulein (CAE) and P-407 + CAE + Ferrostatin-1 (Fer-1) groups; B: The malonaldehyde levels; C: The glutathione levels; D: Fe2+ levels in pancreases of P-407 + CAE and P-407 + CAE + Fer-1 groups; E: Hematoxylin–eosin (HE) staining and histological scores of the pancreas; F: HE staining and histological scores of the lung; G: HE staining and histological scores of the kidney; H: Serum tumor necrosis factor-α, interleukin (IL)-1β, and IL-6 levels of the P-407 + CAE and P-407 + CAE + Fer-1 groups. NOX: NADPH oxidase; ROS: Reactive oxygen species; CAE: Caerulein; MDA: Malonaldehyde; Fer-1: Ferrostatin-1; GSH: Glutathione; GPX4: Glutathione peroxidase 4; TNF: Tumor necrosis factor; IL: Interleukin.
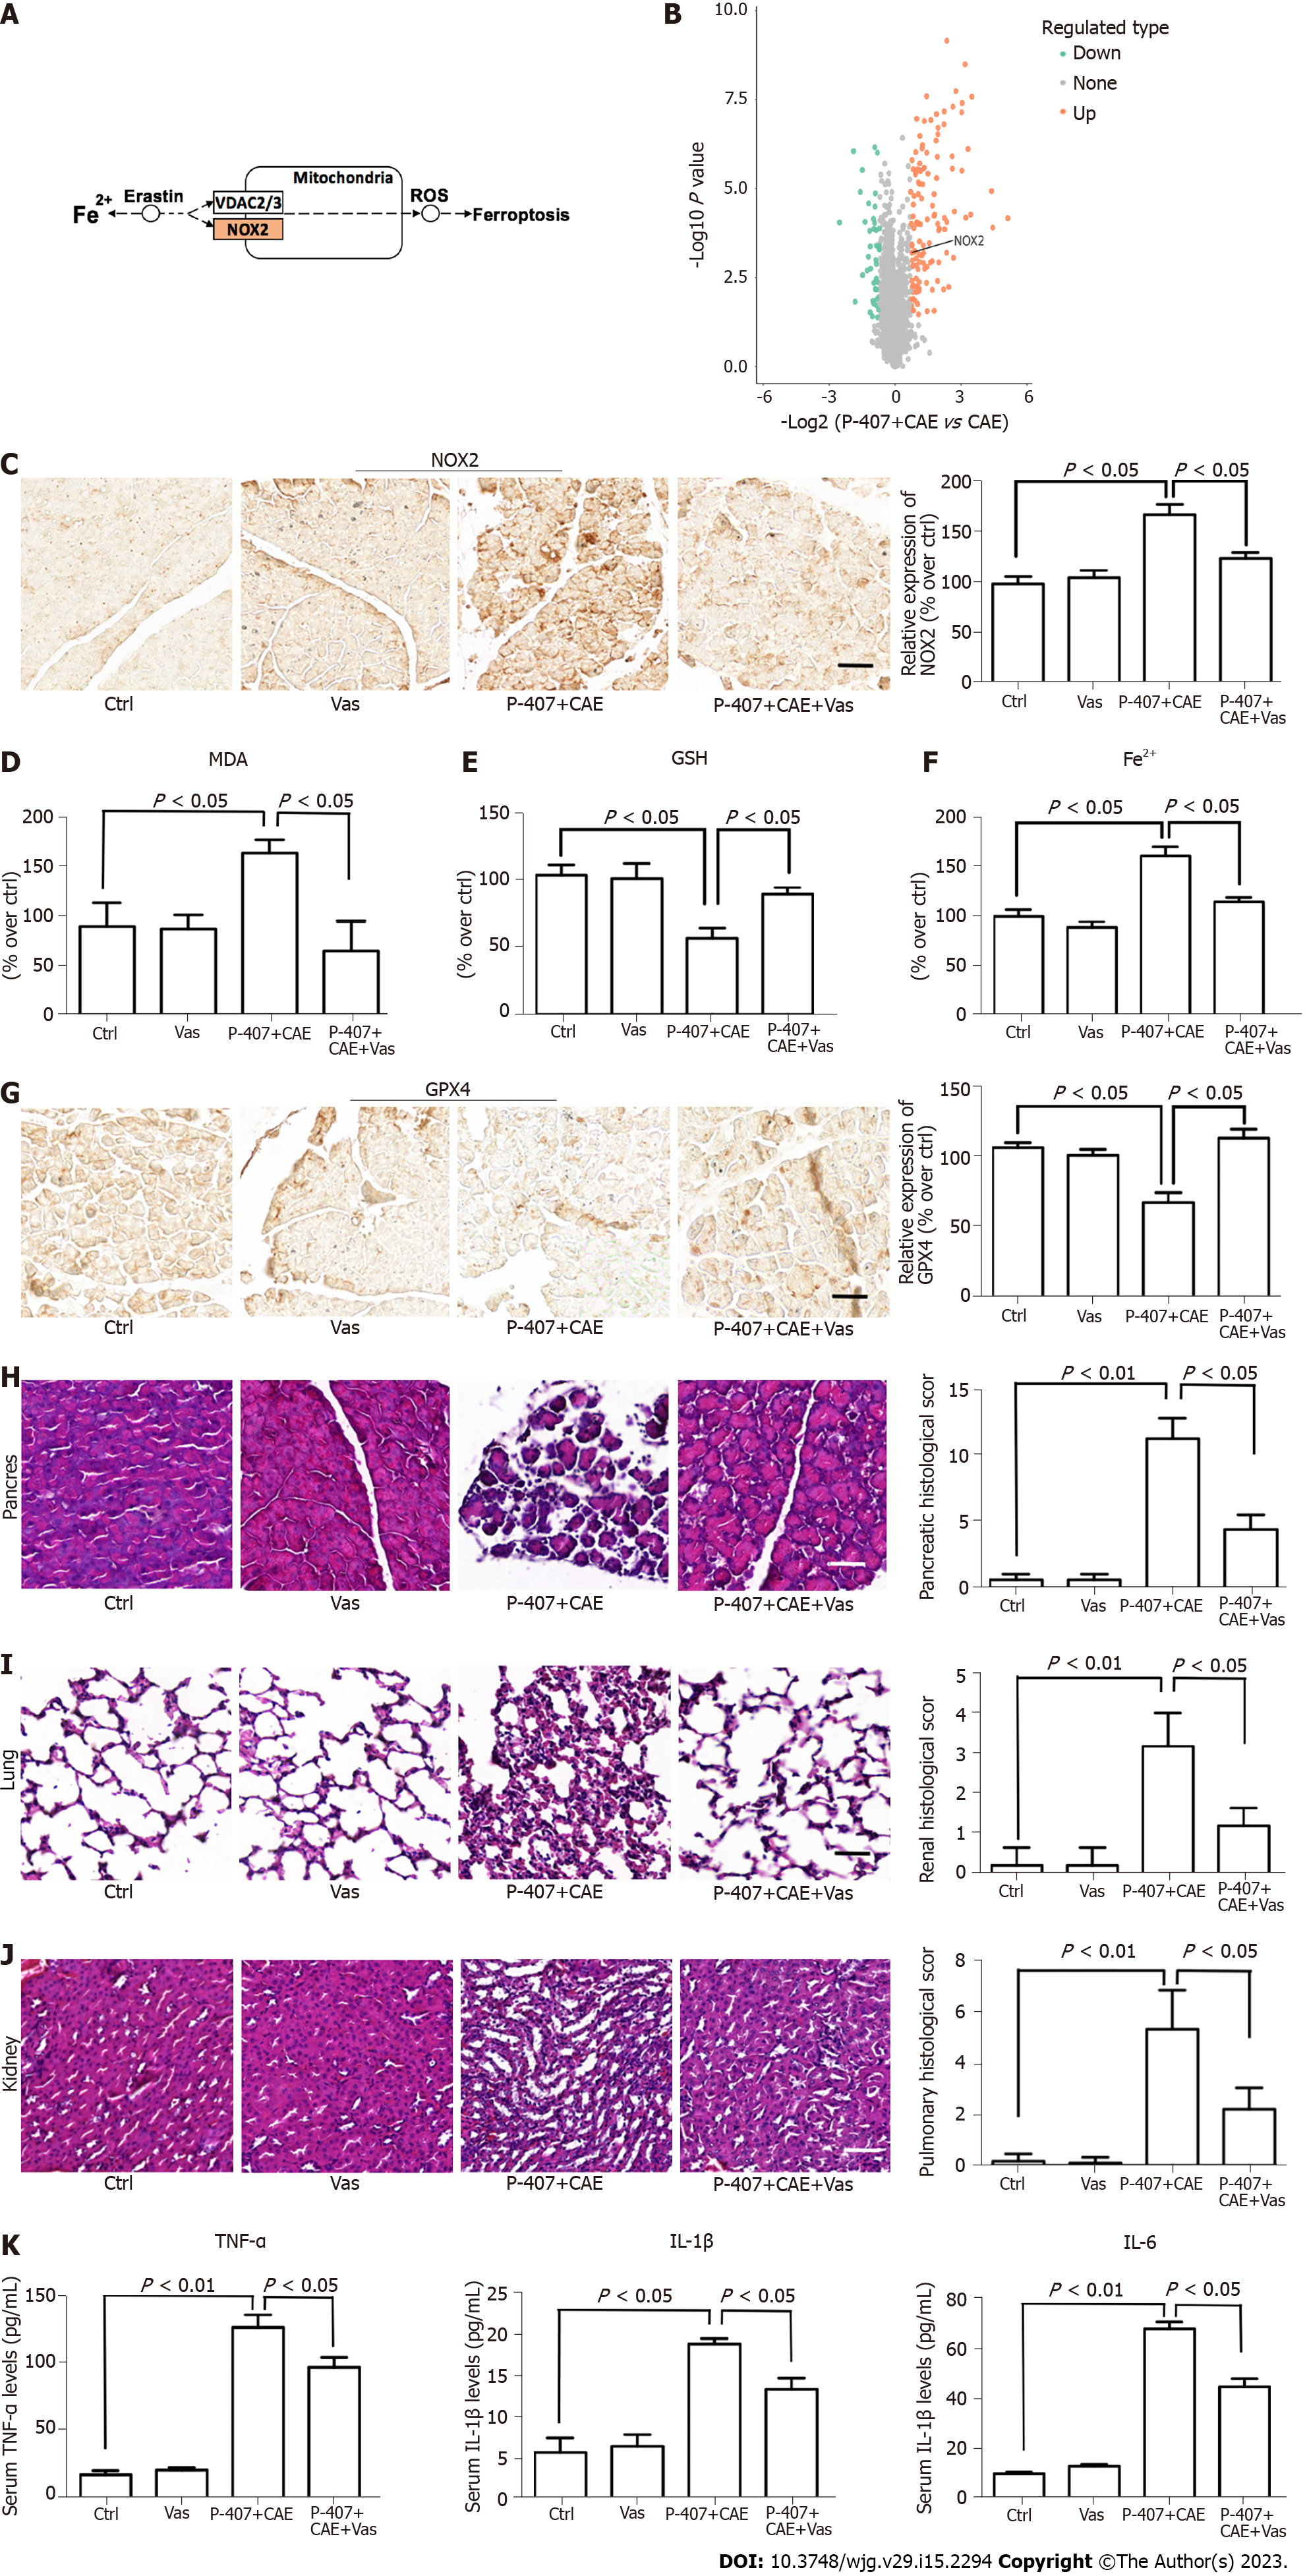
Figure 5 The inhibition of NADPH oxidase 2 attenuated hypertriglyceridemic pancreatitis through a ferroptosis reduction in mice (n = 4).
A: Kyoto Encyclopedia of Genes and Genomes pathways enriched with protein NADPH oxidase (NOX) 2 in comparison of P-407 + caerulein (CAE) group vs CAE group; B: Volcano plot showing the location of NOX2 in comparison of P-407 + CAE group vs CAE group; C: Immunohistochemistry (IHC) for NOX2 in the pancreas tissues of the P-407 + CAE and P-407 + CAE + Vas2870 (Vas) groups; D: The malonaldehyde levels; E: The glutathione levels; F: Fe2+ levels in the pancreases of the mice in the P-407 + CAE and P-407 + CAE + Vas groups; G: IHC for GPX4 in the pancreas tissues of the P-407 + CAE and P-407 + CAE + Vas groups; H: Hematoxylin–eosin (HE) staining and histological scores of the pancreas; I: HE staining and histological scores of the lung; J: HE staining and histological scores of the kidney; K: Serum TNF-α, IL-1β, and IL-6 levels of the P-407 + CAE and P-407 + CAE + Vas groups. The scale bar represents 50 mm. NOX: NADPH oxidase; ROS: Reactive oxygen species; CAE: Caerulein; Vas: Vas2870; MDA: Malonaldehyde; GSH: Glutathione; GPX4: Glutathione peroxidase 4; TNF: Tumor necrosis factor; IL: Interleukin.
- Citation: Meng YT, Zhou Y, Han PY, Ren HB. Ferroptosis inhibition attenuates inflammatory response in mice with acute hypertriglyceridemic pancreatitis. World J Gastroenterol 2023; 29(15): 2294-2309
- URL: https://www.wjgnet.com/1007-9327/full/v29/i15/2294.htm
- DOI: https://dx.doi.org/10.3748/wjg.v29.i15.2294


