Copyright
©The Author(s) 2022.
World J Gastroenterol. Oct 14, 2022; 28(38): 5636-5647
Published online Oct 14, 2022. doi: 10.3748/wjg.v28.i38.5636
Published online Oct 14, 2022. doi: 10.3748/wjg.v28.i38.5636
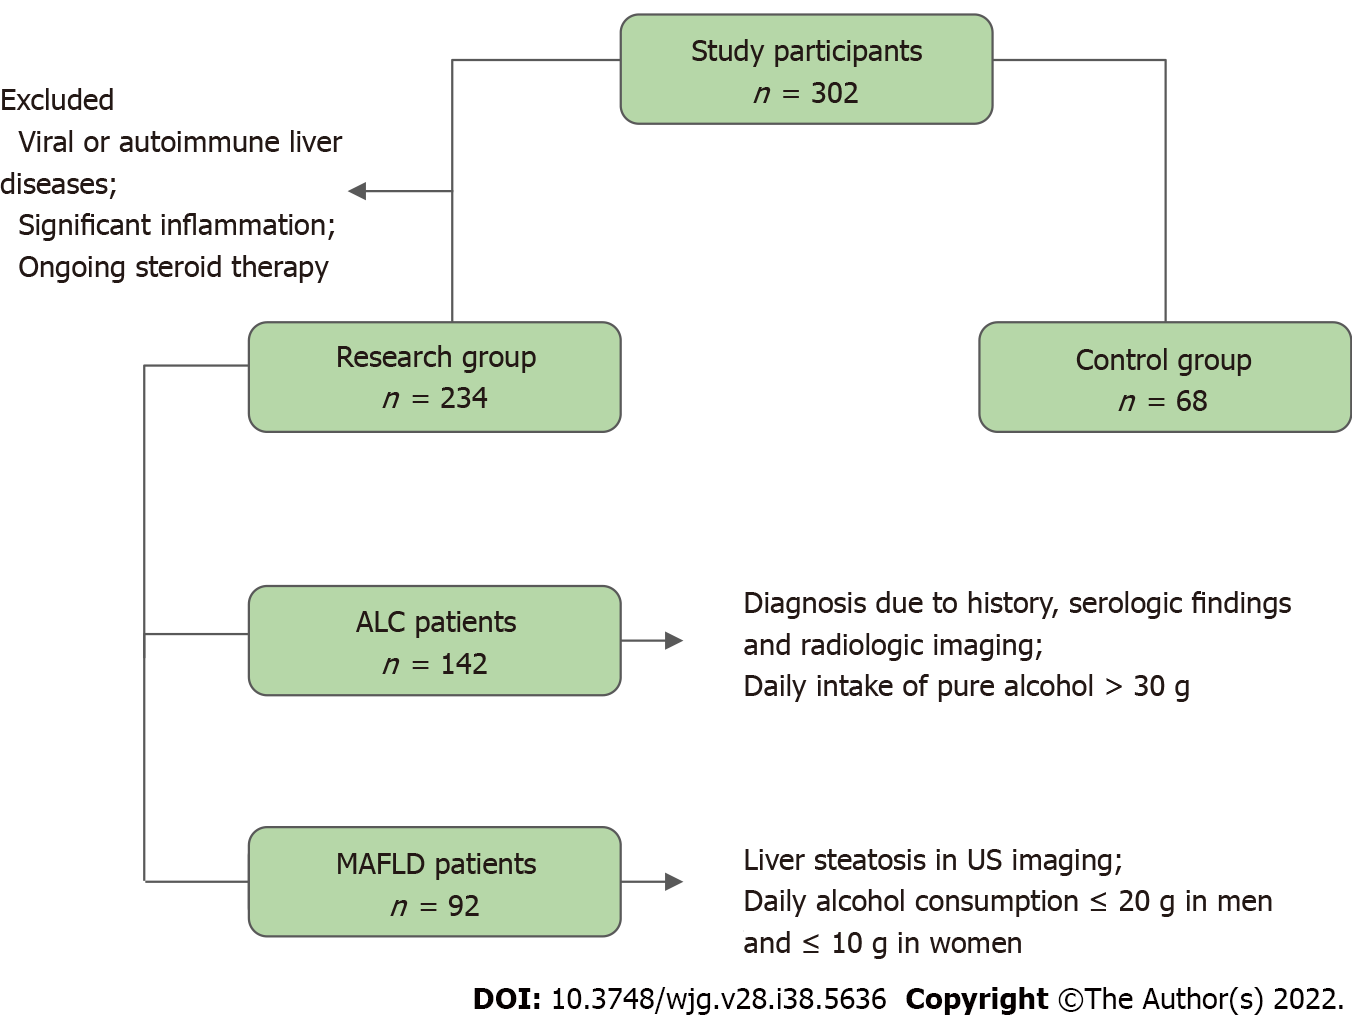
Figure 1 Flow chart demonstrating the selection of study participants.
ALC: Alcohol-related liver cirrhosis; MAFLD: Metabolic-associated fatty liver disease; US: Ultrasound.
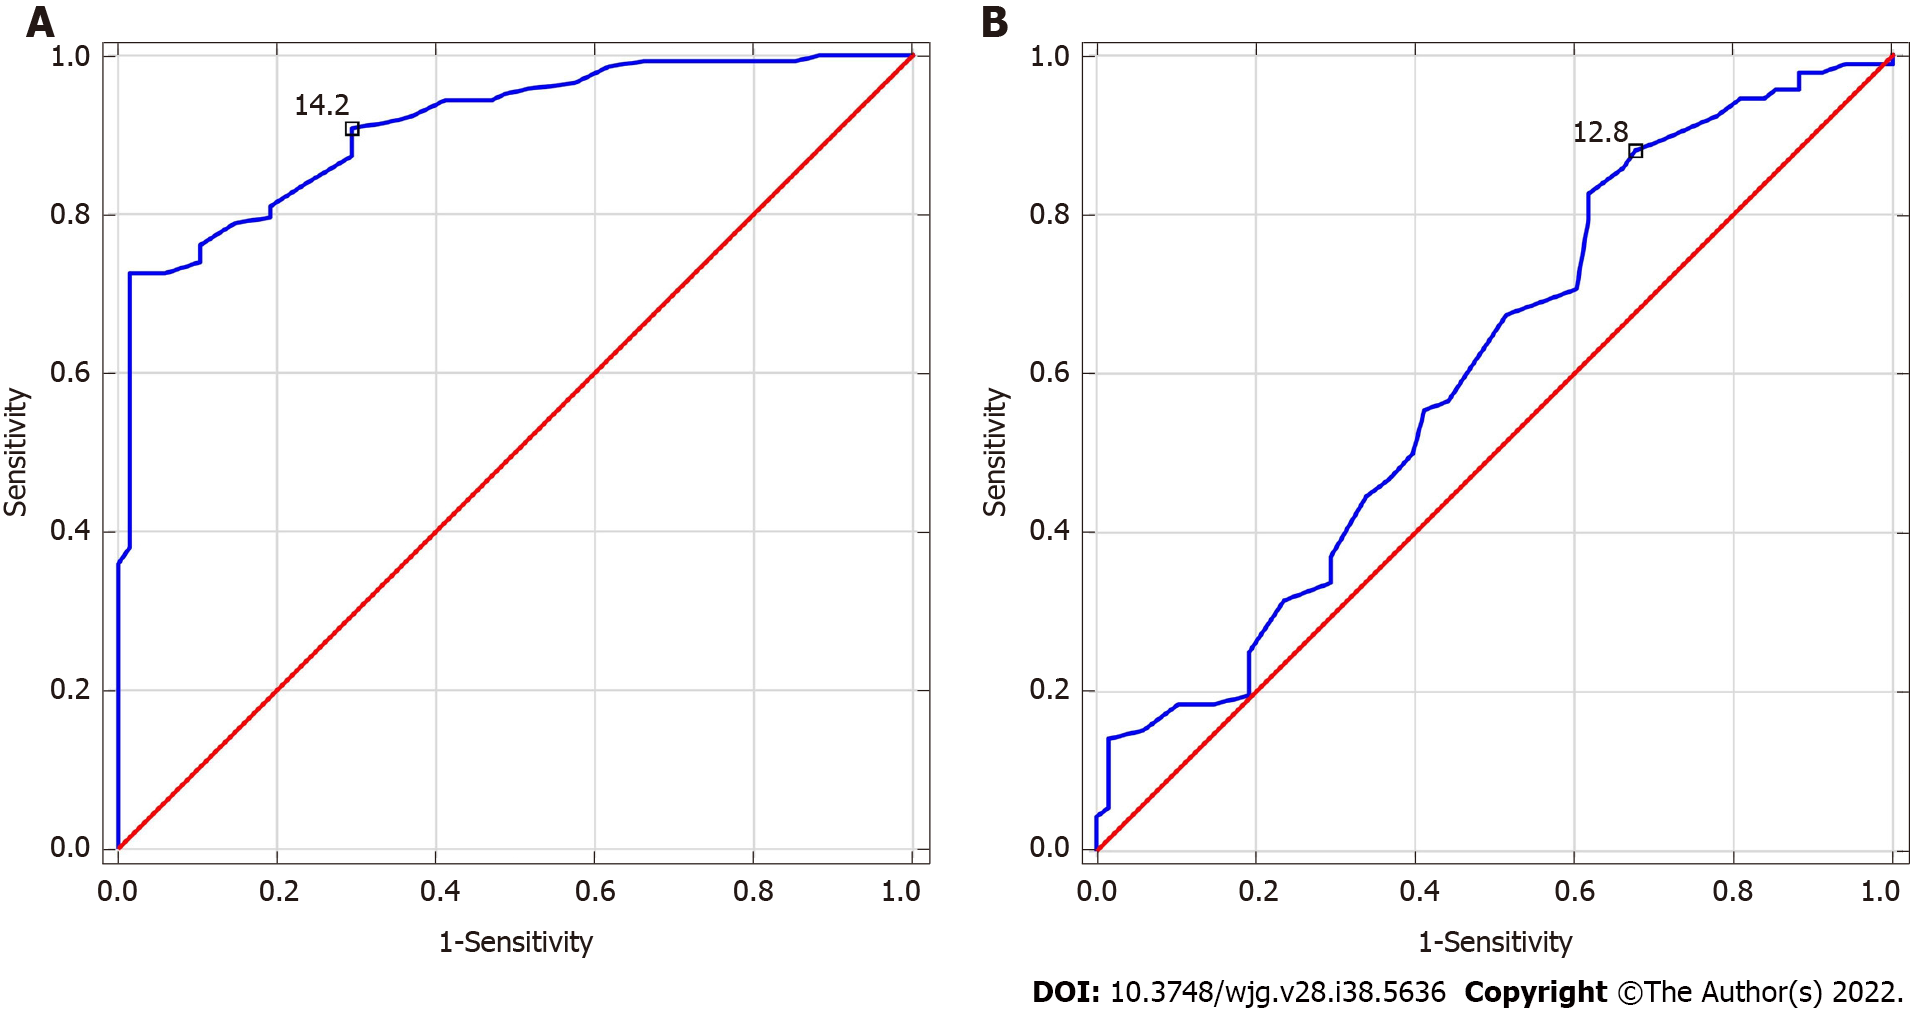
Figure 2 Receiver operating characteristics for red blood cell distribution width.
A: Alcohol-related liver cirrhosis (ALC), area under the curve (AUC) = 0.912 (cut-off > 14.2%); B: Metabolic-associated fatty liver disease (MAFLD), AUC = 0.606 (cut-off > 12.8%). Youden index cut-off for red blood cell distribution width in ALC and MAFLD groups = 15.1% and 13%, respectively.
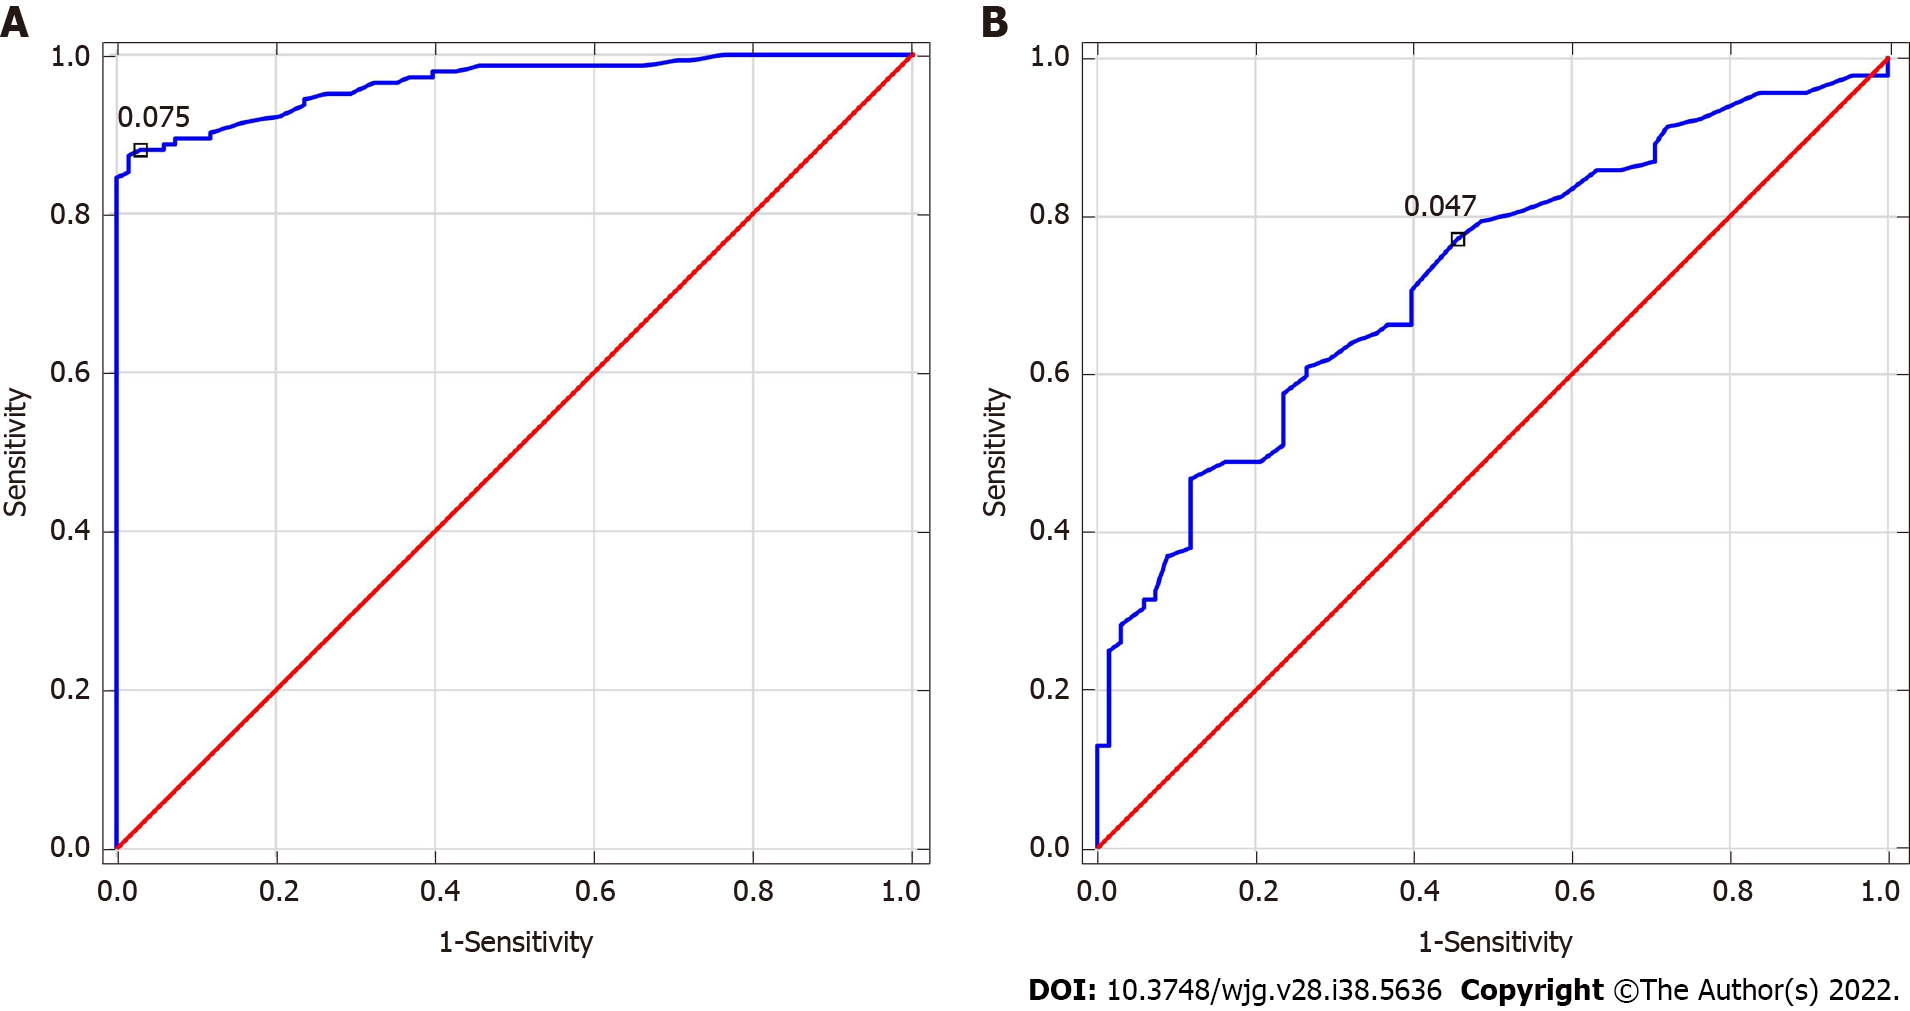
Figure 3 Receiver operating characteristics for red blood cell distribution width-to-platelet ratio.
A: Alcohol-related liver cirrhosis (ALC), area under the curve (AUC) = 0.965 (cut off > 0.075); B: Metabolic-associated fatty liver disease (MAFLD), AUC = 0.724 (cut-off > 0.047). Youden index cut-off for red blood cell distribution width-to-platelet ratio in ALC and MAFLD groups = 0.08 and 0.06, respectively.
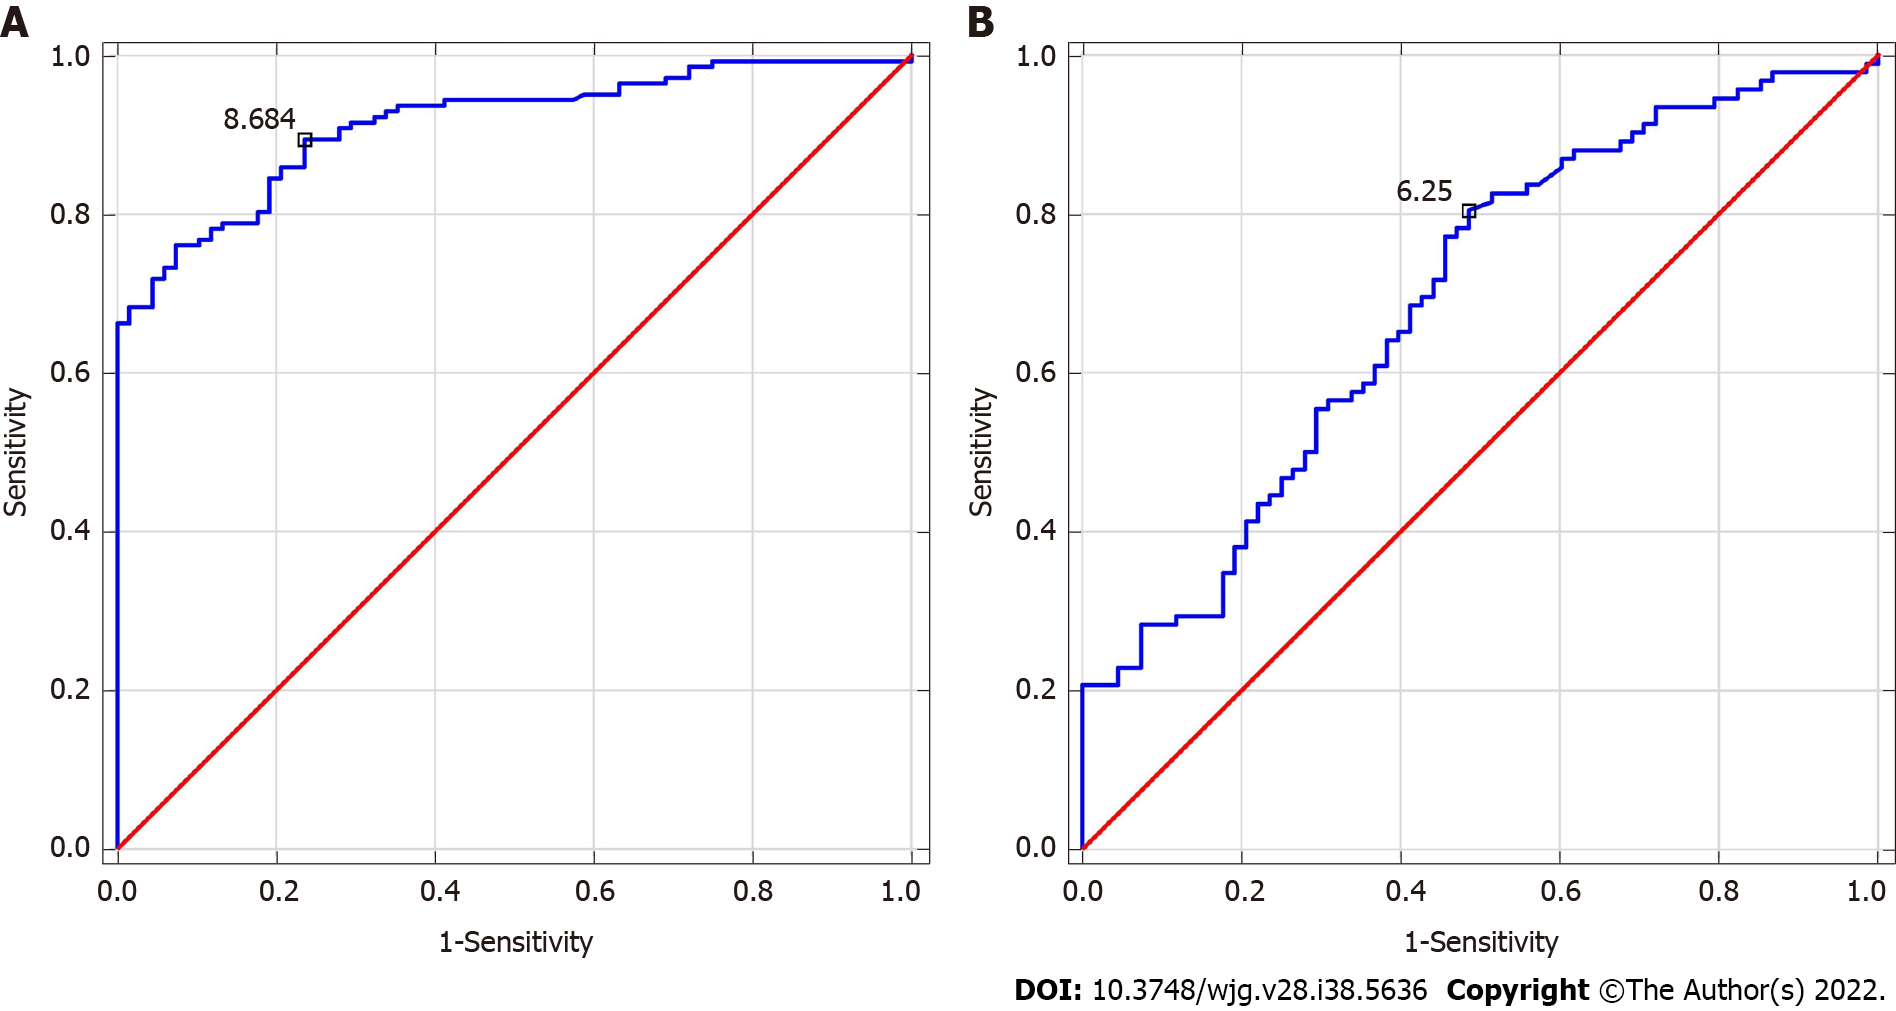
Figure 4 Receiver operating characteristics for red blood cell distribution width-to-lymphocyte ratio.
A: Alcohol-related liver cirrhosis (ALC), area under the curve (AUC) = 0.914 (cut-off > 8.684); B: Metabolic-associated fatty liver disease (MAFLD), AUC = 0.691 (cut-off > 6.25). Youden index cut-off for red blood cell distribution width-to-lymphocyte ratio in ALC and MAFLD groups = 11.16 and 6.25, respectively.
- Citation: Michalak A, Guz M, Kozicka J, Cybulski M, Jeleniewicz W, Lach T, Cichoż-Lach H. Red blood cell distribution width derivatives in alcohol-related liver cirrhosis and metabolic-associated fatty liver disease. World J Gastroenterol 2022; 28(38): 5636-5647
- URL: https://www.wjgnet.com/1007-9327/full/v28/i38/5636.htm
- DOI: https://dx.doi.org/10.3748/wjg.v28.i38.5636


