Copyright
©The Author(s) 2022.
World J Gastroenterol. Sep 21, 2022; 28(35): 5154-5174
Published online Sep 21, 2022. doi: 10.3748/wjg.v28.i35.5154
Published online Sep 21, 2022. doi: 10.3748/wjg.v28.i35.5154
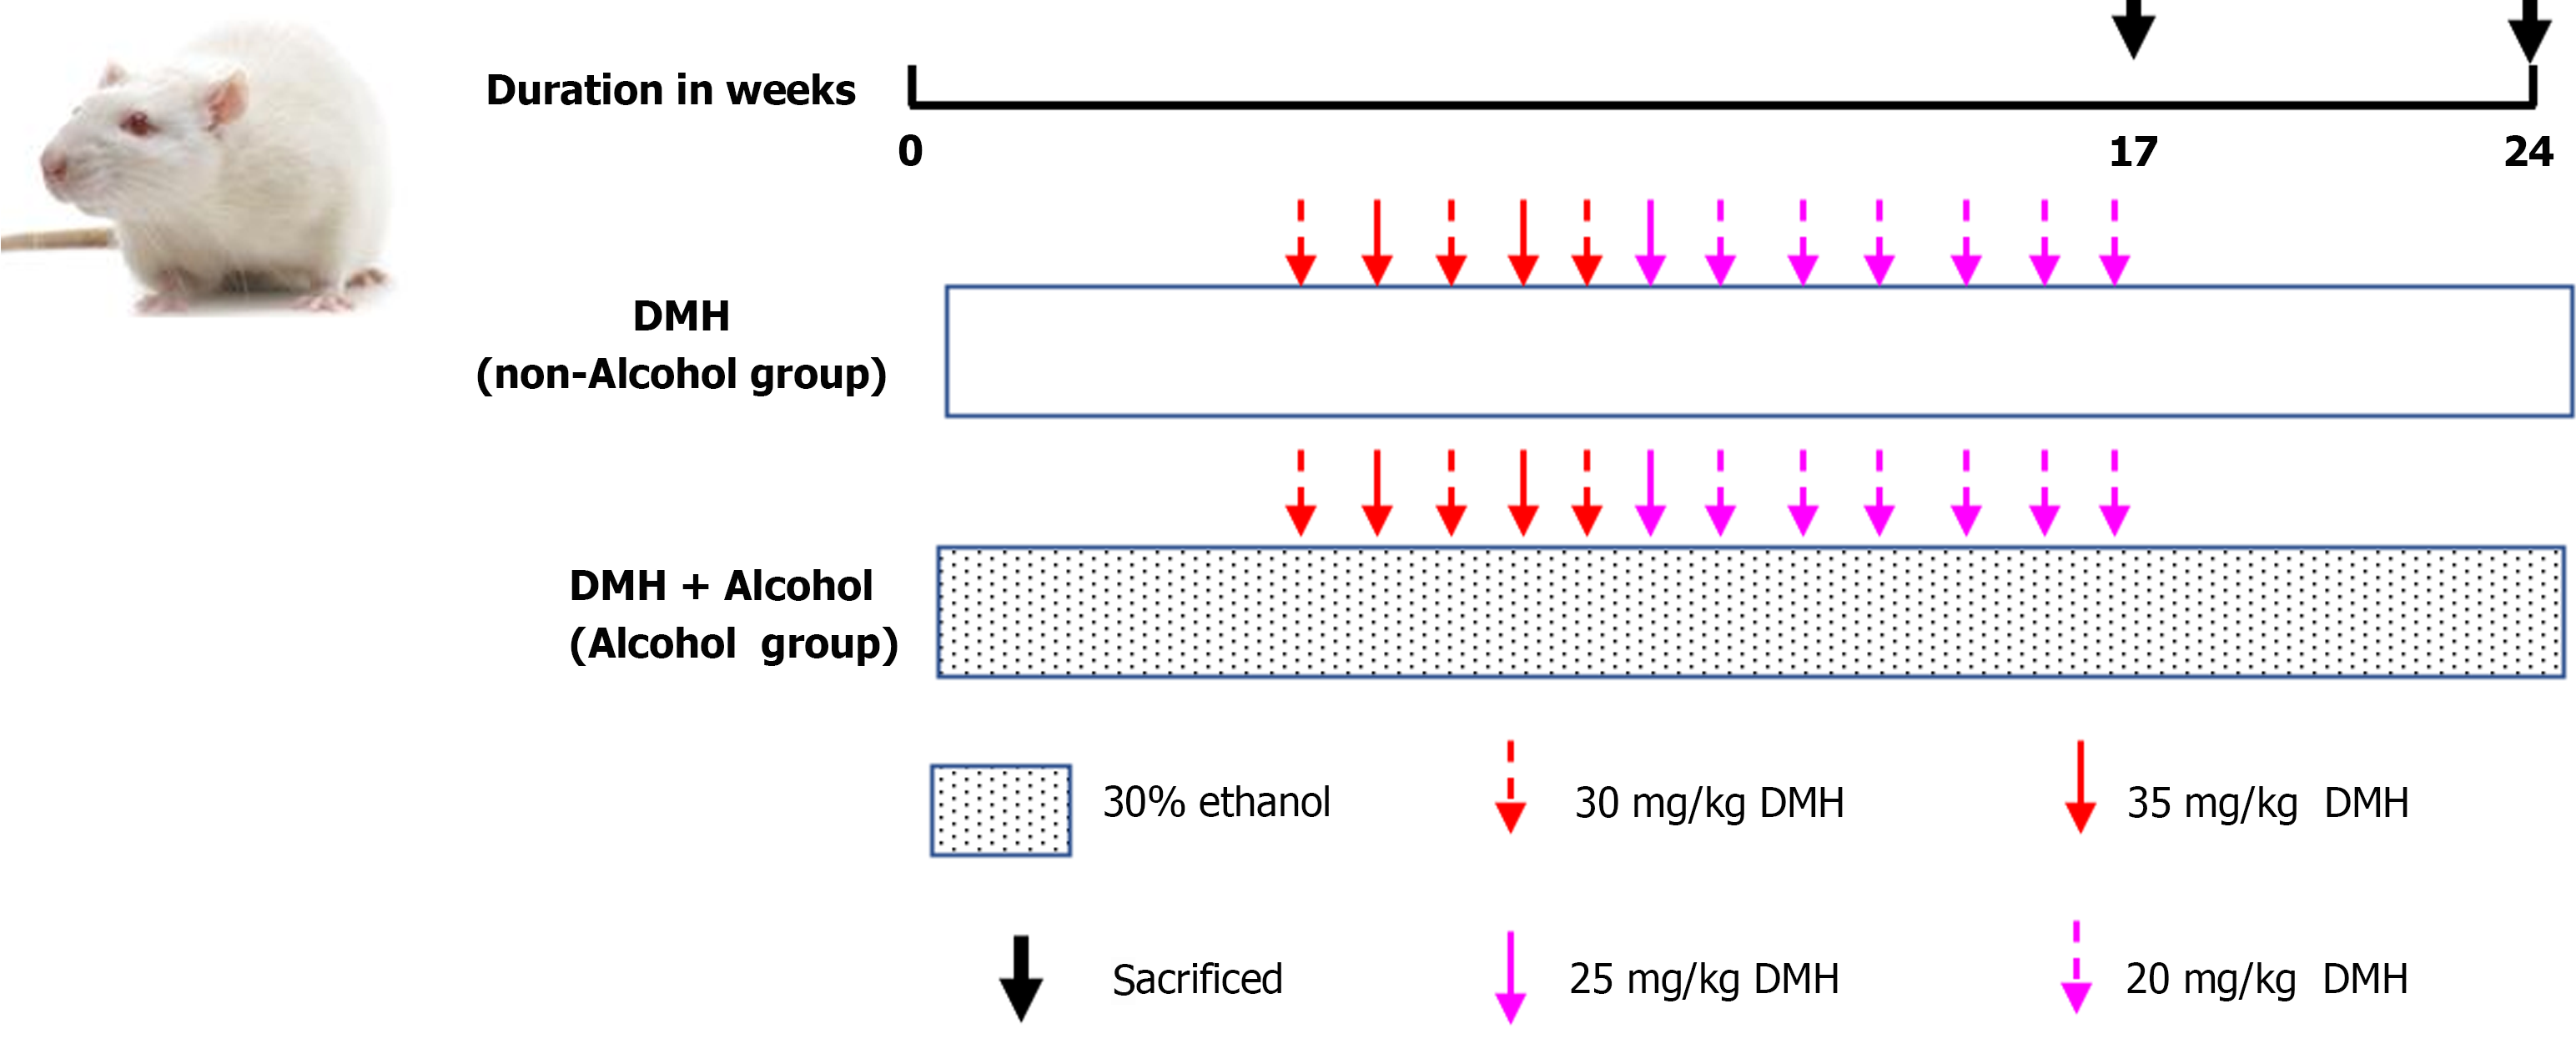
Figure 1 Schematic diagram of animal experimental modeling.
DMH: 1,2-Dimethylhydrazine hydrochloride.
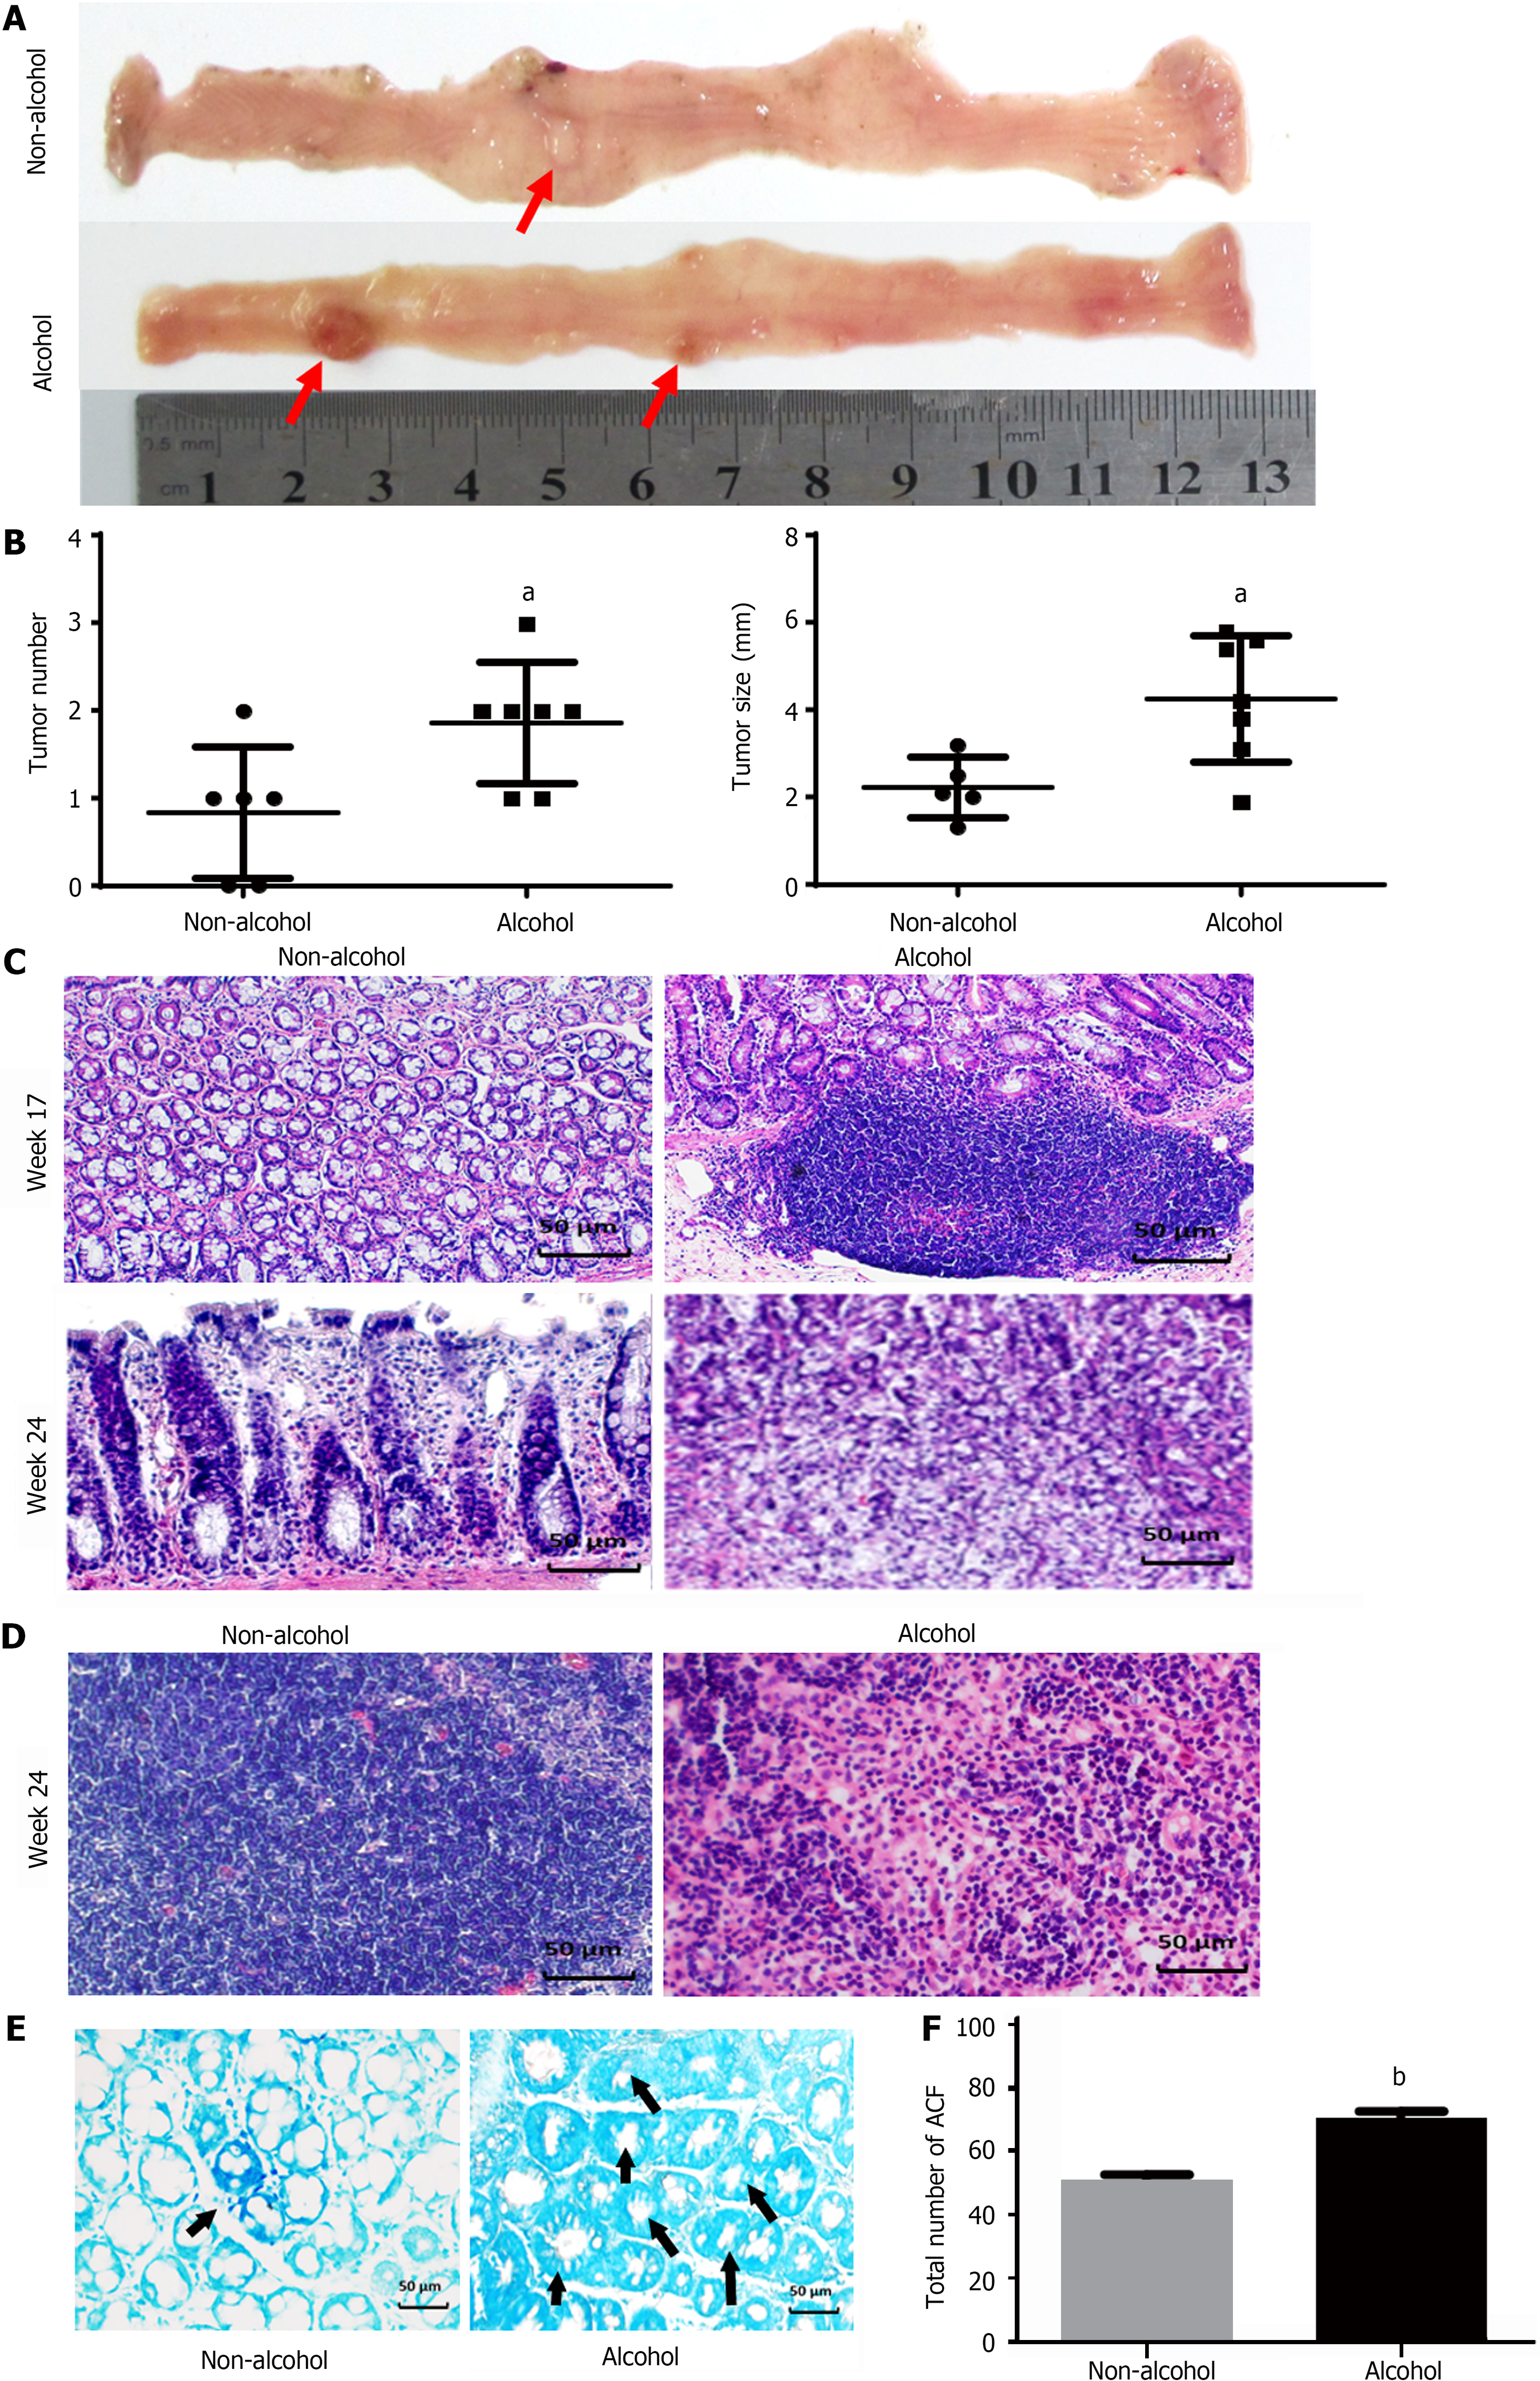
Figure 2 Alcohol consumption promotes colorectal cancer progression.
A: Morphological view of colonic tumors; B: Average tumor number and tumor size in each group; C: Colon pathology of different groups (× 400); D: Pathology of colonic lymph node in different groups at the 24th week (× 400); E: Methylene blue staining for aberrant crypt foci (ACF) in the sectioned rat colon (× 400); F: Bar graph of ACF with different crypt multiplicity. The bars represent the mean ± SD (n = 8). Compared with the non-alcohol group: bP < 0.01, aP < 0.05. ACF: Aberrant crypt foci.
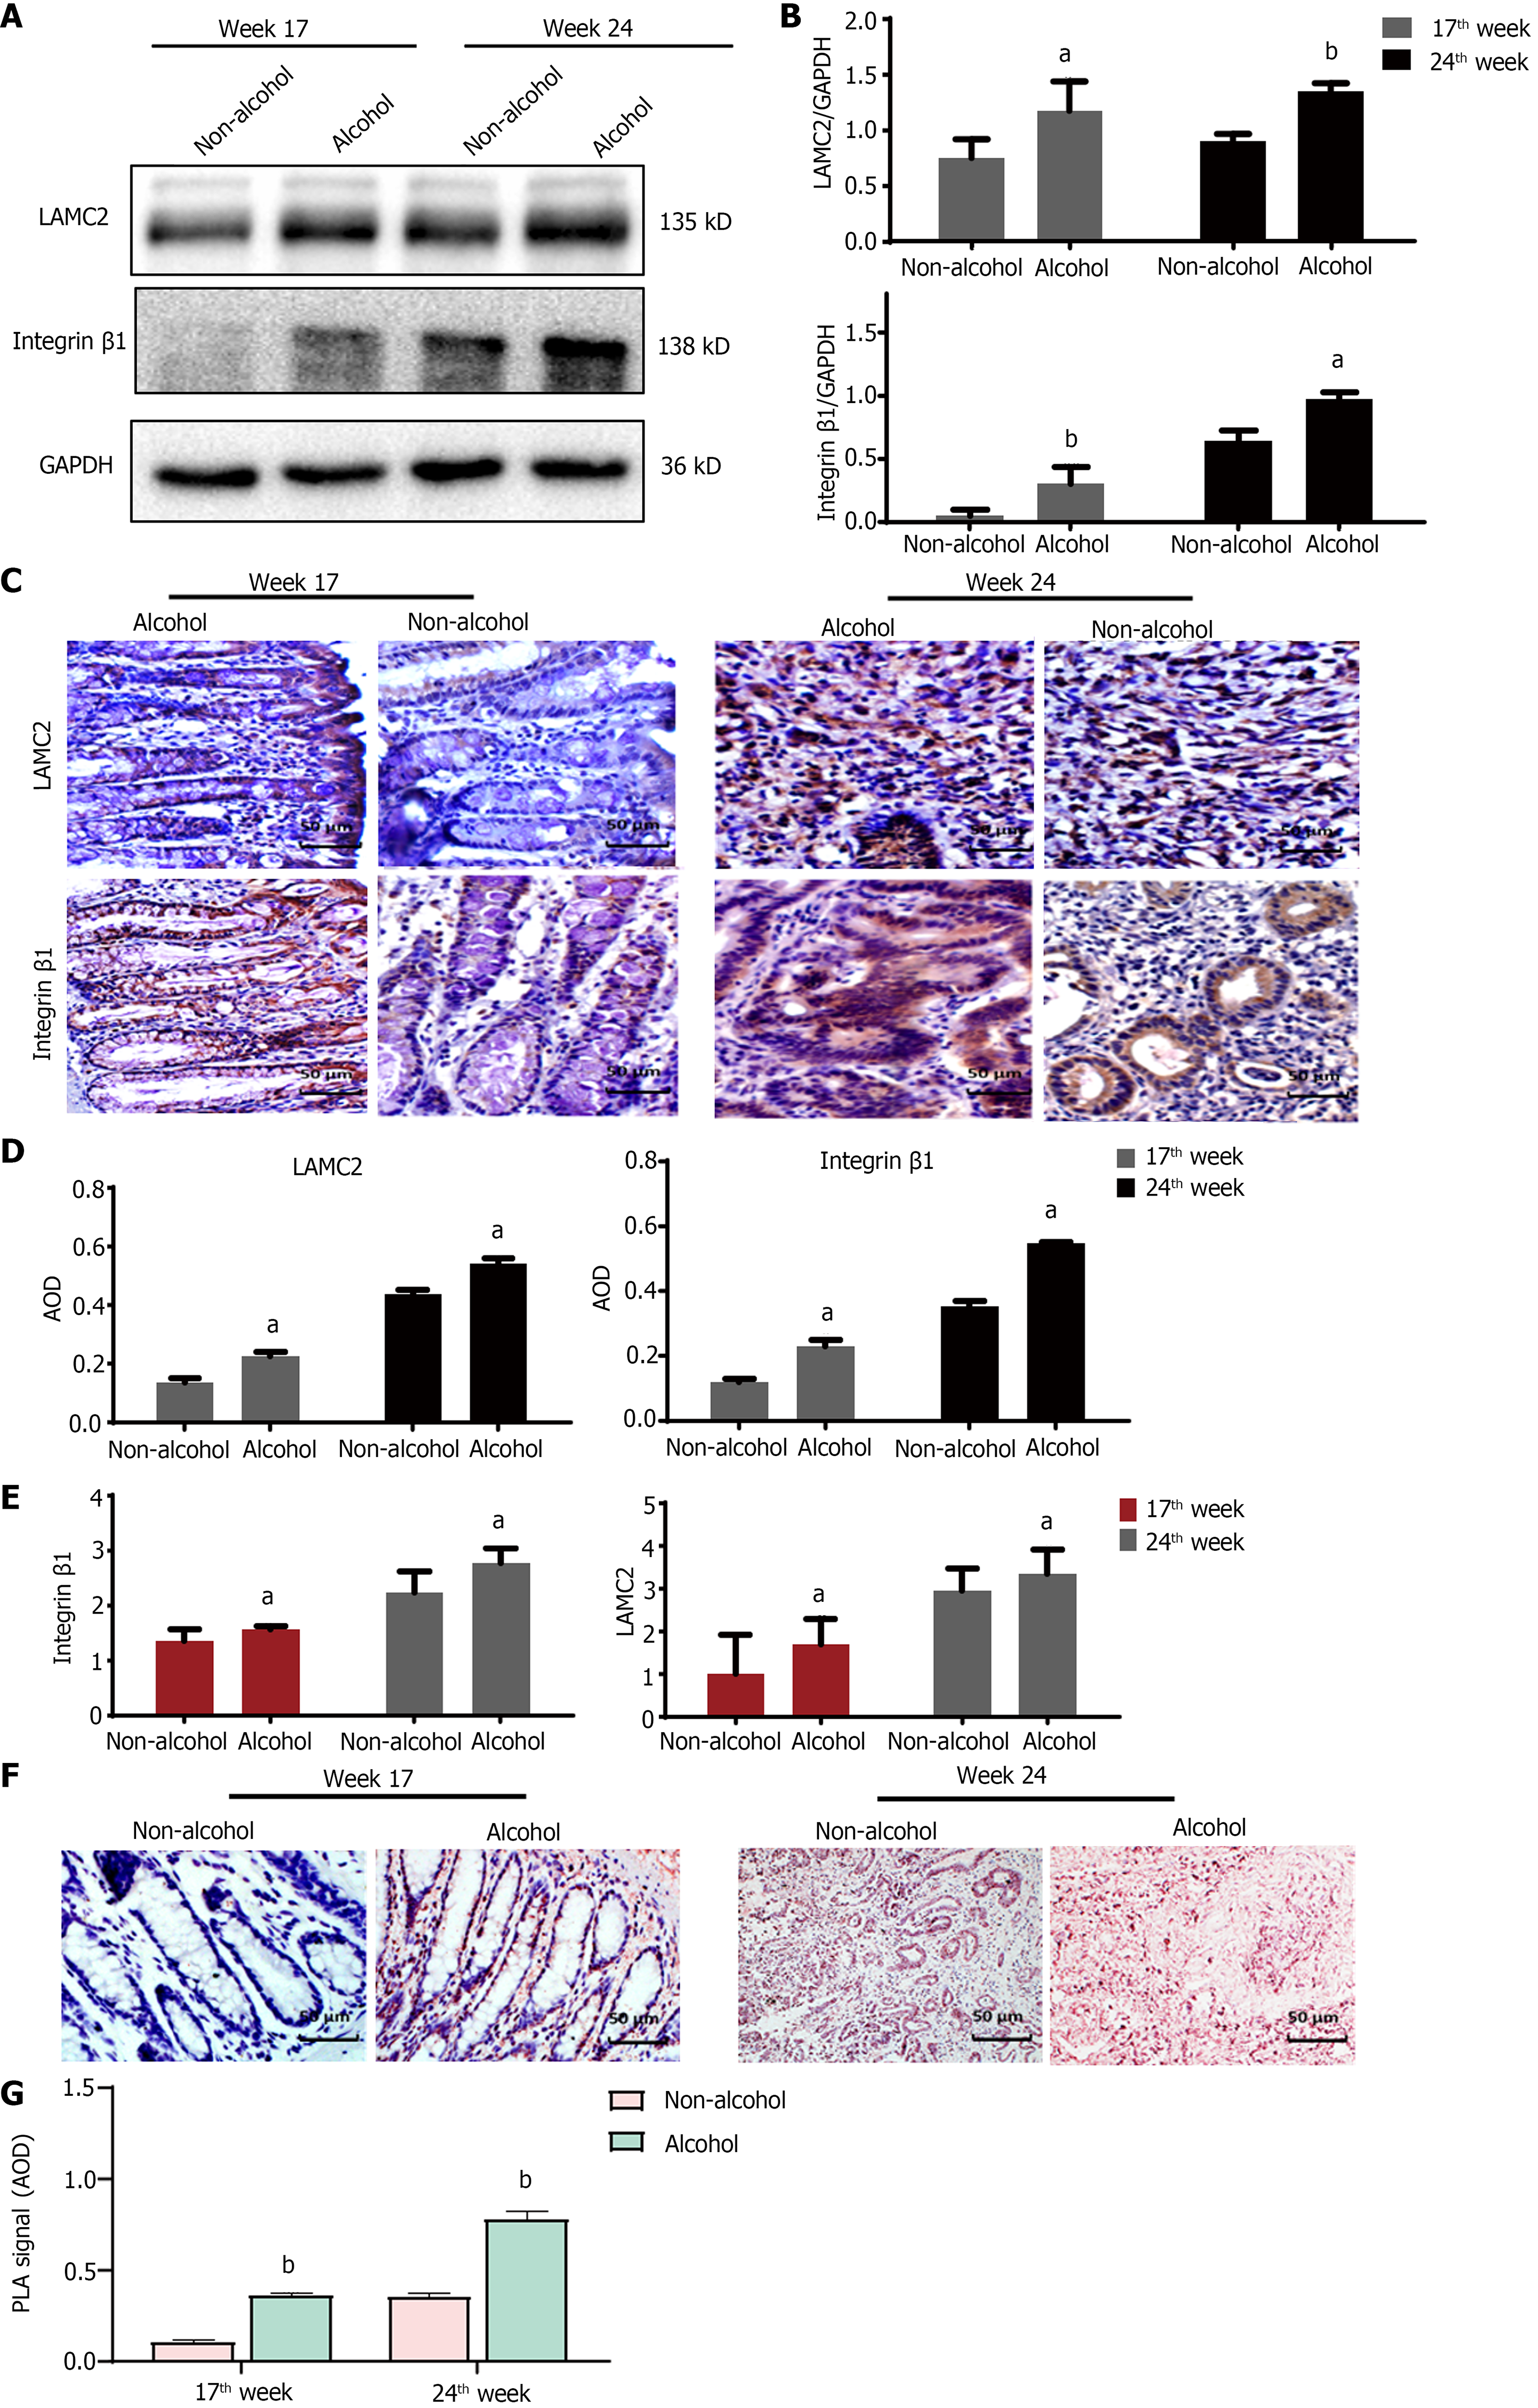
Figure 3 Alcohol consumption regulates the expression and interaction of integrin-β1 and laminin-γ2 in animal samples.
The bars represent the mean ± SD (n = 8). A and B: Quantification of the protein levels of integrin-β1 (ITGB1) and laminin-γ2 (LAMC2) detected by western blotting in animal samples; C and D: Quantification of the protein levels of ITGB1 and LAMC2 by immunohistochemical (IHC) in animal samples; E: Quantification of the mRNA levels of ITGB1 and LAMC2 by quantitative real-time polymerase chain reaction in clinical samples; F: Statistical analysis of IHC was performed by counting the average optical density (AOD). In Duolink proximity ligation assay (PLA), the brown dot particles observed under the microscope represent the interactions between LAMC2 and ITGB1; G: The statistical analysis of PLA positive signals was performed by counting the AOD under a light microscope. Compared with the non-alcohol group: bP < 0.01, aP < 0.05. ITGB1: Integrin-β1; LAMC2: Laminin-γ2; GAPDH: Glyceraldehyde-3-phosphate dehydrogenase; PLA: Proximity ligation assay; IHC: Immunohistochemical staining; AOD: Average optical density.
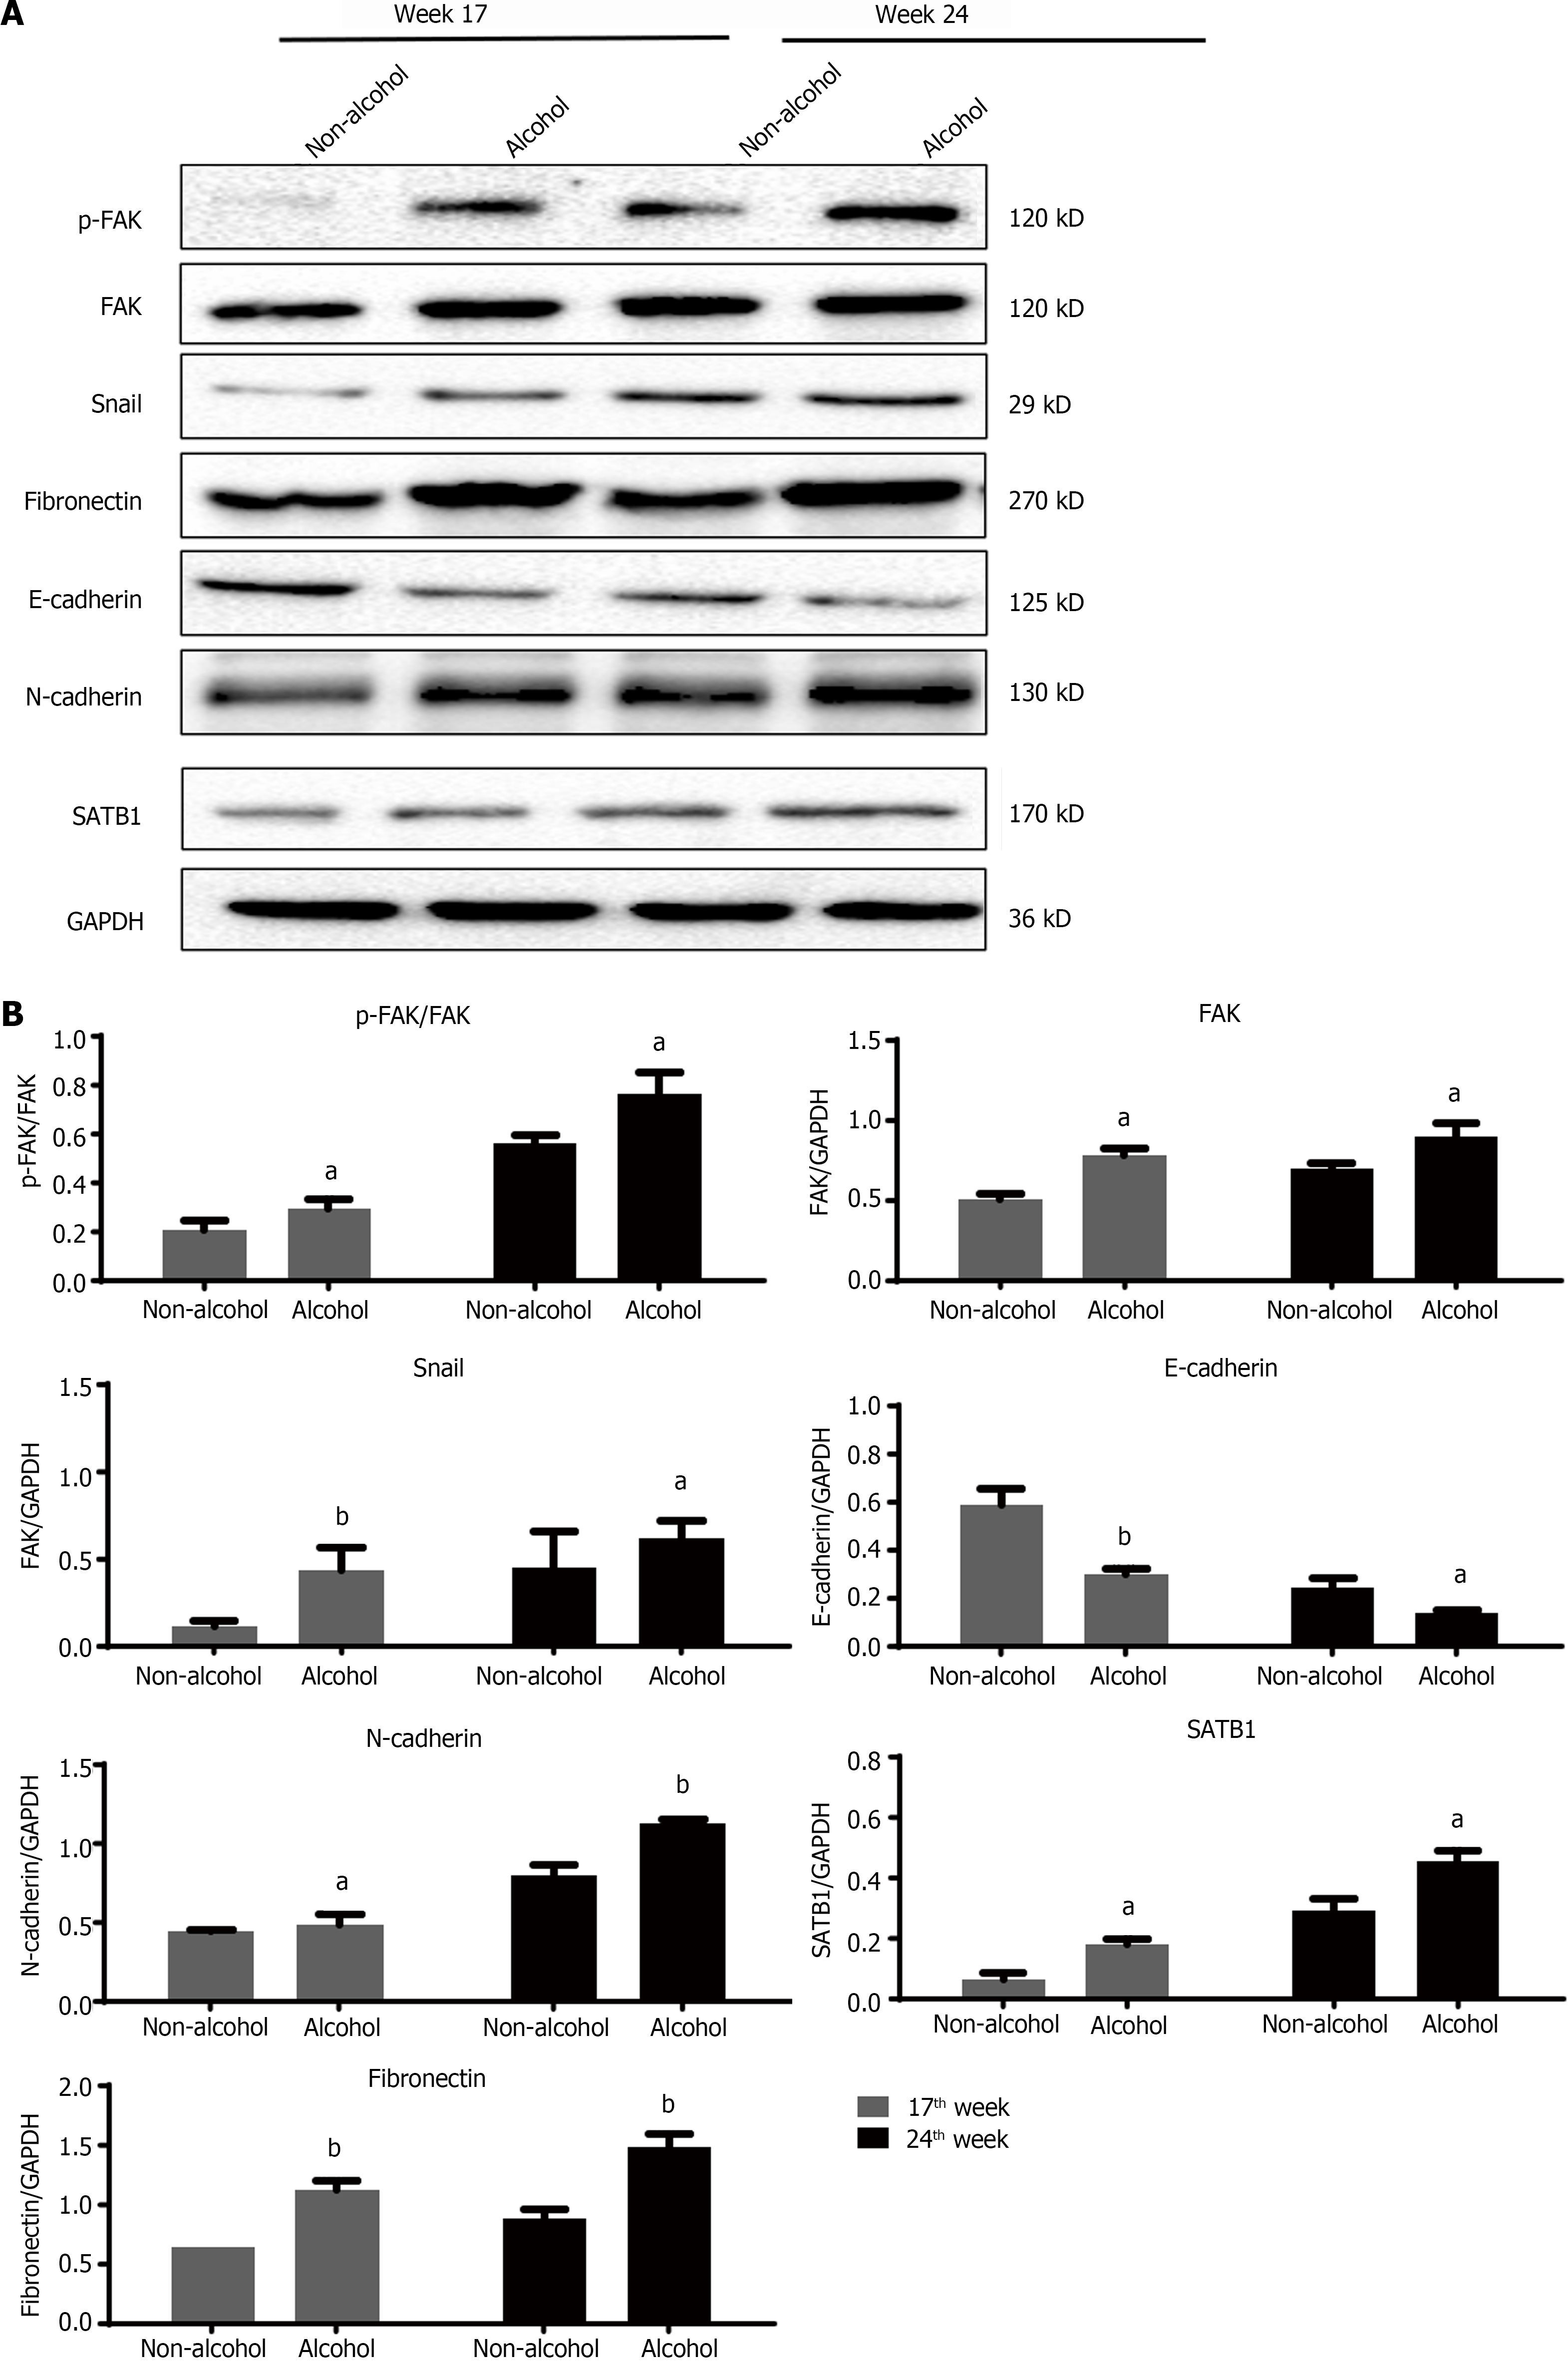
Figure 4 Quantification of the protein levels of epithelial mesenchymal transformation-related markers in colorectal cancer rats by using western blotting.
The bars represent the mean ± SD (n = 3). A: The western blotting images of phosphorylate-focal adhesion kinase (p-FAK), FAK, snail, fibronectin, E-cadherin, N-cadherin and special AT-rich sequence binding protein 1 (SATB1) in animal samples; B: Quantification of the protein levels of FAK, p-FAK/FAK, snail, fibronectin, E-cadherin, N-cadherin and SATB1 in animal samples. Compared with the non-alcohol group: bP < 0.01, aP < 0.05. SATB1: Special AT-rich sequence binding protein 1; FAK: Focal adhesion kinase; p-FAK: Phosphorylate focal adhesion kinase; GAPDH: Glyceraldehyde-3-phosphate dehydrogenase.
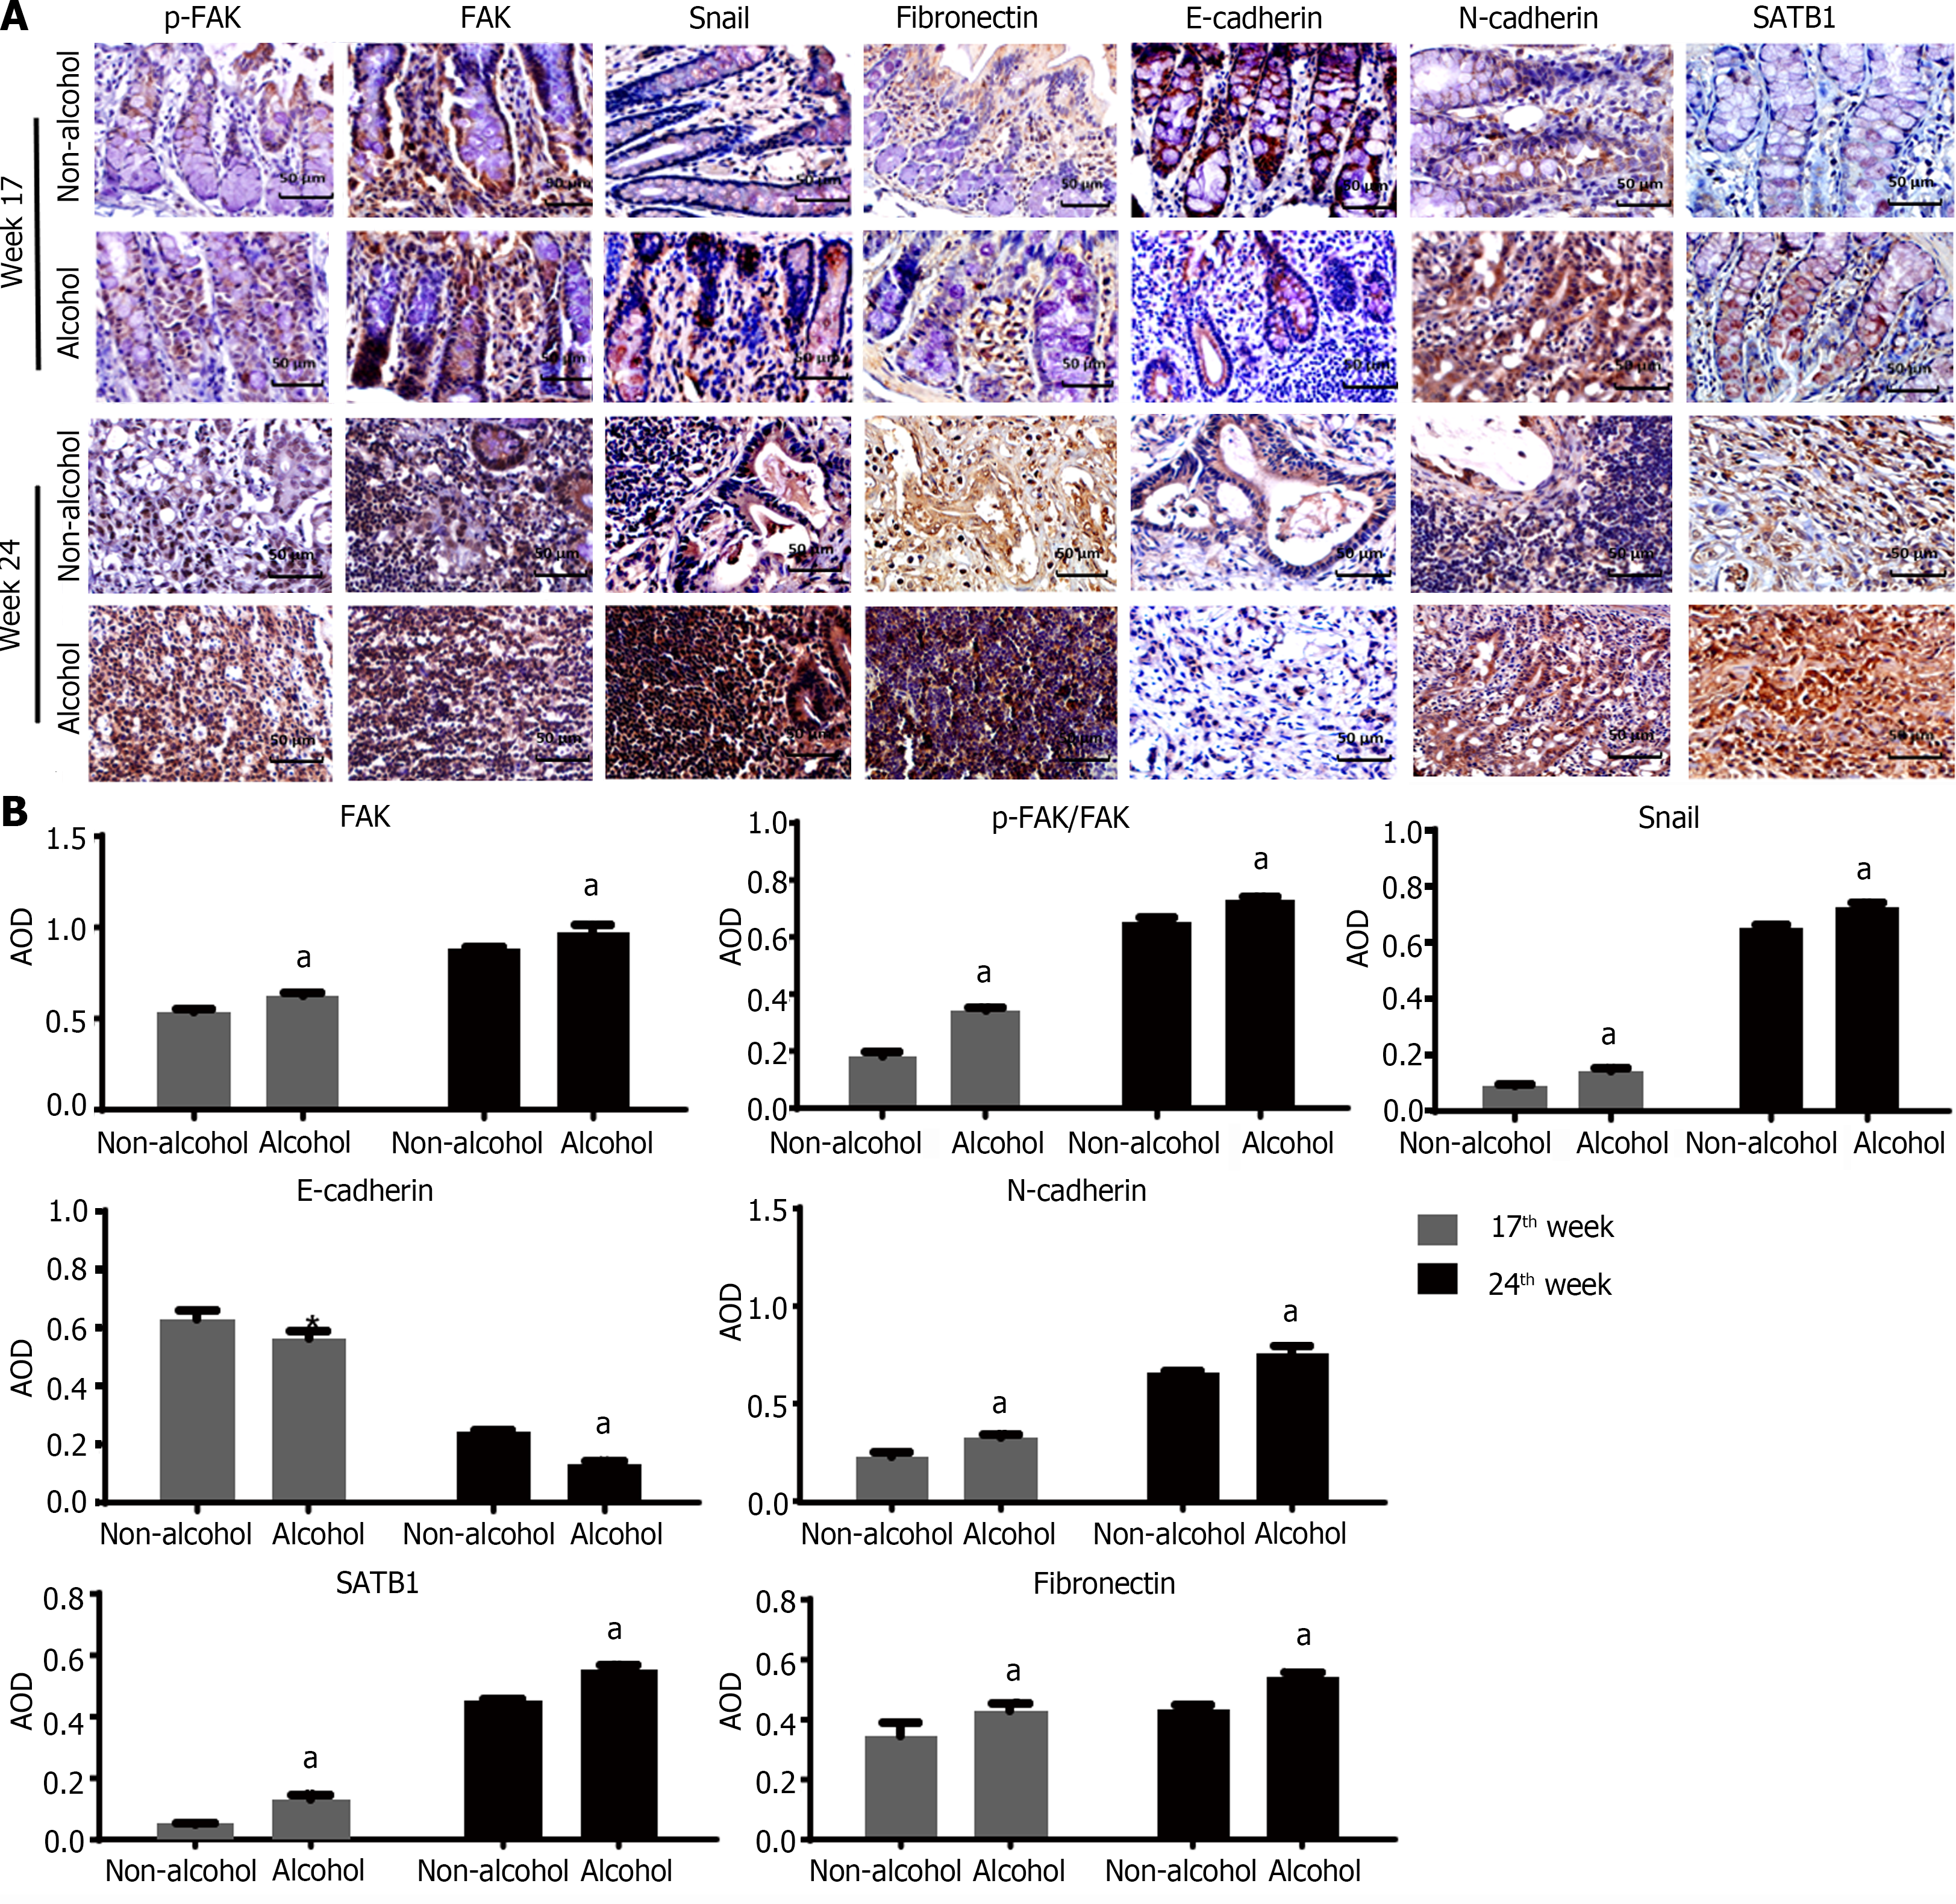
Figure 5 Immunohistochemical staining detected the protein level of epithelial mesenchymal transformation-related markers in colorectal cancer rats.
The bars represent the mean ± SD (n = 3). A: The images of immunohistochemical (IHC) in animal samples; B: Quantification of the protein levels of focal adhesion kinase (FAK), phosphorylate-FAK (p-FAK)/FAK, snail, Fibronectin, E-cadherin, N-cadherin and special AT-rich sequence binding protein 1 detected by IHC counting the average optical density. Compared with the non-alcohol group: bP < 0.01, aP < 0.05. SATB1: Special AT-rich sequence binding protein 1; FAK: Focal adhesion kinase; p-FAK: Phosphorylate focal adhesion kinase; qRT-PCR: Quantitative real-time polymerase chain reaction; IHC: Immunohistochemical staining; AOD: Average optical density.
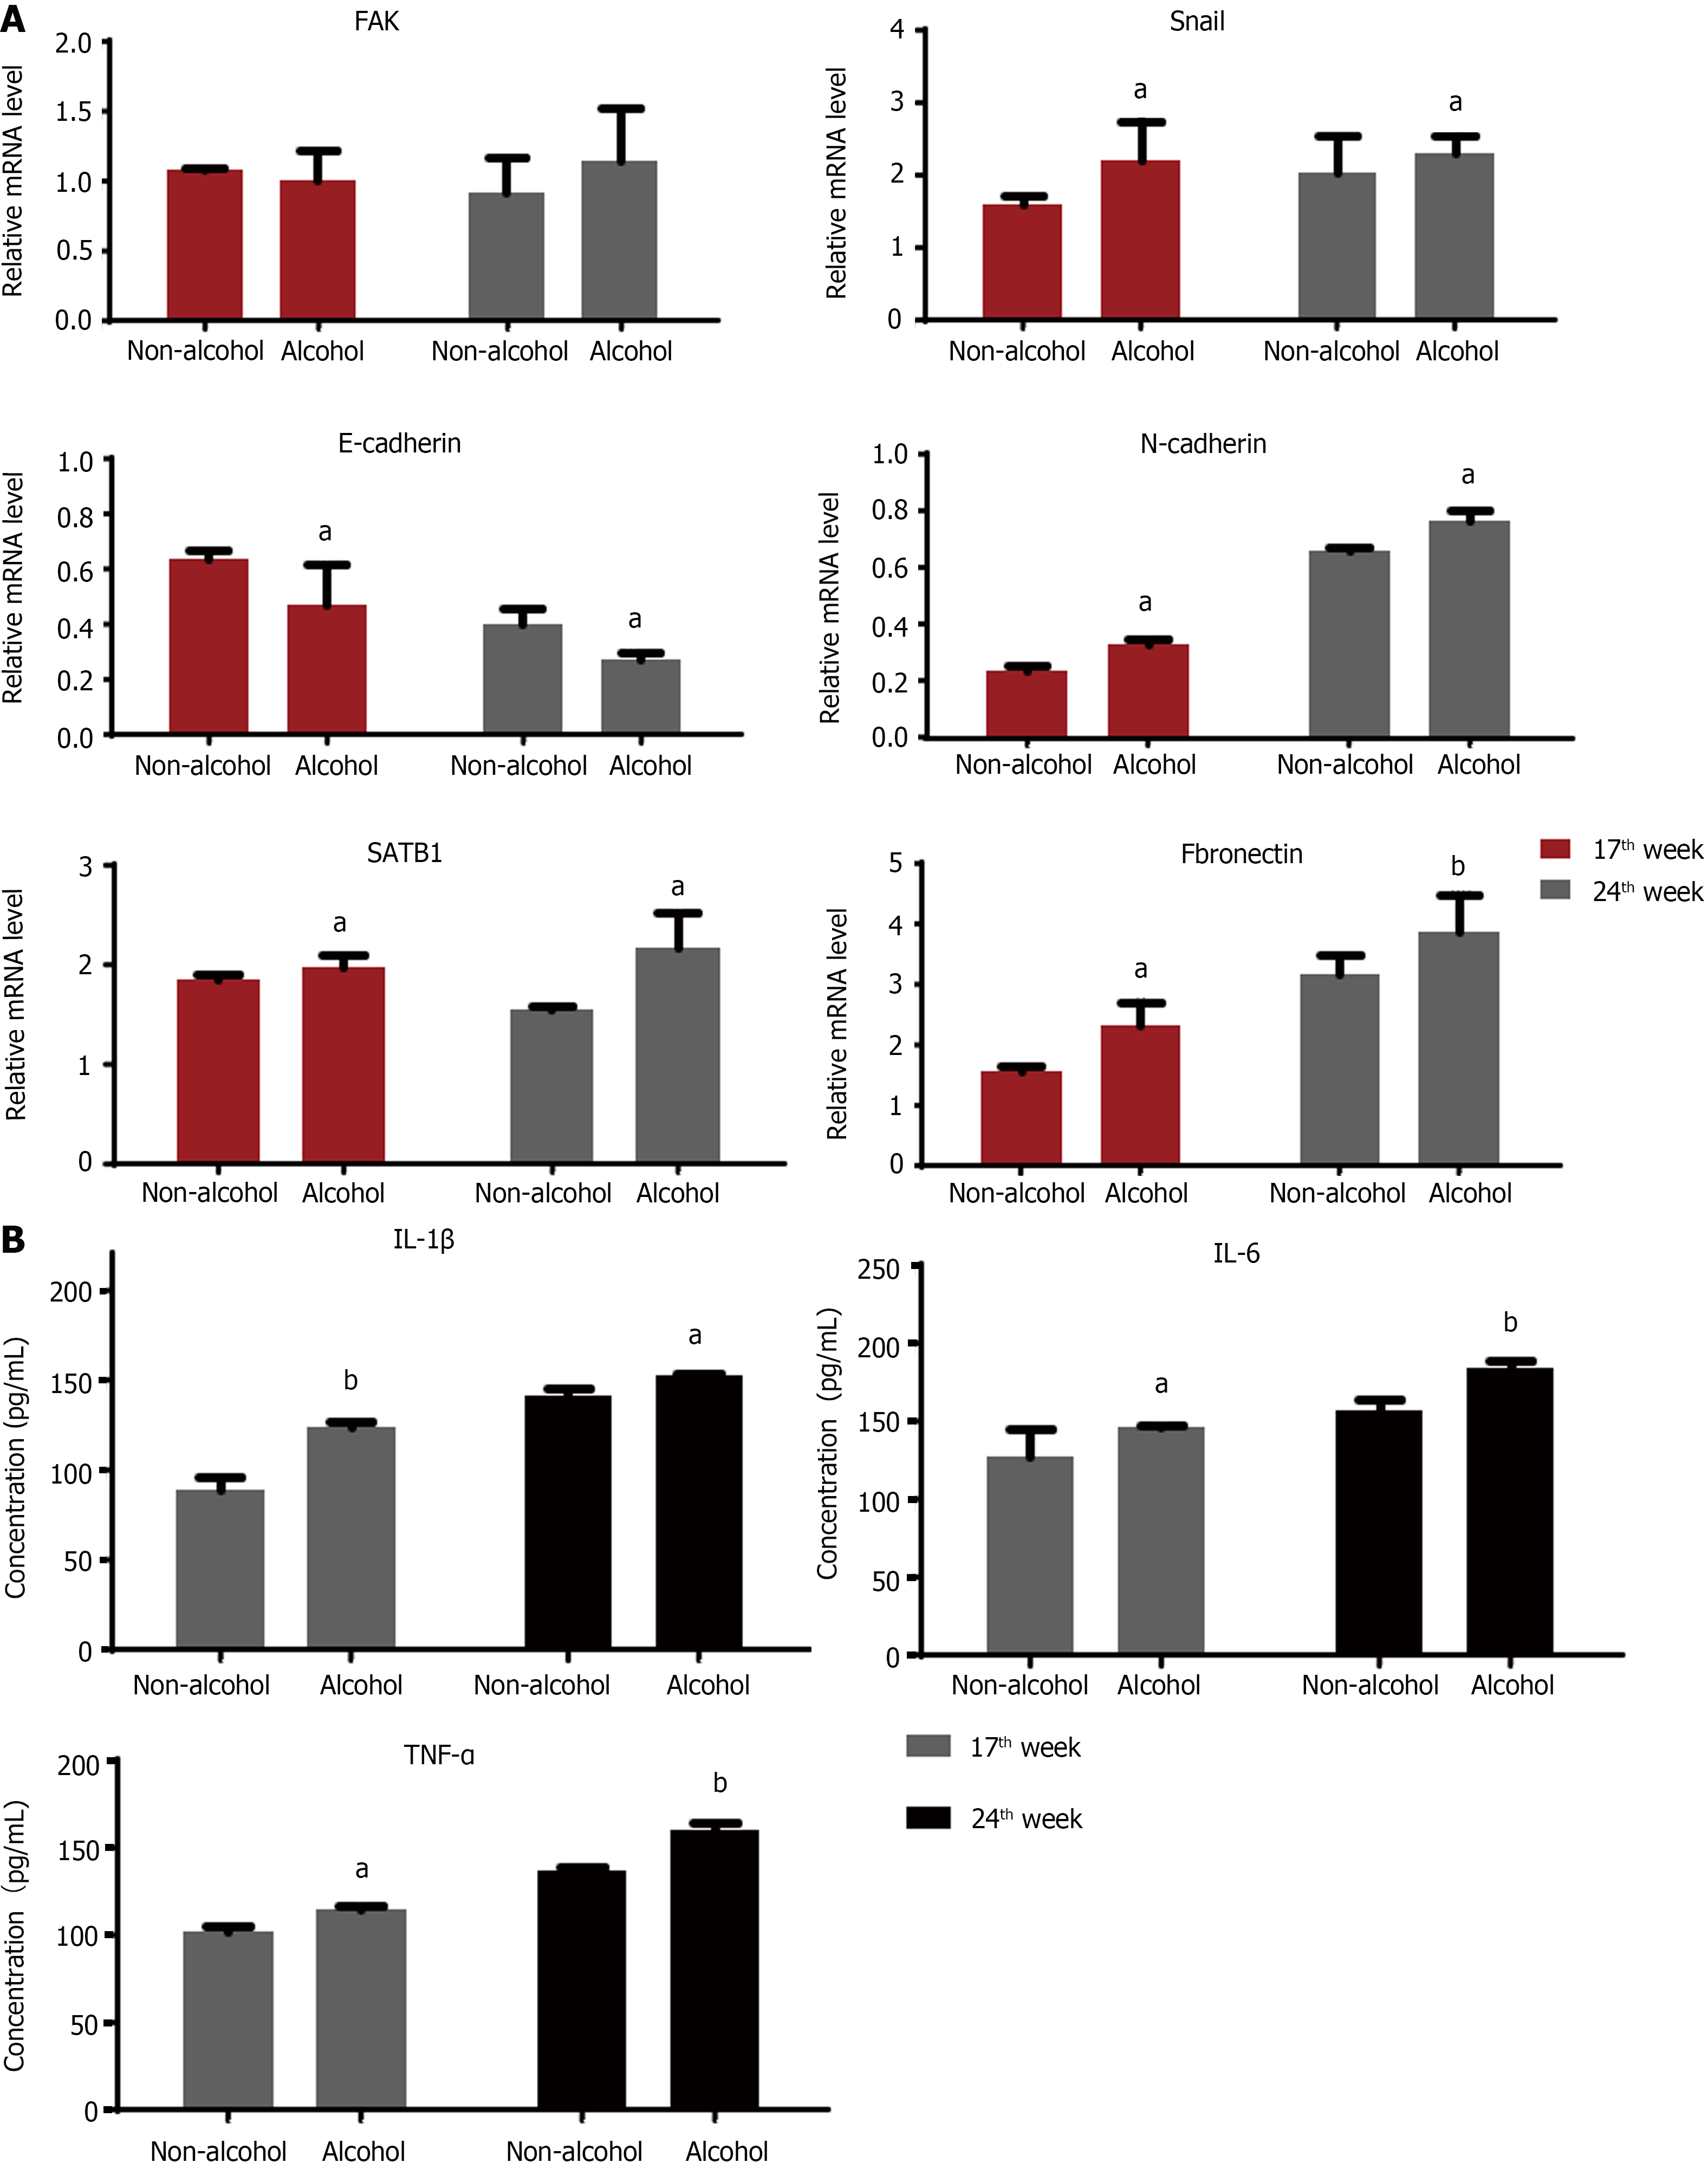
Figure 6 Alcohol consumption regulated the mRNA expression of epithelial mesenchymal transformation-related markers and proinflammatory factors in colorectal cancer rats.
The bars represent the mean ± SD (n = 8). A: Quantification of the mRNA levels of snail, focal adhesion kinase, fibronectin, N-cadherin, E-cadherin and special AT-rich sequence binding protein 1 in each group analyzed by quantitative real-time polymerase chain reaction; B: Tumor necrosis factor-α, interleukin-6 (IL-6) and IL-1β levels in each group. Compared with the non-alcohol group: bP < 0.01, aP < 0.05. SATB1: Special AT-rich sequence binding protein 1; FAK: Focal adhesion kinase; IL-1β: Interleukin-1β; IL-6: Interleukin-6; TNF-α: Tumor necrosis factor-α.
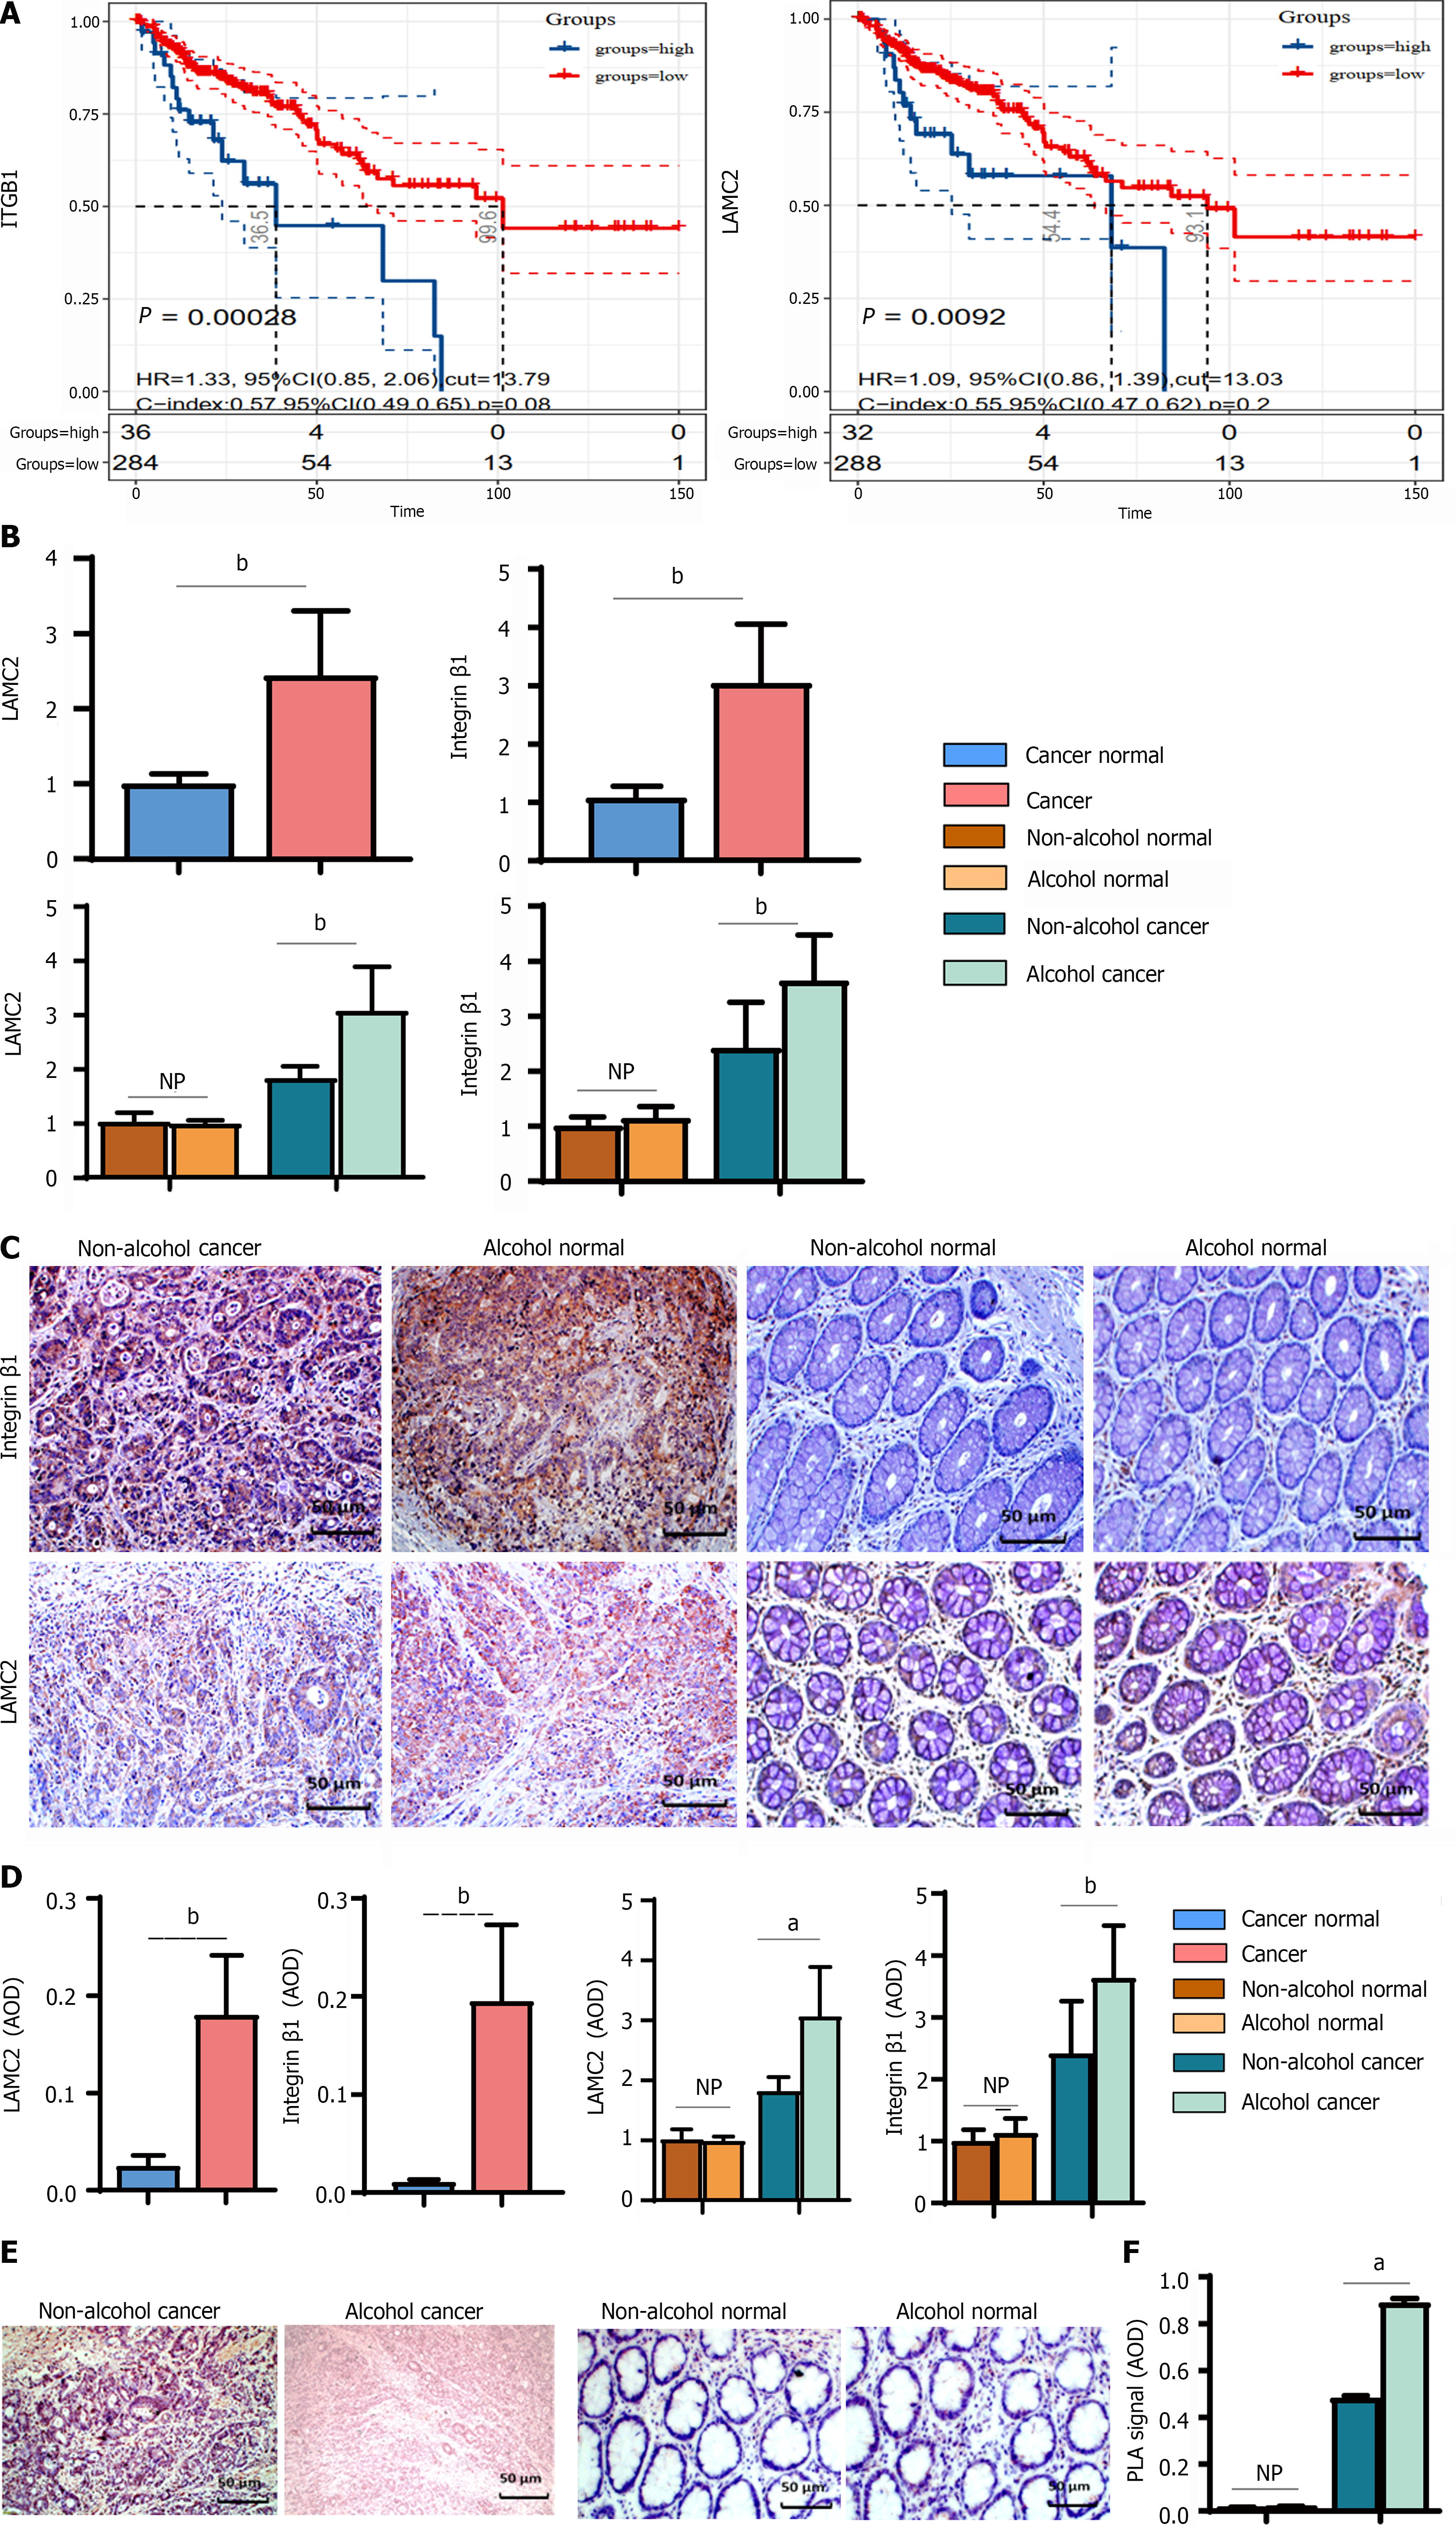
Figure 7 Alcohol consumption increased the expression and interaction of laminin-γ2 and integrin-β1 in colorectal cancer rats.
The bars represent the mean ± SD (n = 8). A: Survival analysis of integrin-β1 (ITGB1) and laminin-γ2 (LAMC2) in colorectal cancer; B: The mRNA levels of ITGB1 and LAMC2 determined by quantitative real-time polymerase chain reaction in clinical samples; C: Representative immunohistochemical (IHC) images of ITGB1 and LAMC2 in clinical samples (× 400); D: The quantifications of the protein levels of ITGB1 and LAMC2 determined by IHC in clinical samples; E and F: Duolink proximity ligation assay (PLA) verified the interactions between ITGB1 and LAMC2 in clinical samples. The statistical analysis of PLA positive signals was performed by counting the average optical density under a light microscope. Compared with the non-alcohol group: bP < 0.01, aP < 0.05. LAMC2: Laminin-γ2; ITGB1: Integrin-β1; qRT-PCR: Quantitative real-time polymerase chain reaction; PLA: Proximity ligation assay; IHC: Immunohistochemical staining; AOD: Average optical density. Cancer normal group: cancer adjacent tissue group. NP: No statistical difference.
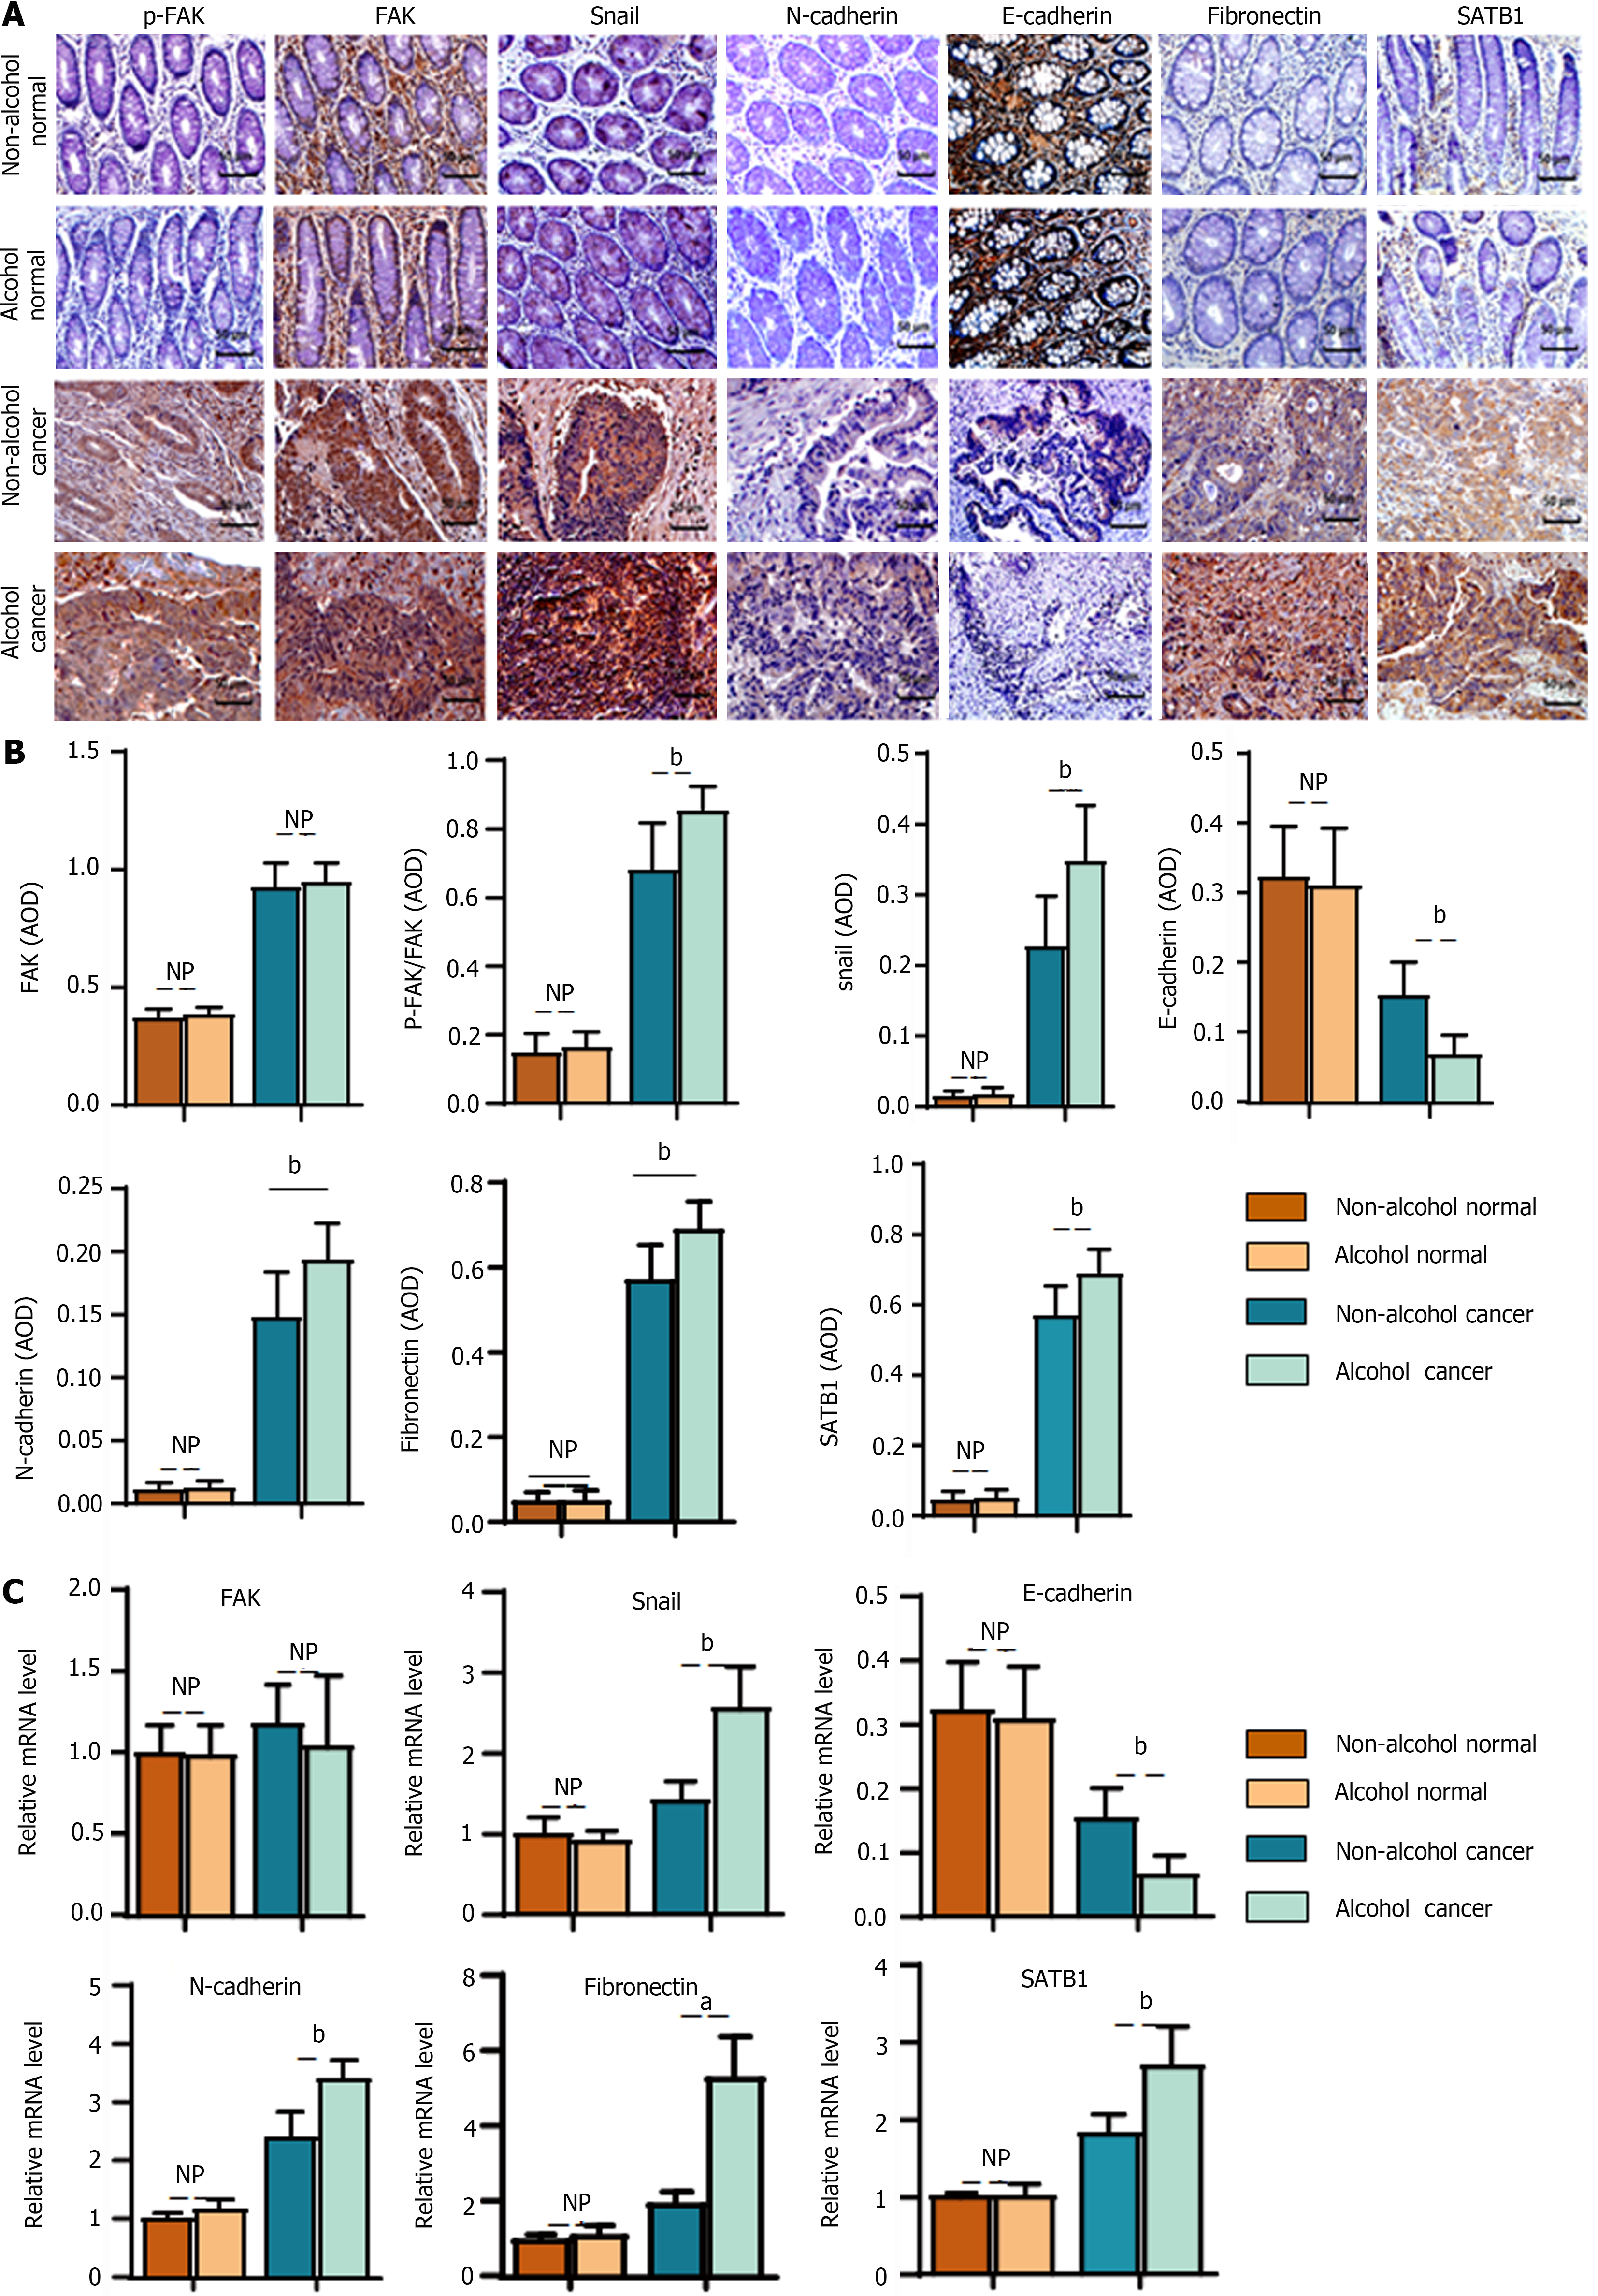
Figure 8 Alcohol consumption influenced the protein and mRNA levels of epithelial mesenchymal transformation -associated markers in colorectal cancer patients.
The bars represent the mean ± SD (n = 8). A: Representative immunohistochemical images of phosphorylate-focal adhesion kinase (p-FAK), FAK, snail, fibronectin, E-cadherin, N-cadherin and special AT-rich sequence binding protein 1 (SATB1) in different groups in clinical samples (× 400); B: Quantification of the protein levels of FAK, p-FAK/FAK, snail, fibronectin, E-cadherin, N-cadherin and SATB1 by counting the average optical density in clinical samples; C: Quantification of the mRNA levels of FAK, snail, fibronectin, E-cadherin, N-cadherin and SATB1 by quantitative real-time polymerase chain reaction in clinical samples. Compared with the non-alcohol group: bP < 0.01, aP < 0.05. SATB1: Special AT-rich sequence binding protein 1; FAK: Focal adhesion kinase; p-FAK: Phosphorylate focal adhesion kinase; AOD: Average optical density. NP: No statistical difference.
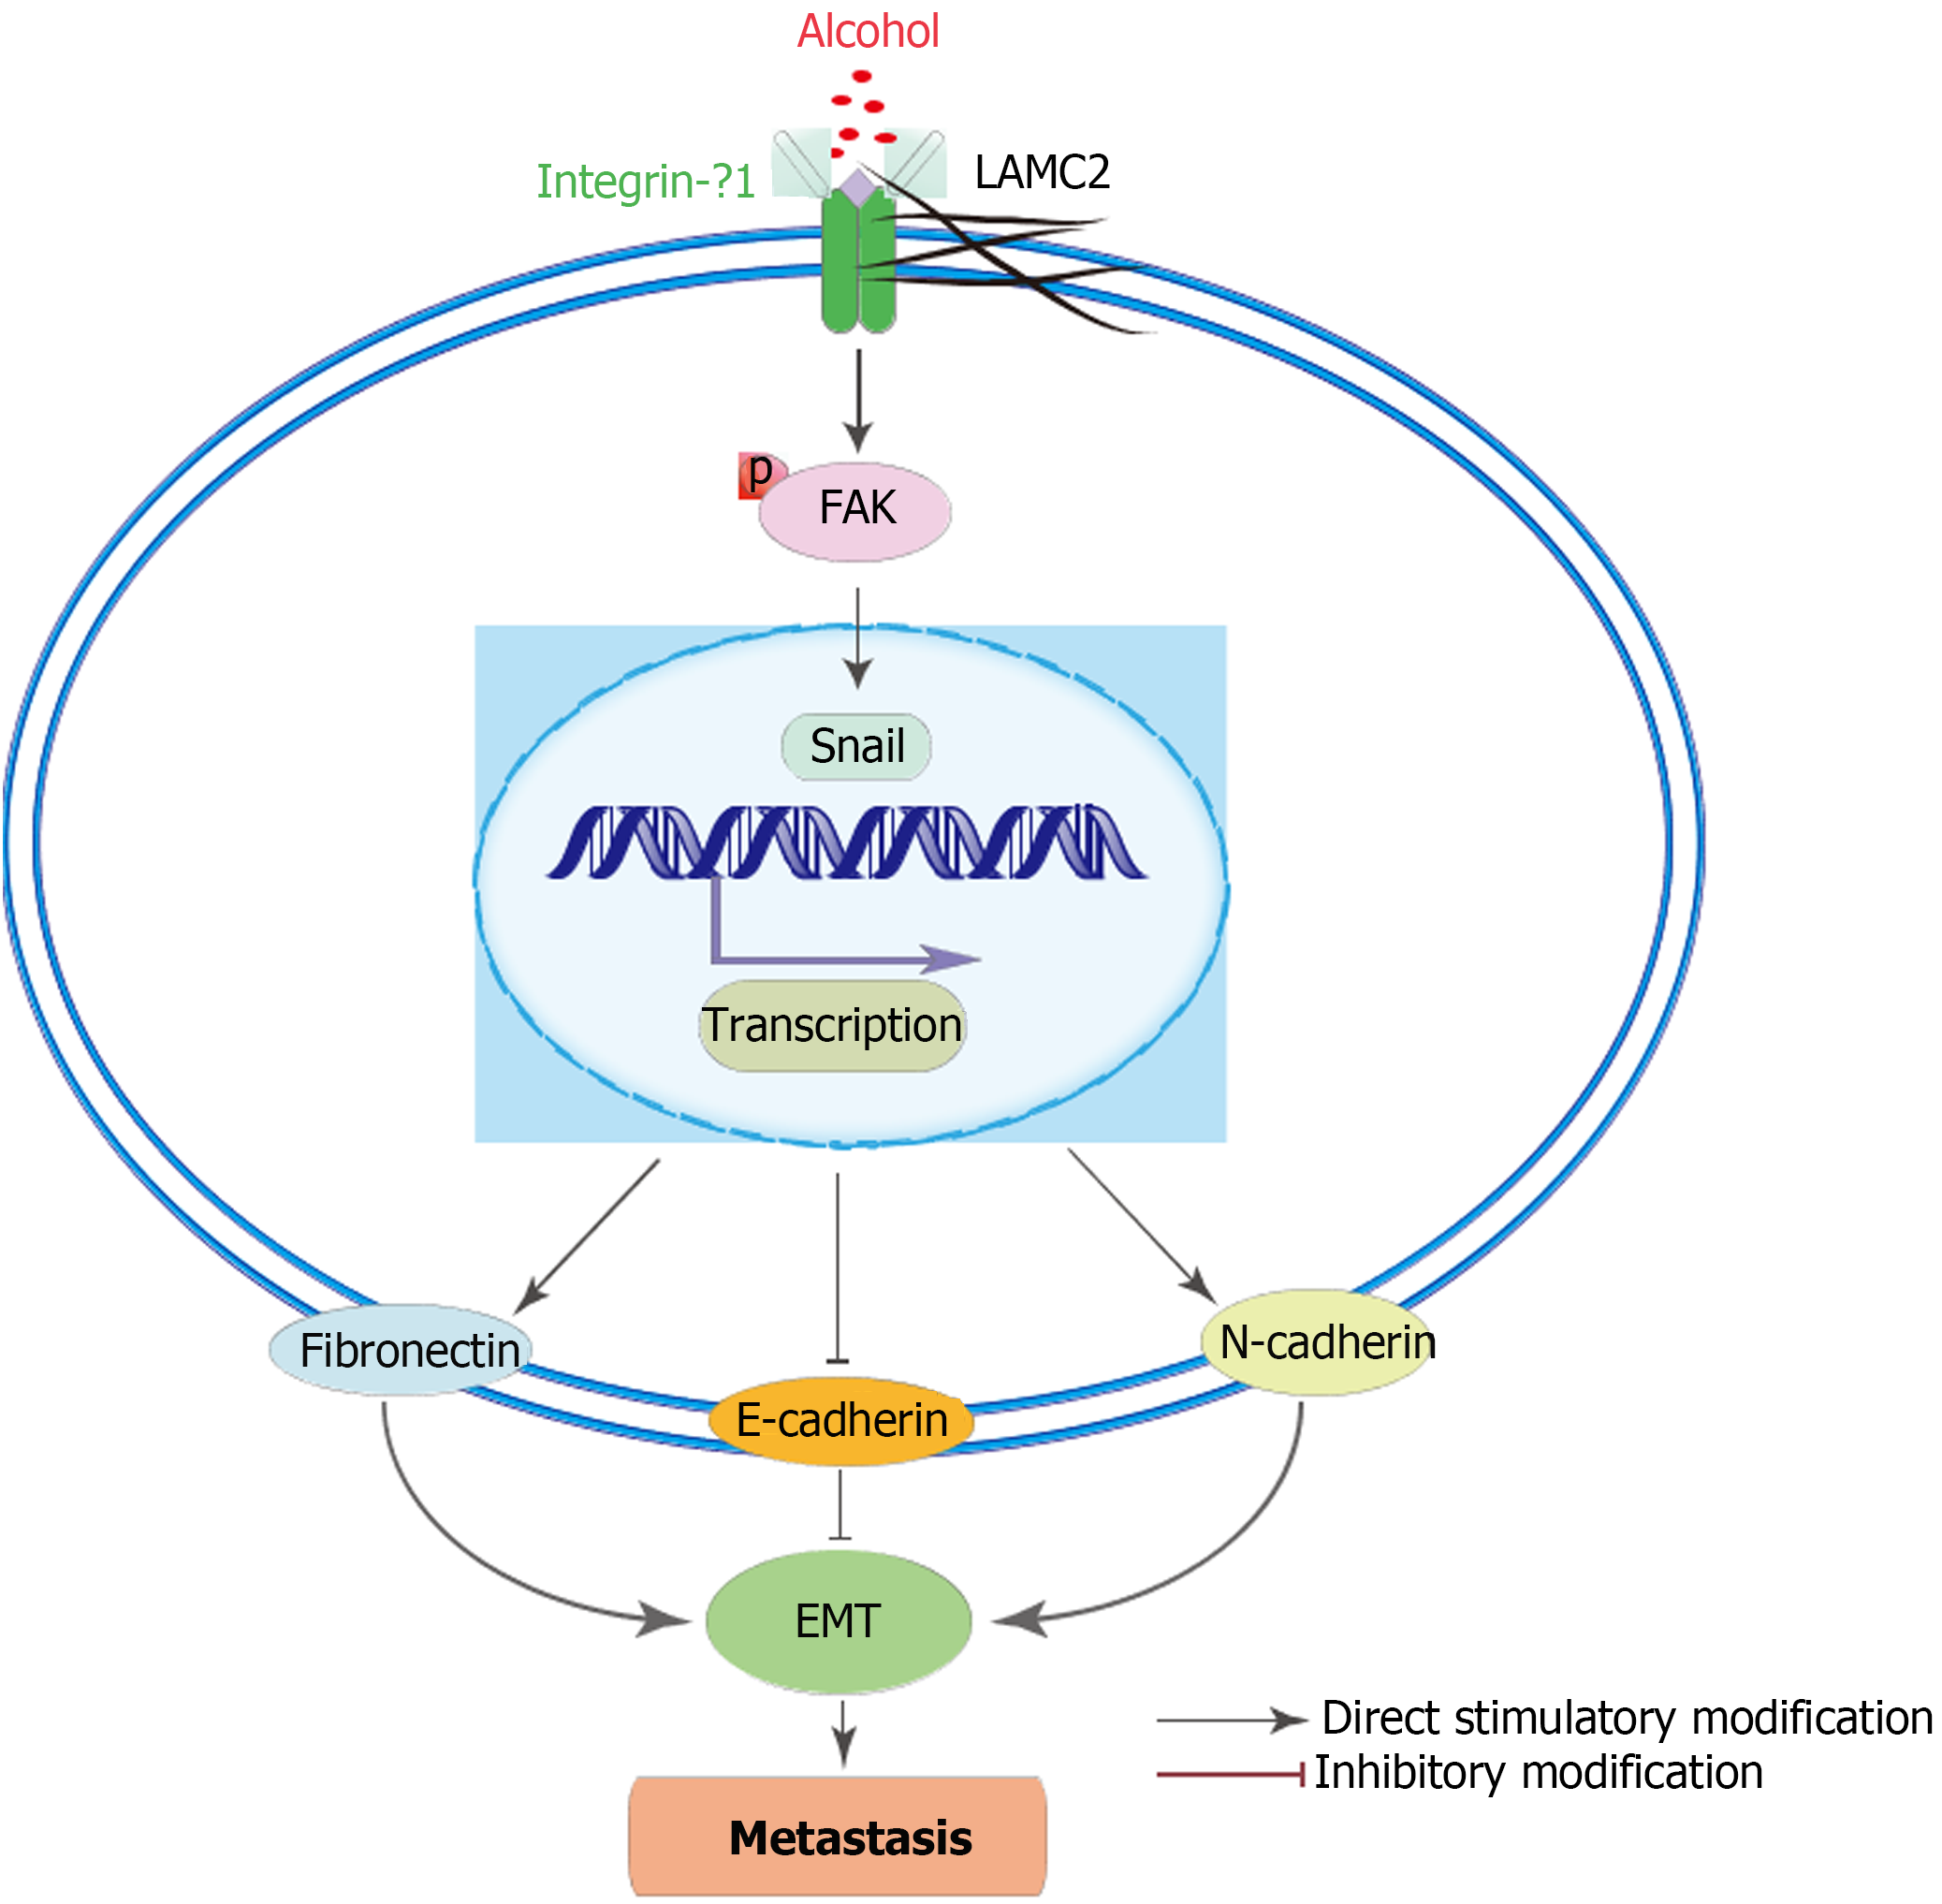
Figure 9 Schematic diagram of the possible signaling pathway regulated by alcohol.
EMT: Epithelial mesenchymal transformation; LAMC2: Laminin-γ2; ITGB1: Integrin-β1; FAK: Focal adhesion kinase; p-FAK: Phosphorylate focal adhesion kinase.
- Citation: Nong FF, Liang YQ, Xing SP, Xiao YF, Chen HH, Wen B. Alcohol promotes epithelial mesenchymal transformation-mediated premetastatic niche formation of colorectal cancer by activating interaction between laminin-γ2 and integrin-β1. World J Gastroenterol 2022; 28(35): 5154-5174
- URL: https://www.wjgnet.com/1007-9327/full/v28/i35/5154.htm
- DOI: https://dx.doi.org/10.3748/wjg.v28.i35.5154


