Copyright
©The Author(s) 2022.
World J Gastroenterol. Jul 21, 2022; 28(27): 3455-3475
Published online Jul 21, 2022. doi: 10.3748/wjg.v28.i27.3455
Published online Jul 21, 2022. doi: 10.3748/wjg.v28.i27.3455
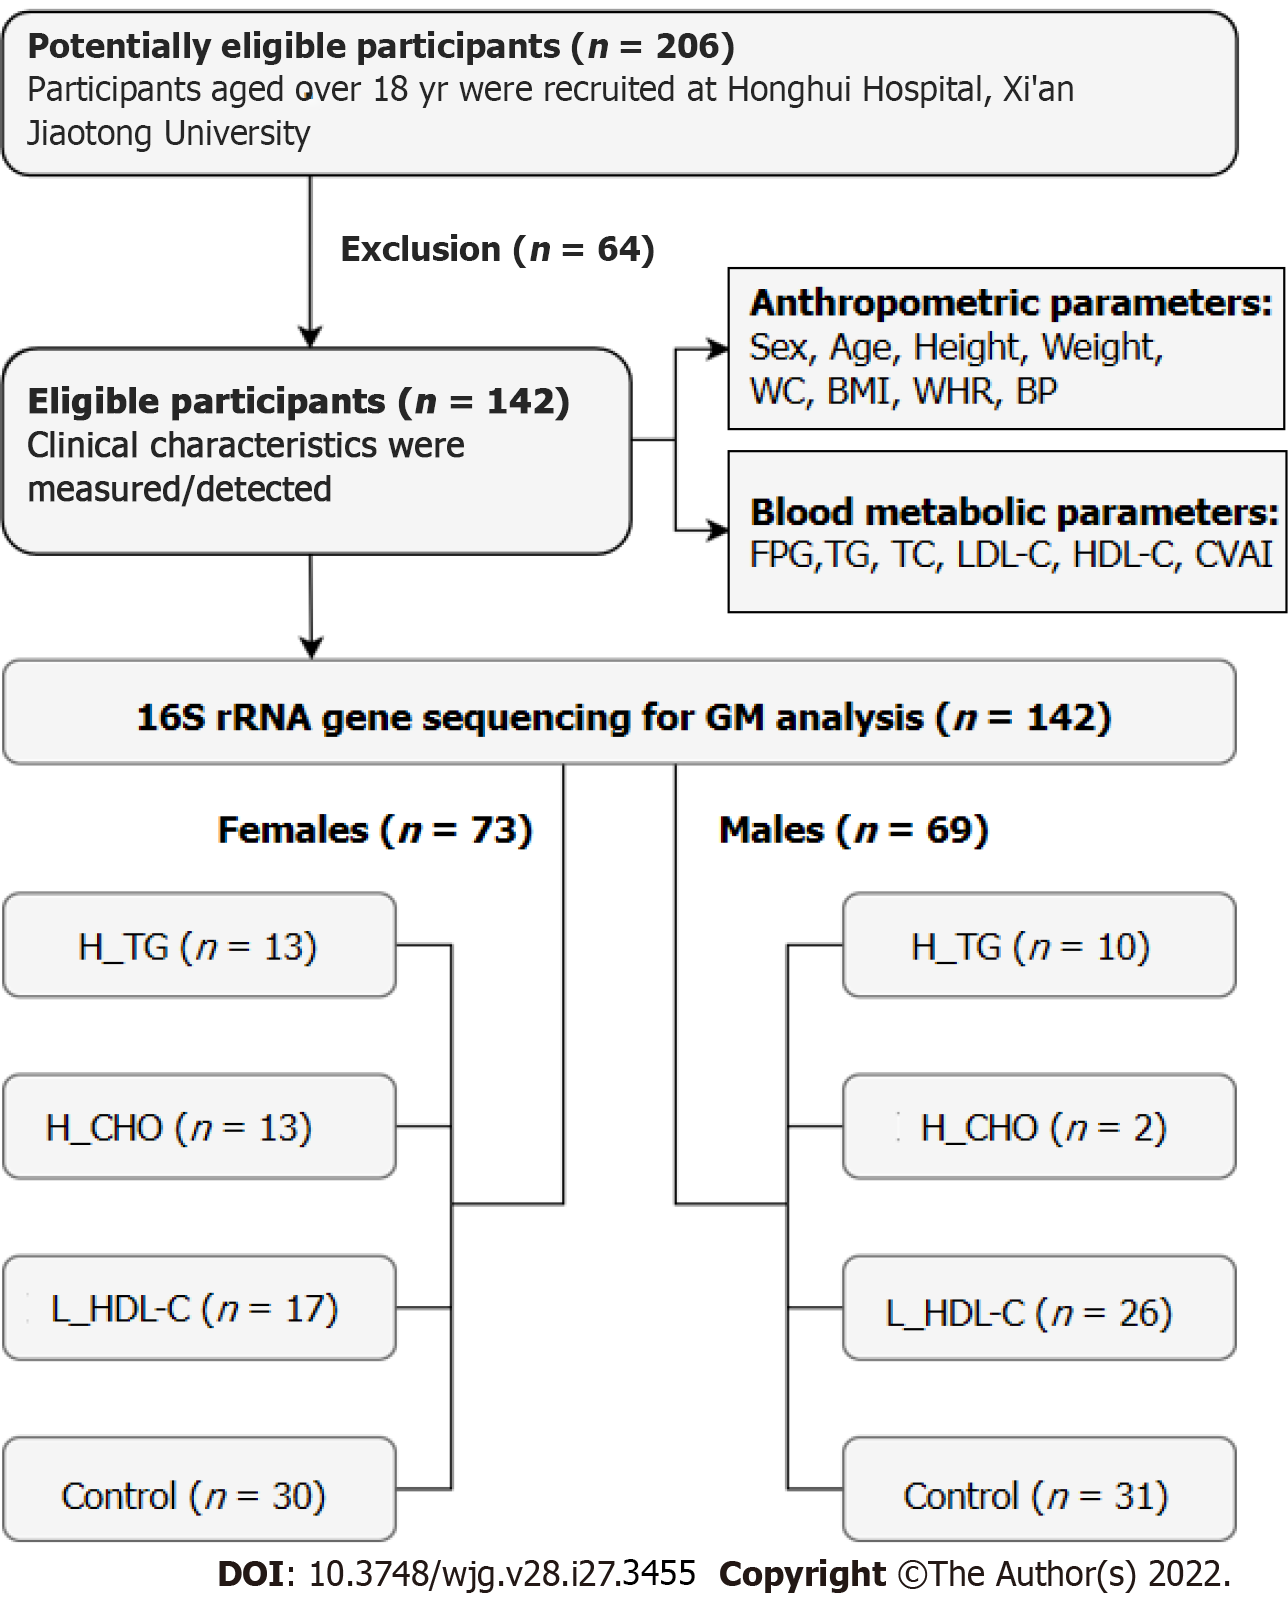
Figure 1 Flow chart of this study.
WC: Waist circumference; BMI: Body mass index; WHR: Waist circumference/height ratio; BP: Blood pressure; FPG: Fasting plasma glucose; TG: Triglyceride; TC: Total cholesterol; LDL-C: Low-density lipoprotein cholesterol; HDL-C: High-density lipoprotein cholesterol; CVAI: Chinese visceral adiposity index; GM: Gut microbiota; H_TG: High triglyceride group; H_CHO: High cholesterol group; L_HDL-C: Low high-density lipoprotein cholesterol group.
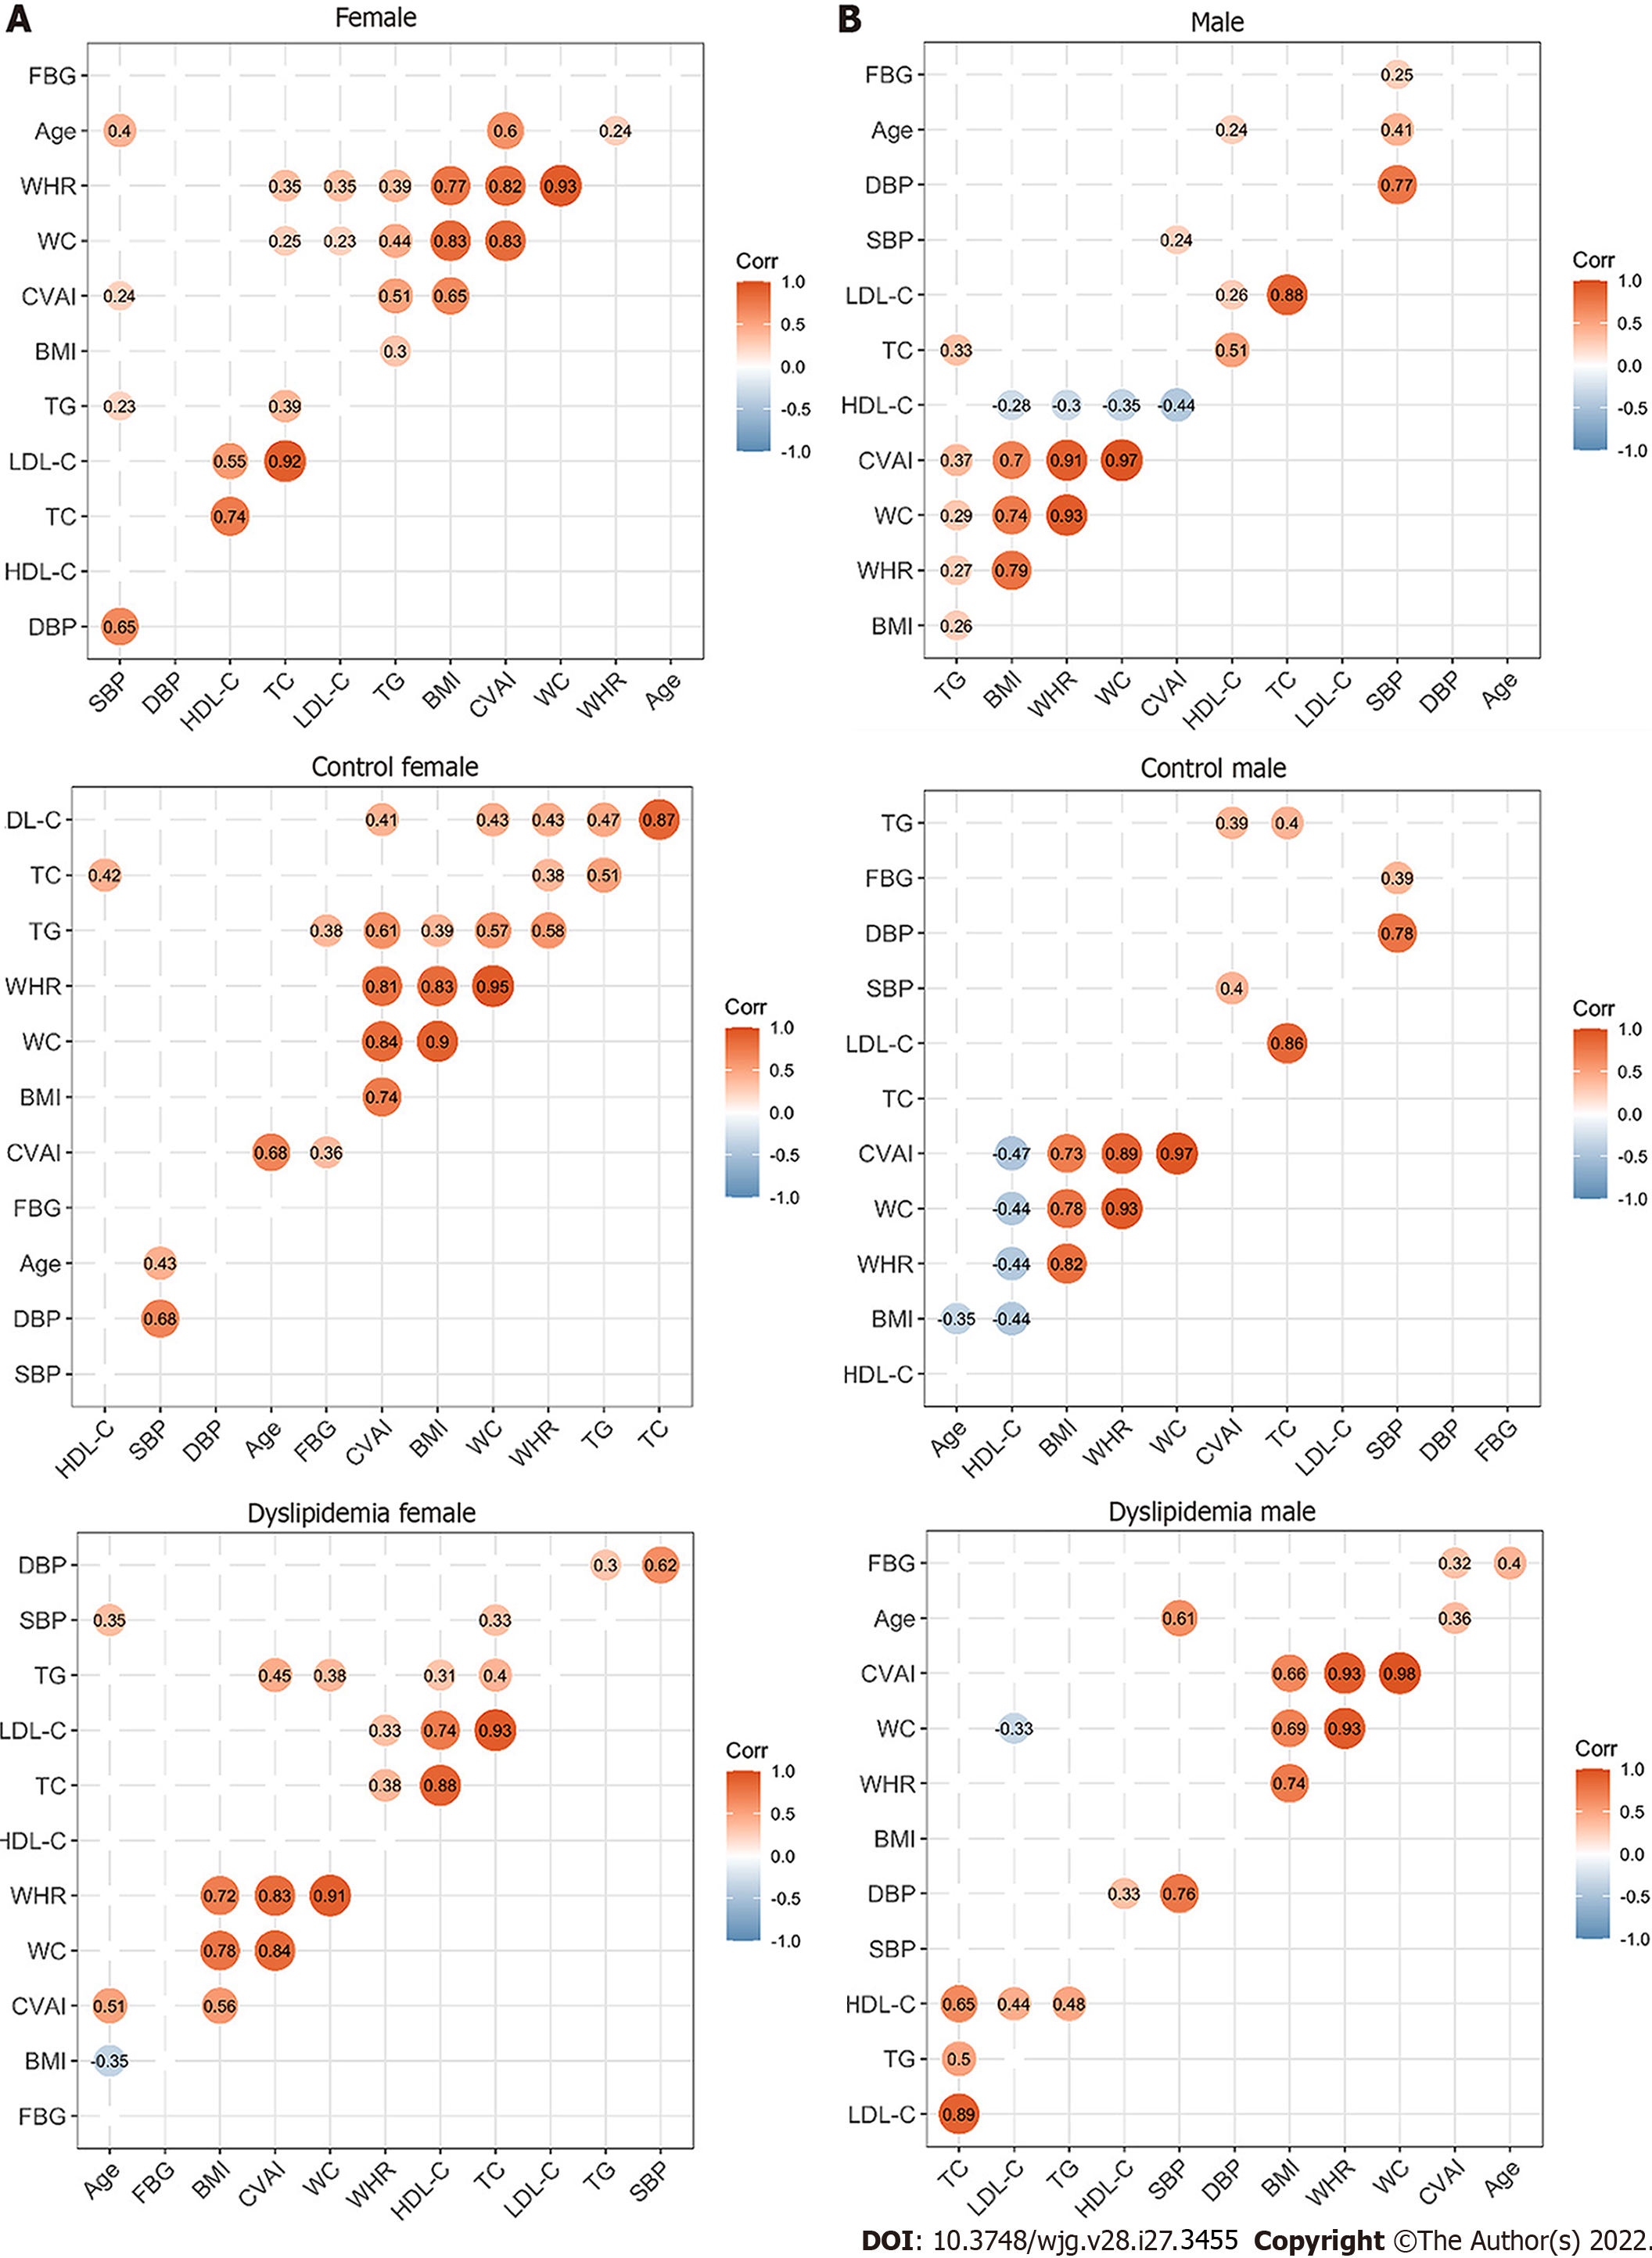
Figure 2 Correlations between the clinical characteristics in the study population.
A: Correlations between the clinical characteristics of the enrolled females; B: Correlations between the clinical characteristics of the enrolled males. The circle represents the correlation coefficient of each two parameters (P value < 0.05). The number presented in the circle is the correlation coefficient. The larger the absolute value is, the stronger the correlation is. Blue indicates a negative correlation and orange indicates a positive correlation. The depth of the color represents the strength of the correlation. The deeper the color is, the stronger the correlation is. The “ggcorrplot” package in R was utilized for Spearman’s correlation analysis. WC: Waist circumference; BMI: Body mass index; WHR: Waist circumference/height ratio; SBP: Systolic blood pressure; DBP: Diastolic blood pressure; TG: Triglyceride; TC: Total cholesterol; LDL-C: Low-density lipoprotein cholesterol; HDL-C: High-density lipoprotein cholesterol; CVAI: Chinese visceral adiposity index.
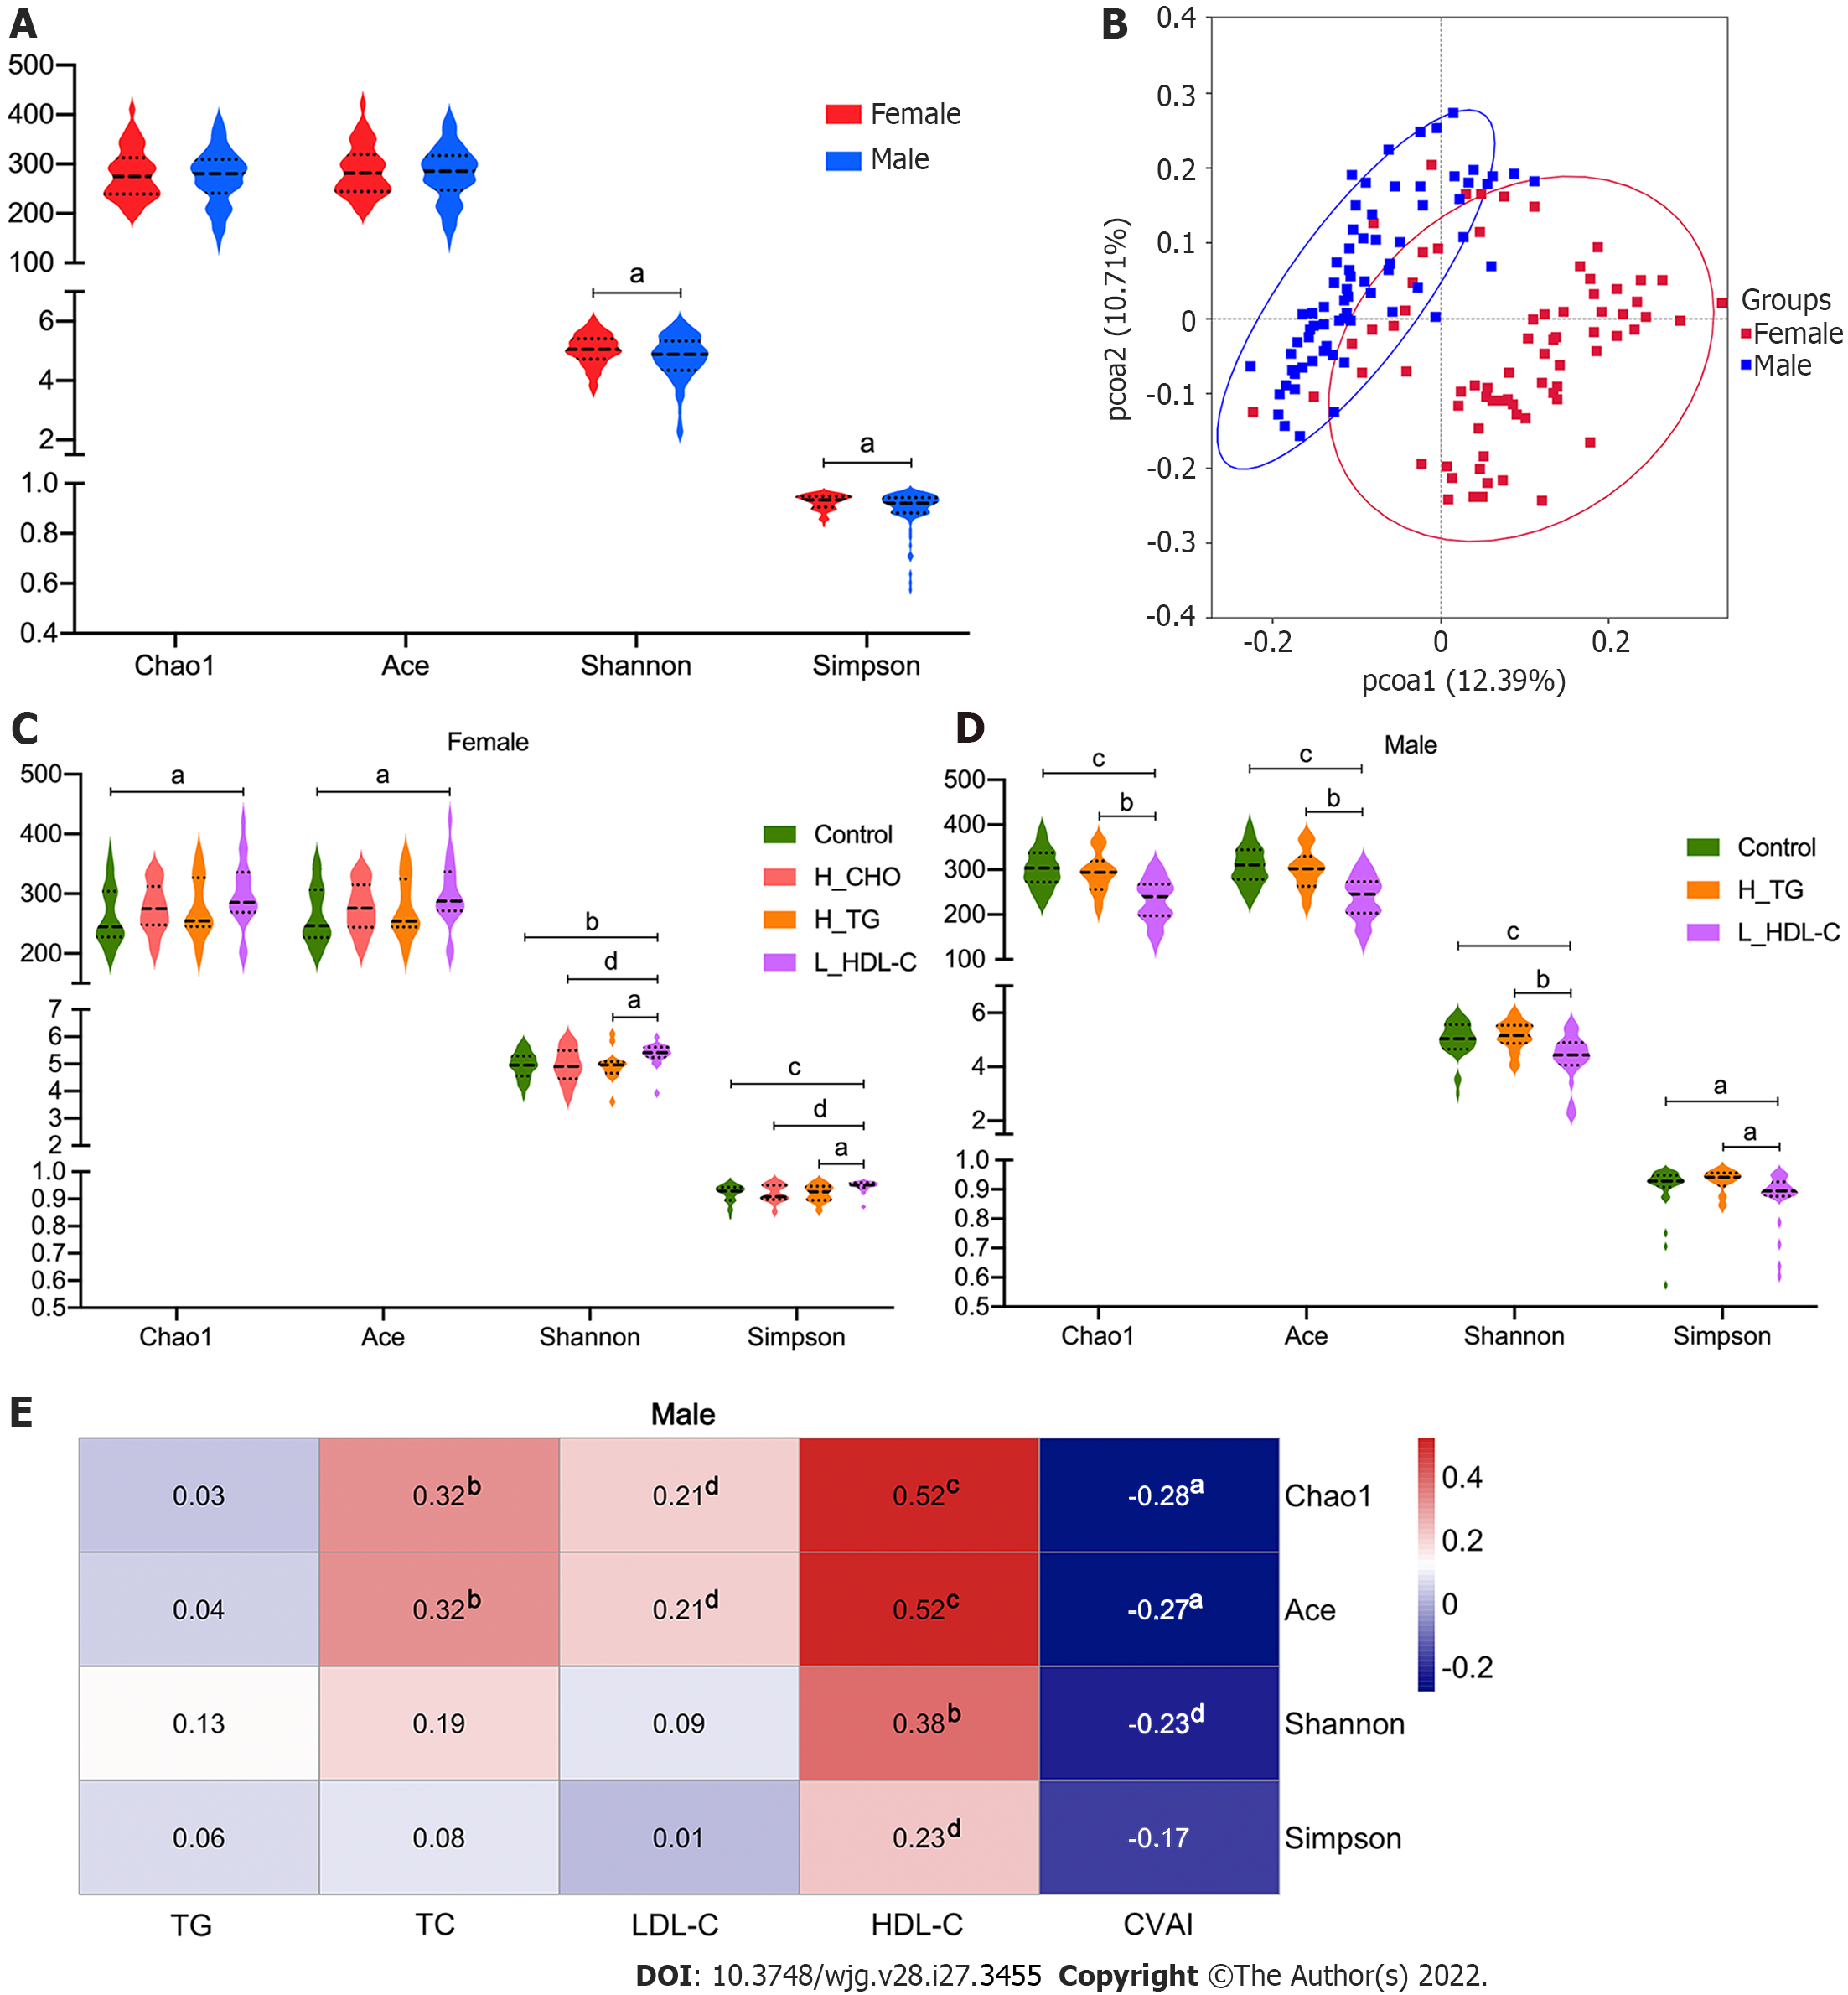
Figure 3 Diversity analysis of gut microbiota in the study population.
A: Violin plots of α-diversity analysis of gut microbiota (GM) in females and males of the study population. Each plot represents one index of the α-diversity distribution of GM, including Chao1, Ace, Shannon and Simpson indices, for each group. The Wilcoxon rank-sum test was used to evaluate the differences between groups; B: Plots of principal coordinate analysis (PCoA) based on the operational taxonomic unit level in females and males of the study population. Each square represents the GM community in one sample, and the axis title represents the percentage change of interpretation. The distance between squares represents the similarity or dissimilarity of the GM community in the study population, and PCoA analysis was conducted by unweighted UniFrac method; C: Violin plots of α-diversity analysis of GM in females of the study population; D: Violin plots of α-diversity analysis of GM in males of the study population; E: Correlations between GM diversity and serum lipid profiles in males of the study population. Spearman’s correlation analysis was conducted. The number presented in each cell is the correlation coefficient. The larger the absolute value is, the stronger the correlation is. Blue indicates a negative correlation and red indicates a positive correlation. The depth of the color represents the strength of the correlation. The deeper the color is, the stronger the correlation is. aP < 0.05, bP < 0.01, cP < 0.001, dP < 0.1. TG: Triglyceride; TC: Total cholesterol; LDL-C: Low-density lipoprotein cholesterol; HDL-C: High-density lipoprotein cholesterol; CVAI: Chinese visceral adiposity index; H_CHO: High total cholesterol; H_TG: high triglyceride; L_HDL-C: Low high-density lipoprotein cholesterol.
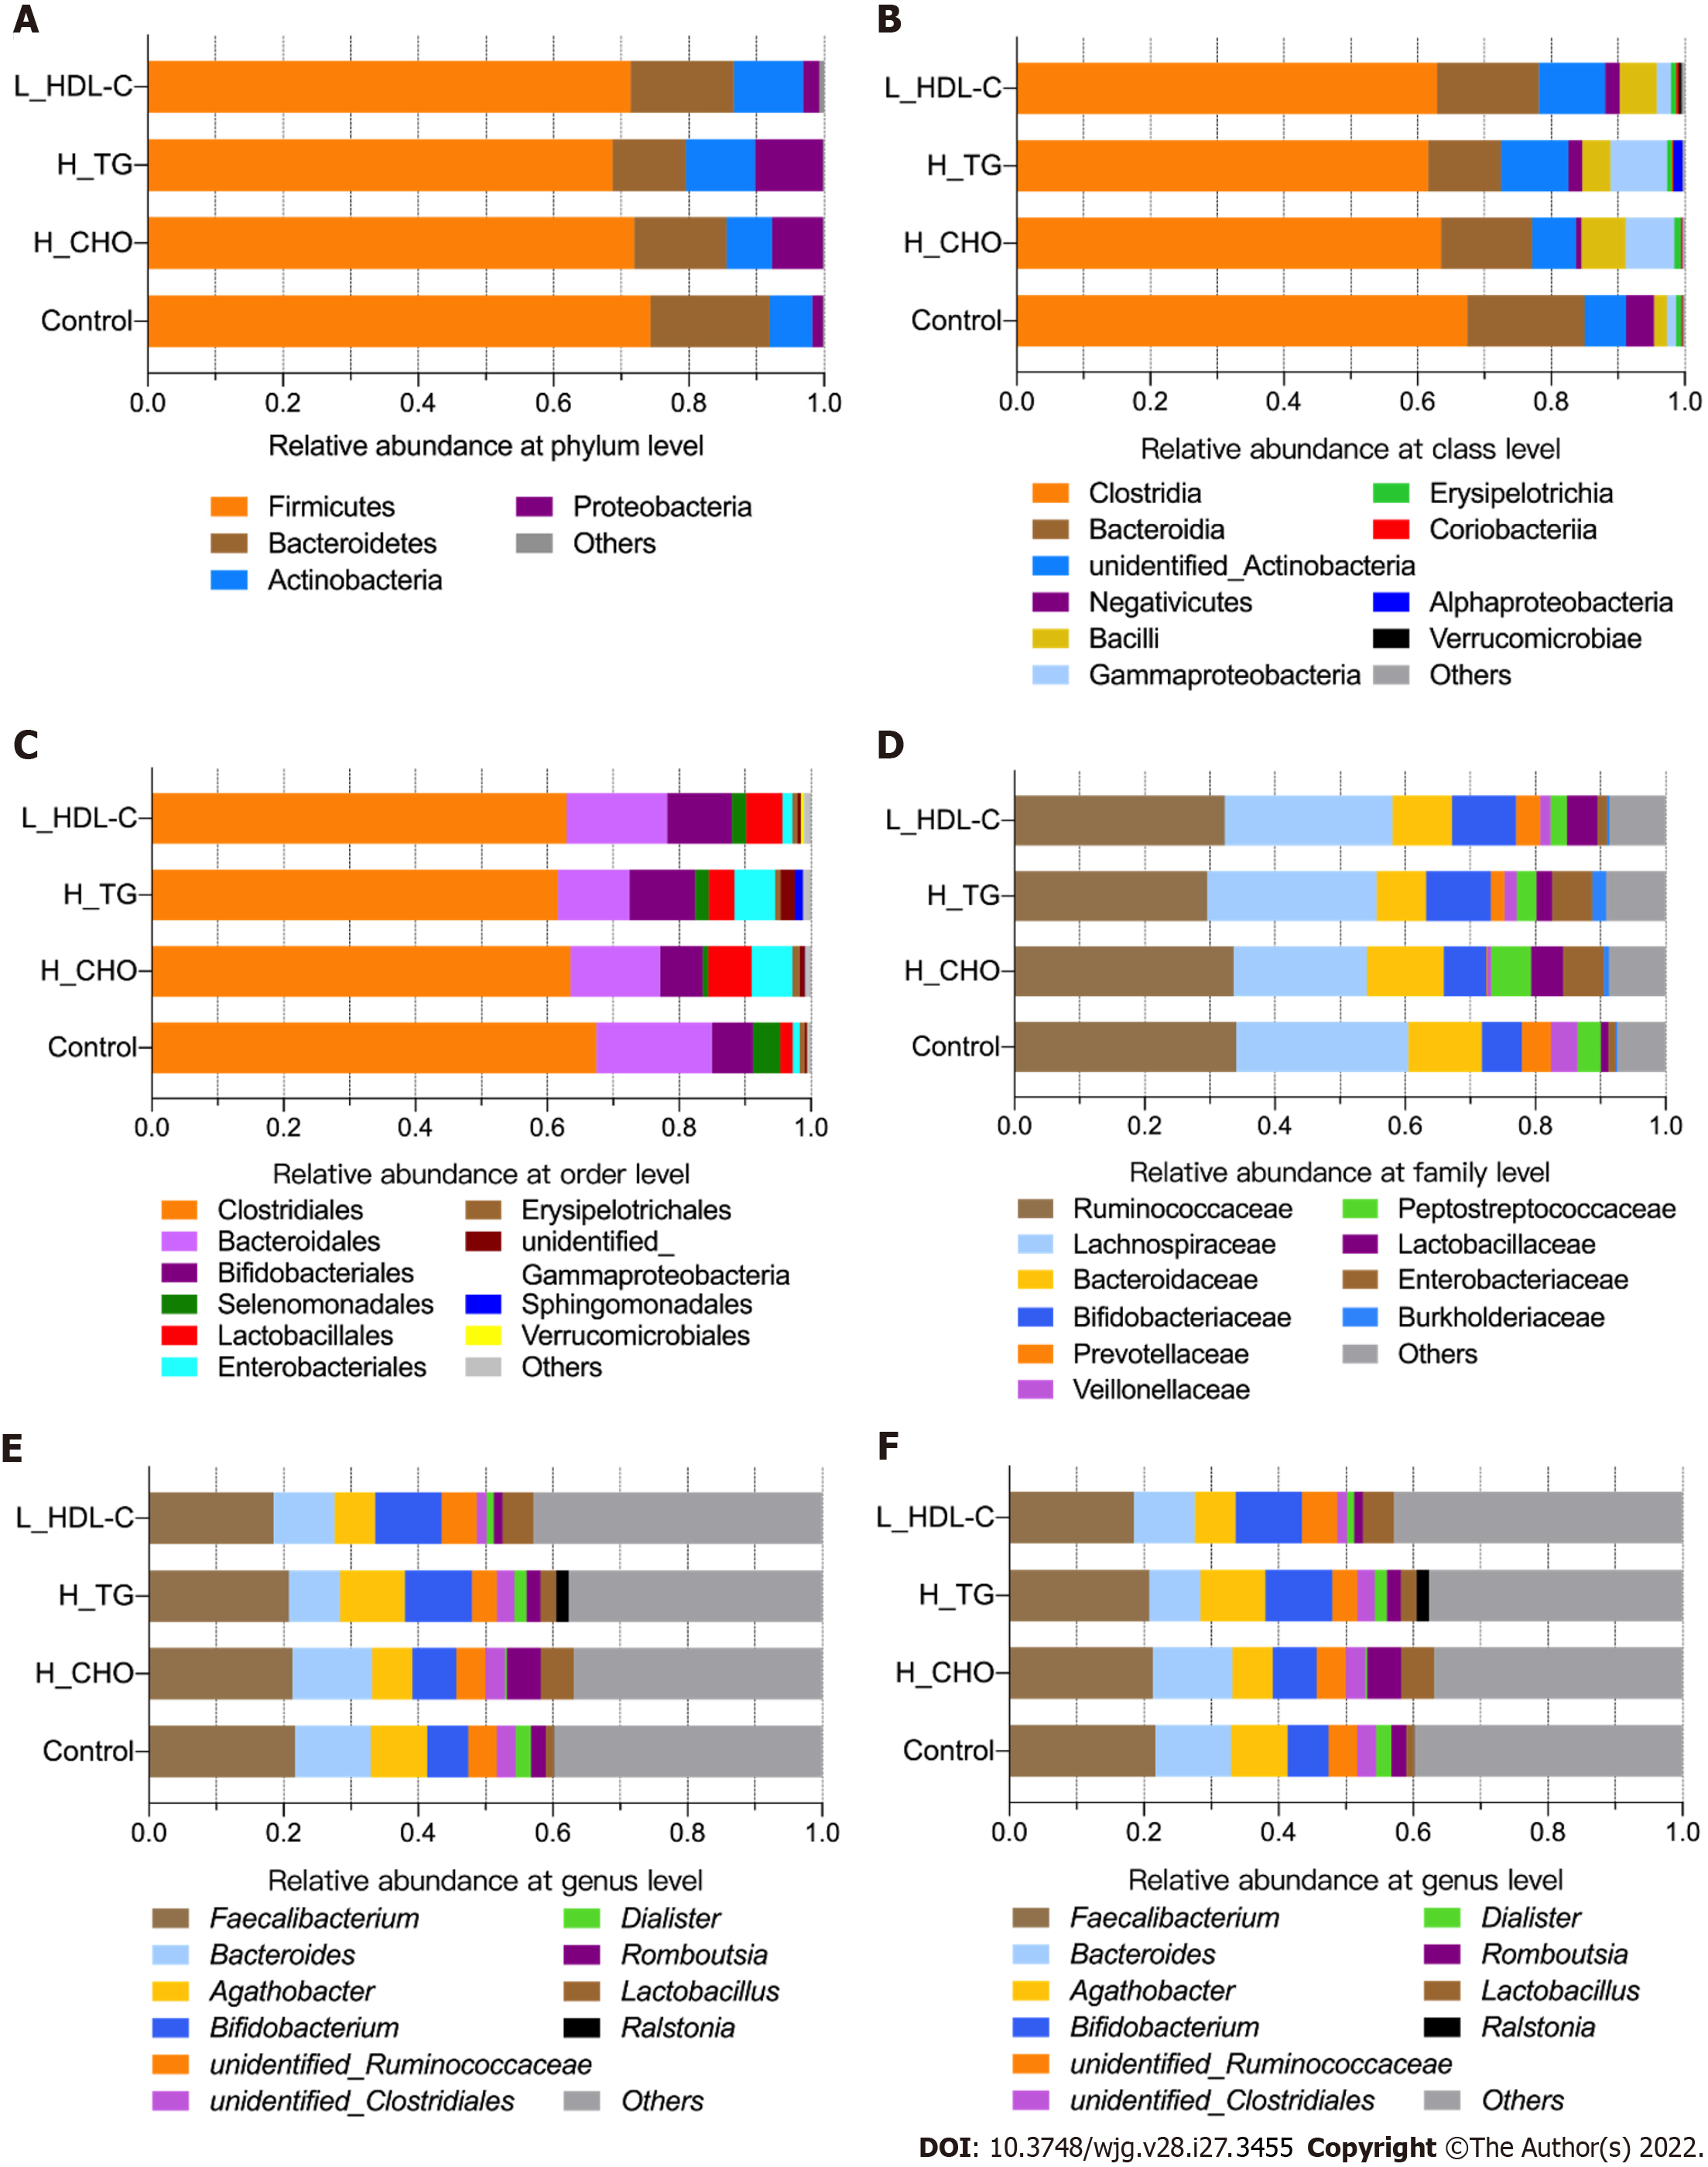
Figure 4 The taxonomic composition of gut microbiota in females of the study population.
Bar plots show the relative abundances of the top ten taxa at the six taxonomic levels, including phyla, class, orders, family, genus and species, in females. Each component of the cumulative bar chart indicates a phylum, a class, an order, a family, a genus or a species. A: Relative abundance at phylum level; B: Relative abundance at class level; C: Relative abundance at order level; D: Relative abundance at family level; E: Relative abundance at genus level; F: Relative abundance at species level. H_CHO: High total cholesterol; H_TG: high triglyceride; L_HDL-C: Low high-density lipoprotein cholesterol.
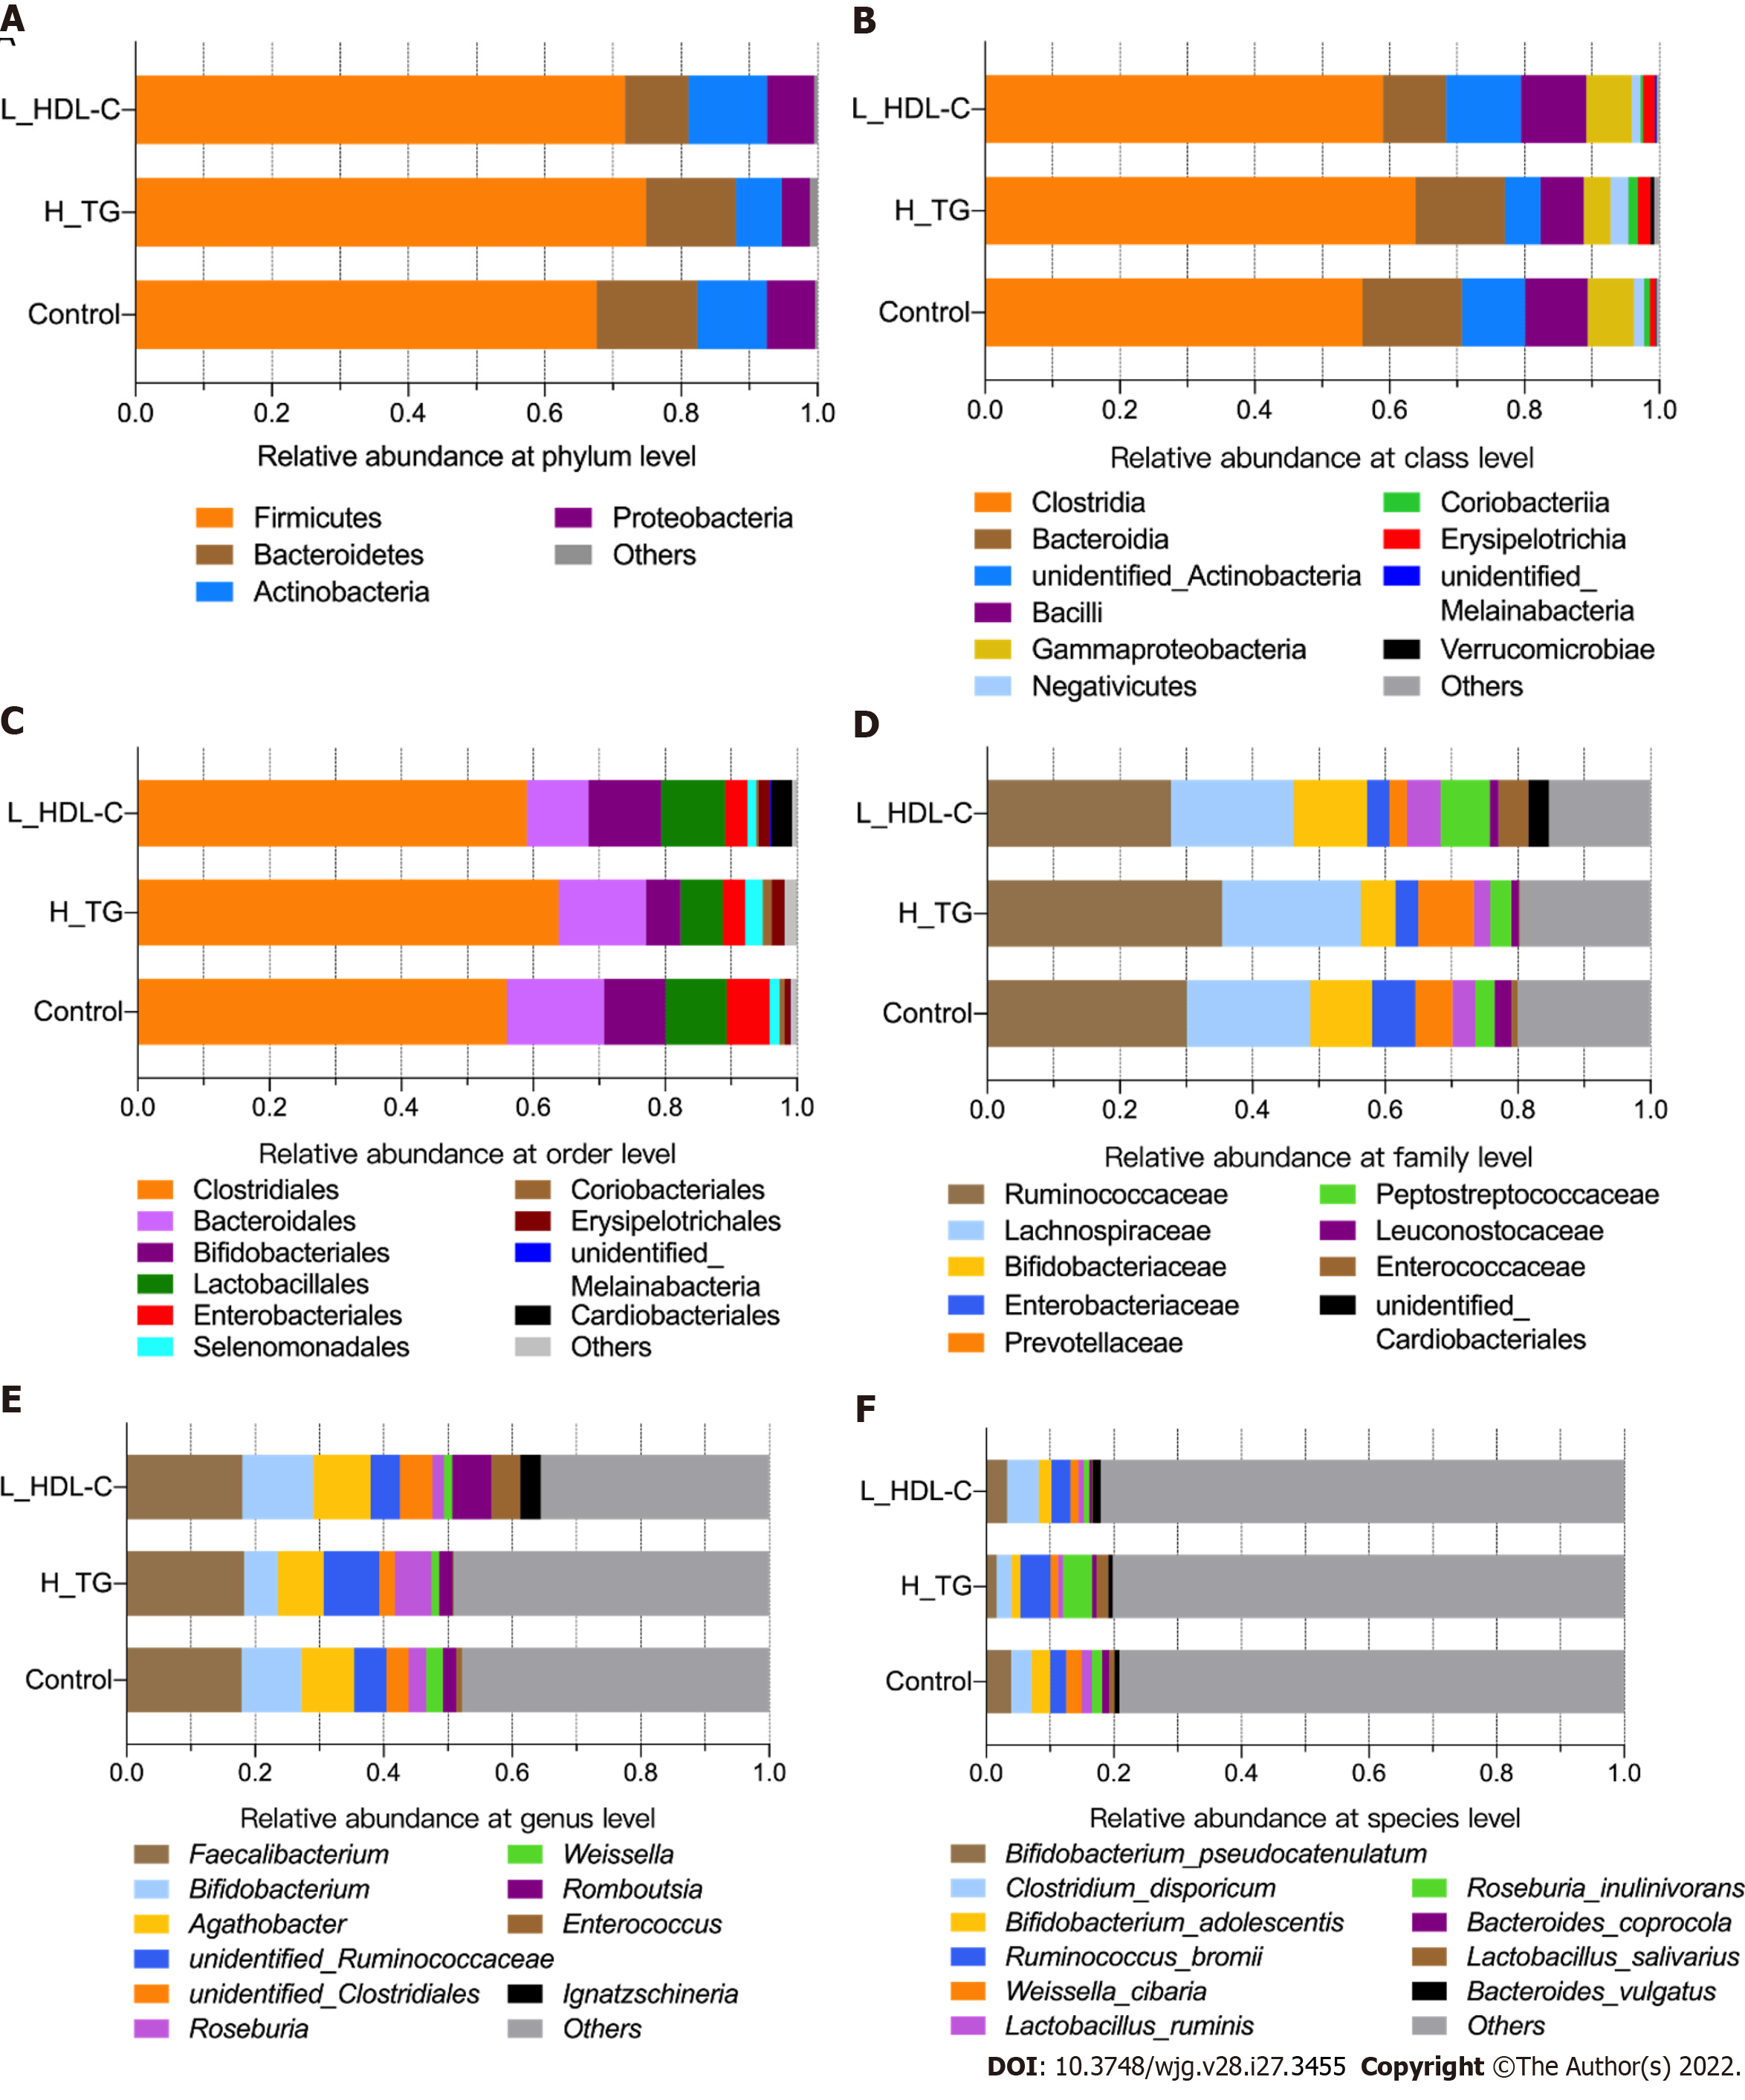
Figure 5 The taxonomic composition of gut microbiota in males of the study population.
Bar plots show the relative abundances of the top ten taxa at the six taxonomic levels, including phyla, class, orders, family, genus and species, in males. Each component of the cumulative bar chart indicates a phylum, a class, an order, a family, a genus or a species. A: Relative abundance at phylum level; B: Relative abundance at class level; C: Relative abundance at order level; D: Relative abundance at family level; E: Relative abundance at genus level; F: Relative abundance at species level. H_TG: high triglyceride; L_HDL-C: Low high-density lipoprotein cholesterol.
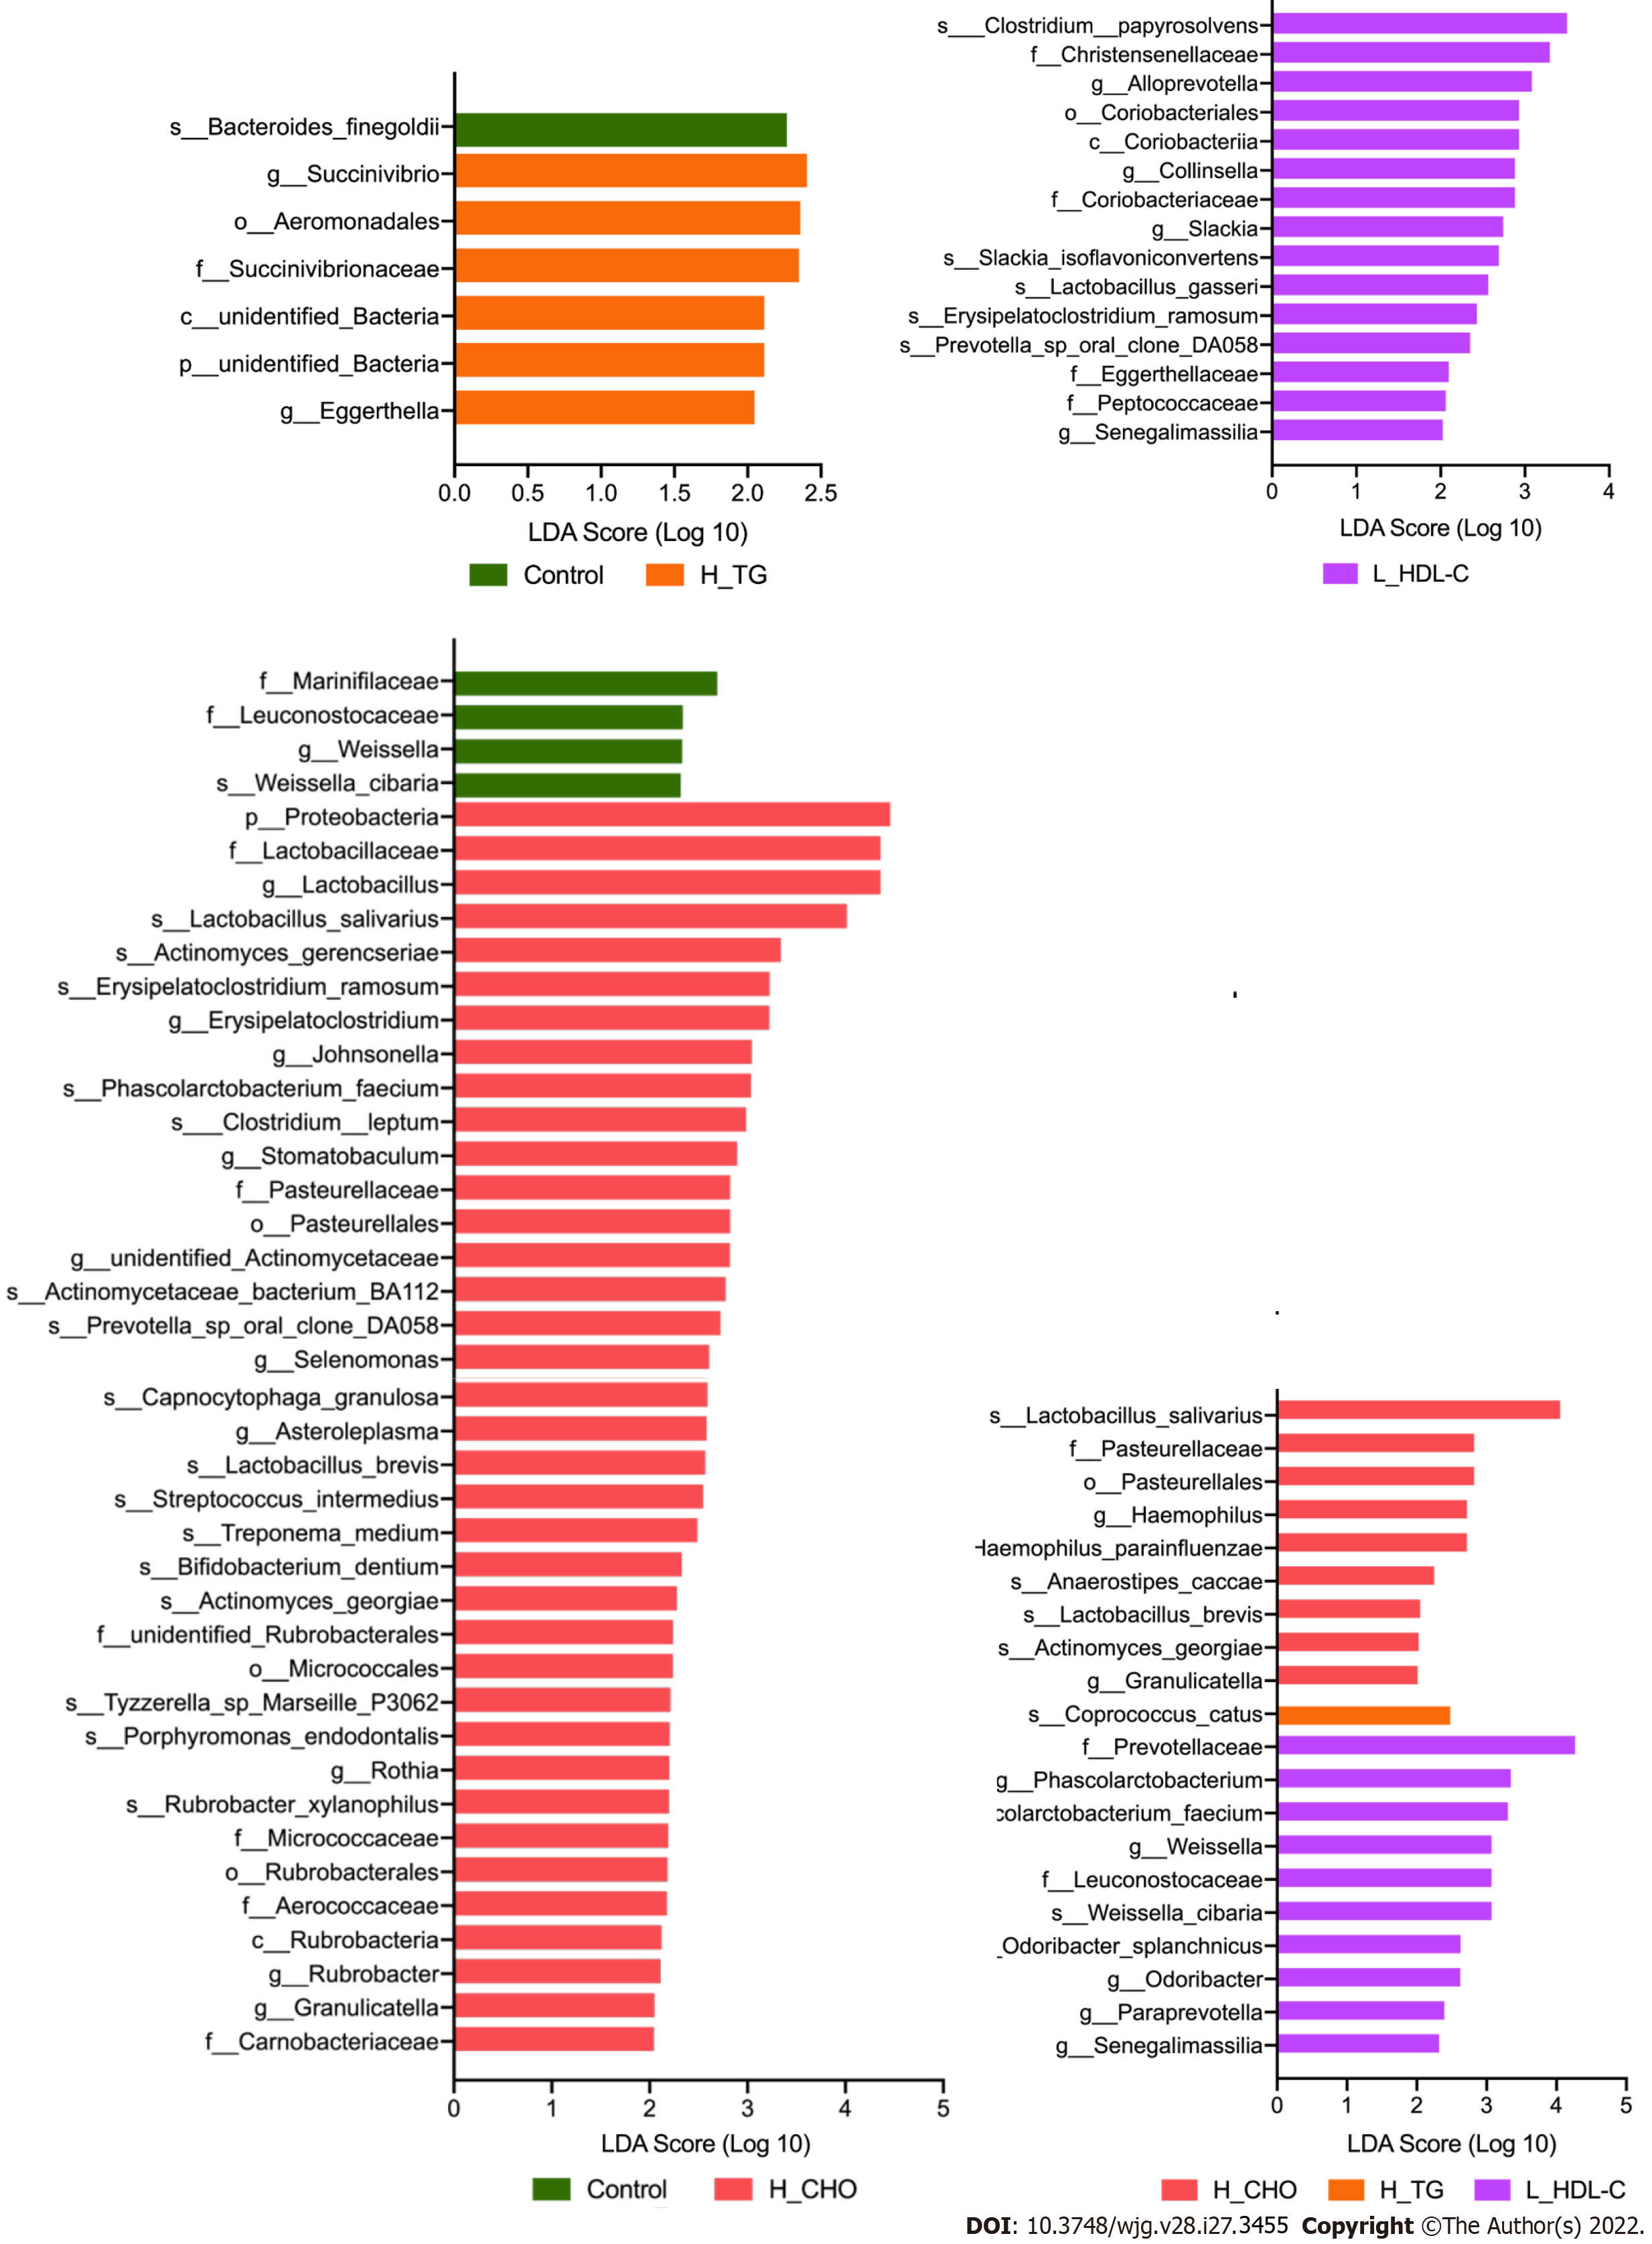
Figure 6 Linear discriminant analysis effect size analysis in females of the study population.
Linear discriminant analysis (LDA) scores indicate differentially represented gut microbiota taxa (biomarkers) in each female subgroups. The length of each bar represents the LDA score format with log 10, and the logarithmic threshold for discriminative features was set to 2.0. H_CHO: High total cholesterol; H_TG: high triglyceride; L_HDL-C: Low high-density lipoprotein cholesterol.
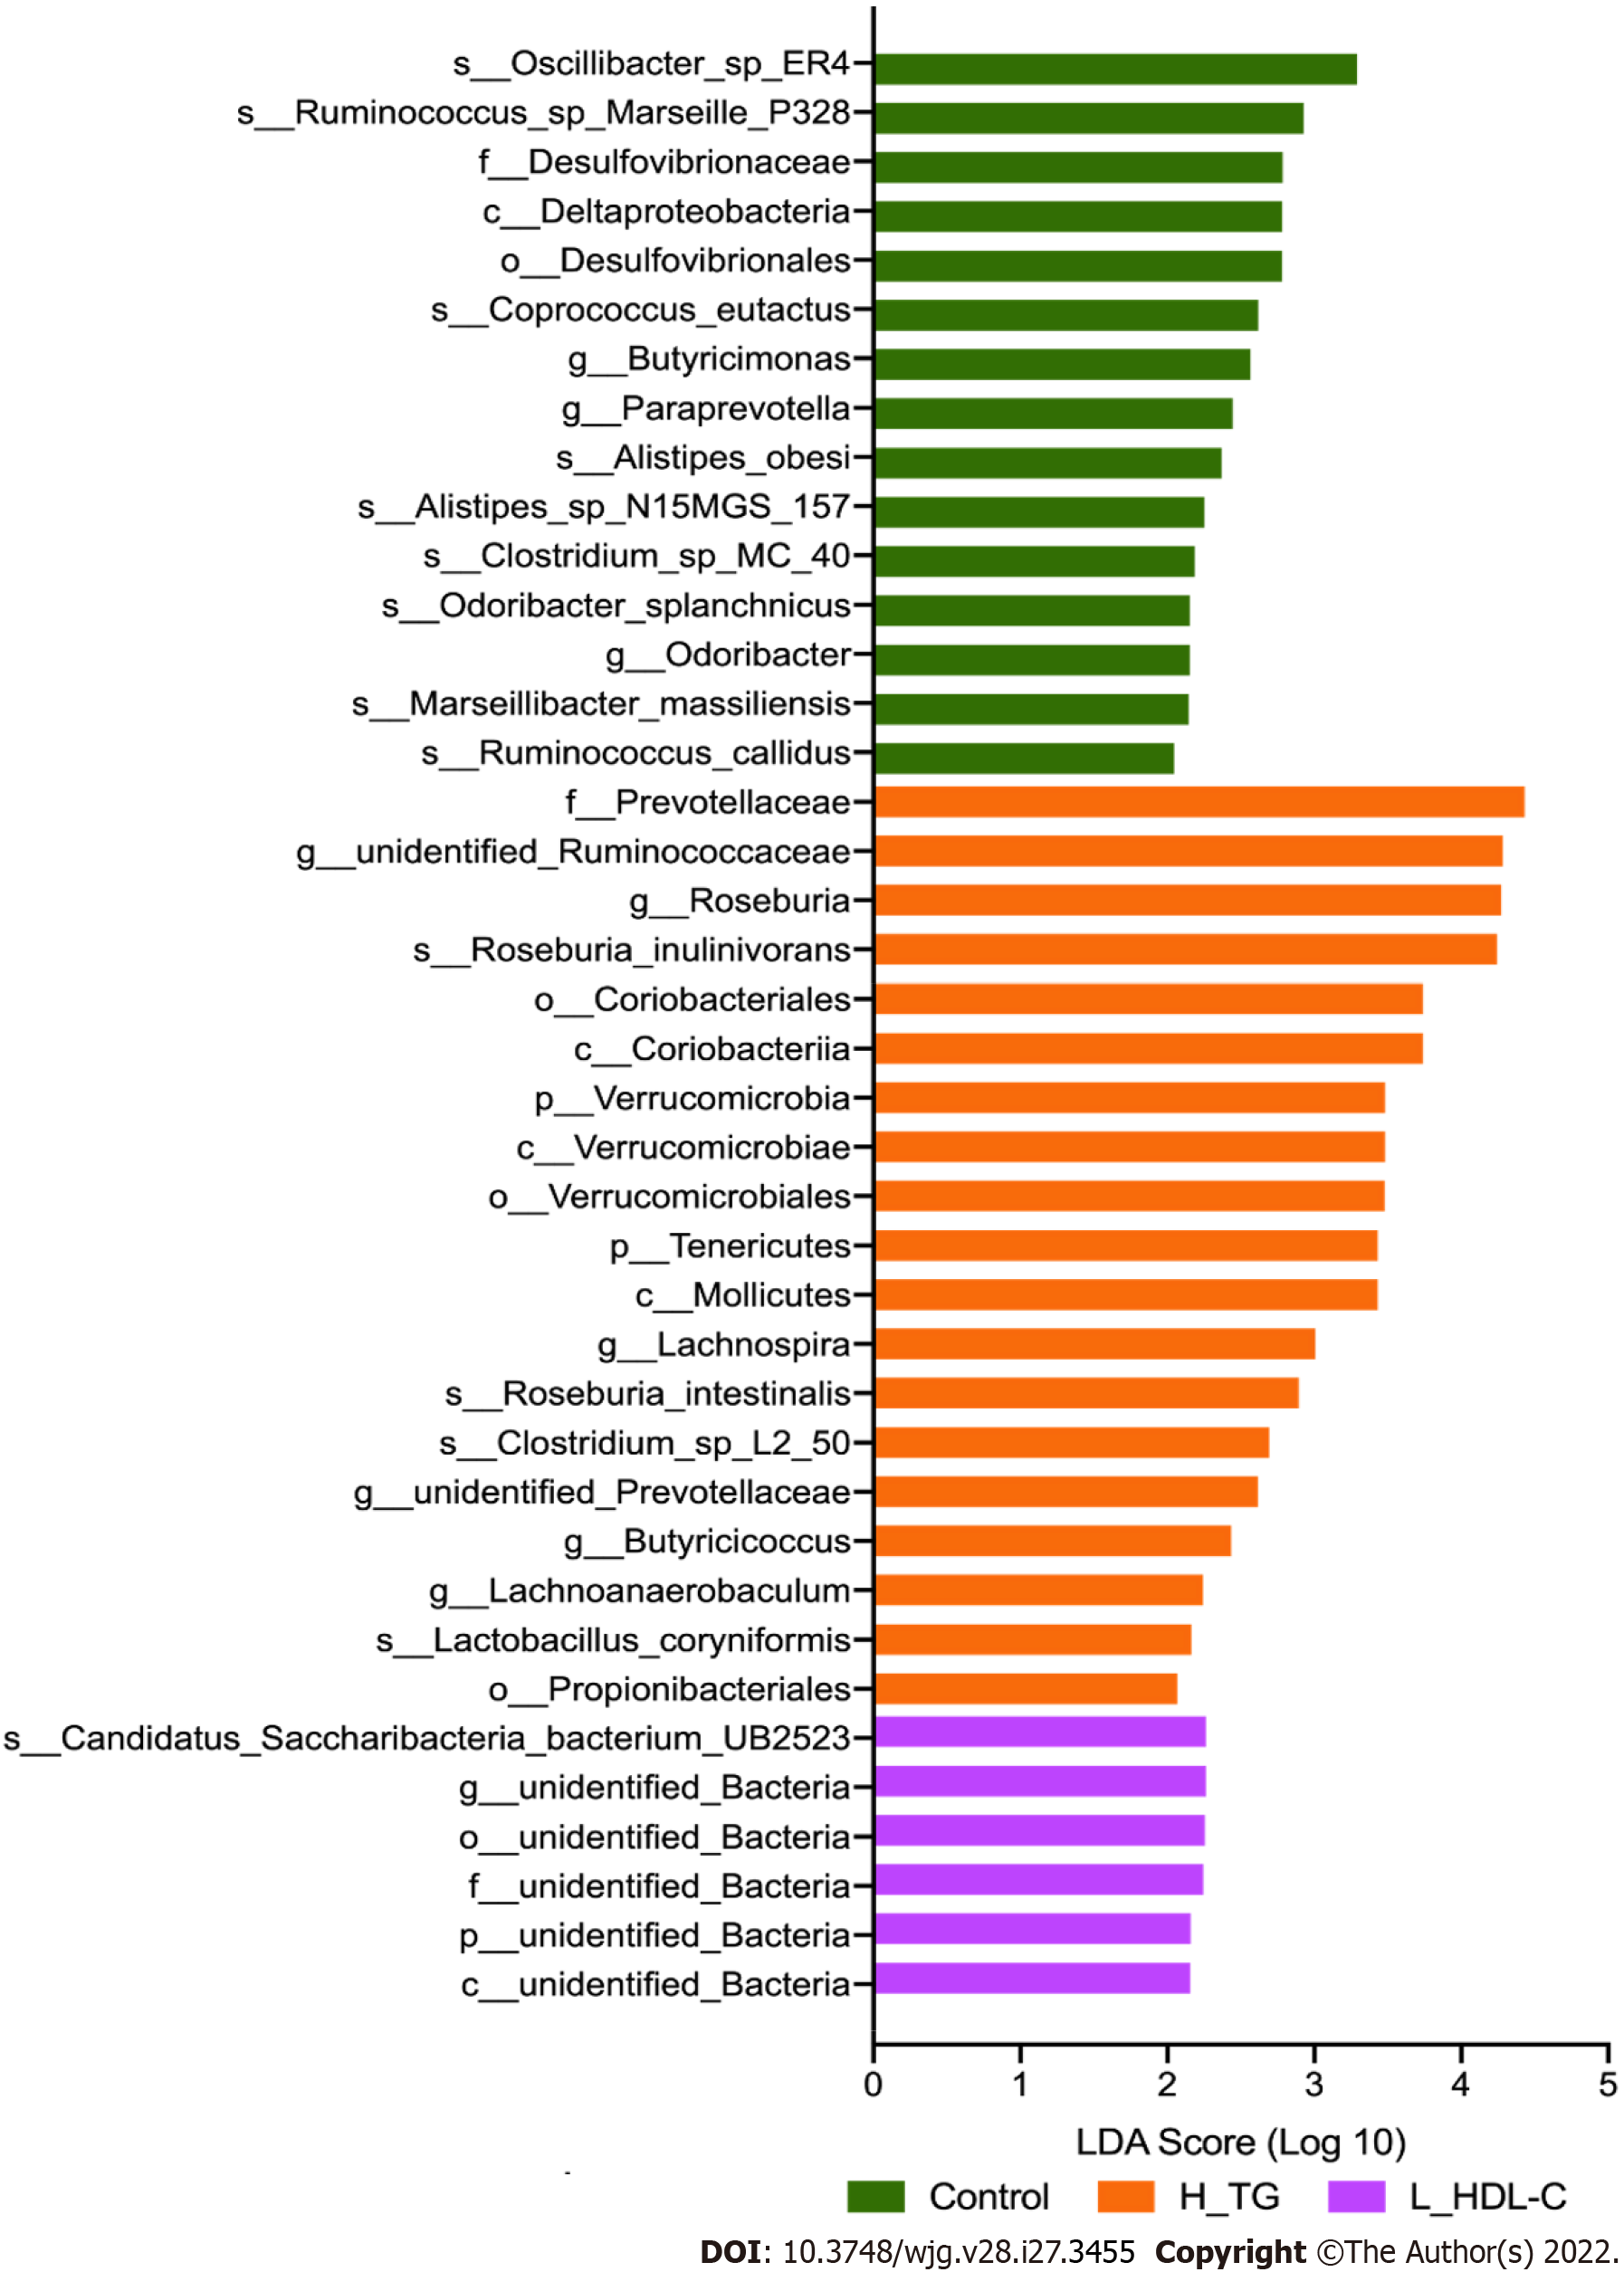
Figure 7 Linear discriminant analysis effect size analysis in males of the study population.
Linear discriminant analysis (LDA) scores indicate differentially represented gut microbiota taxa (biomarkers) in each male subgroups. The length of each bar represents the LDA score format with log 10, and the logarithmic threshold for discriminative features was set to 2.0. H_TG: high triglyceride; L_HDL-C: Low high-density lipoprotein cholesterol.
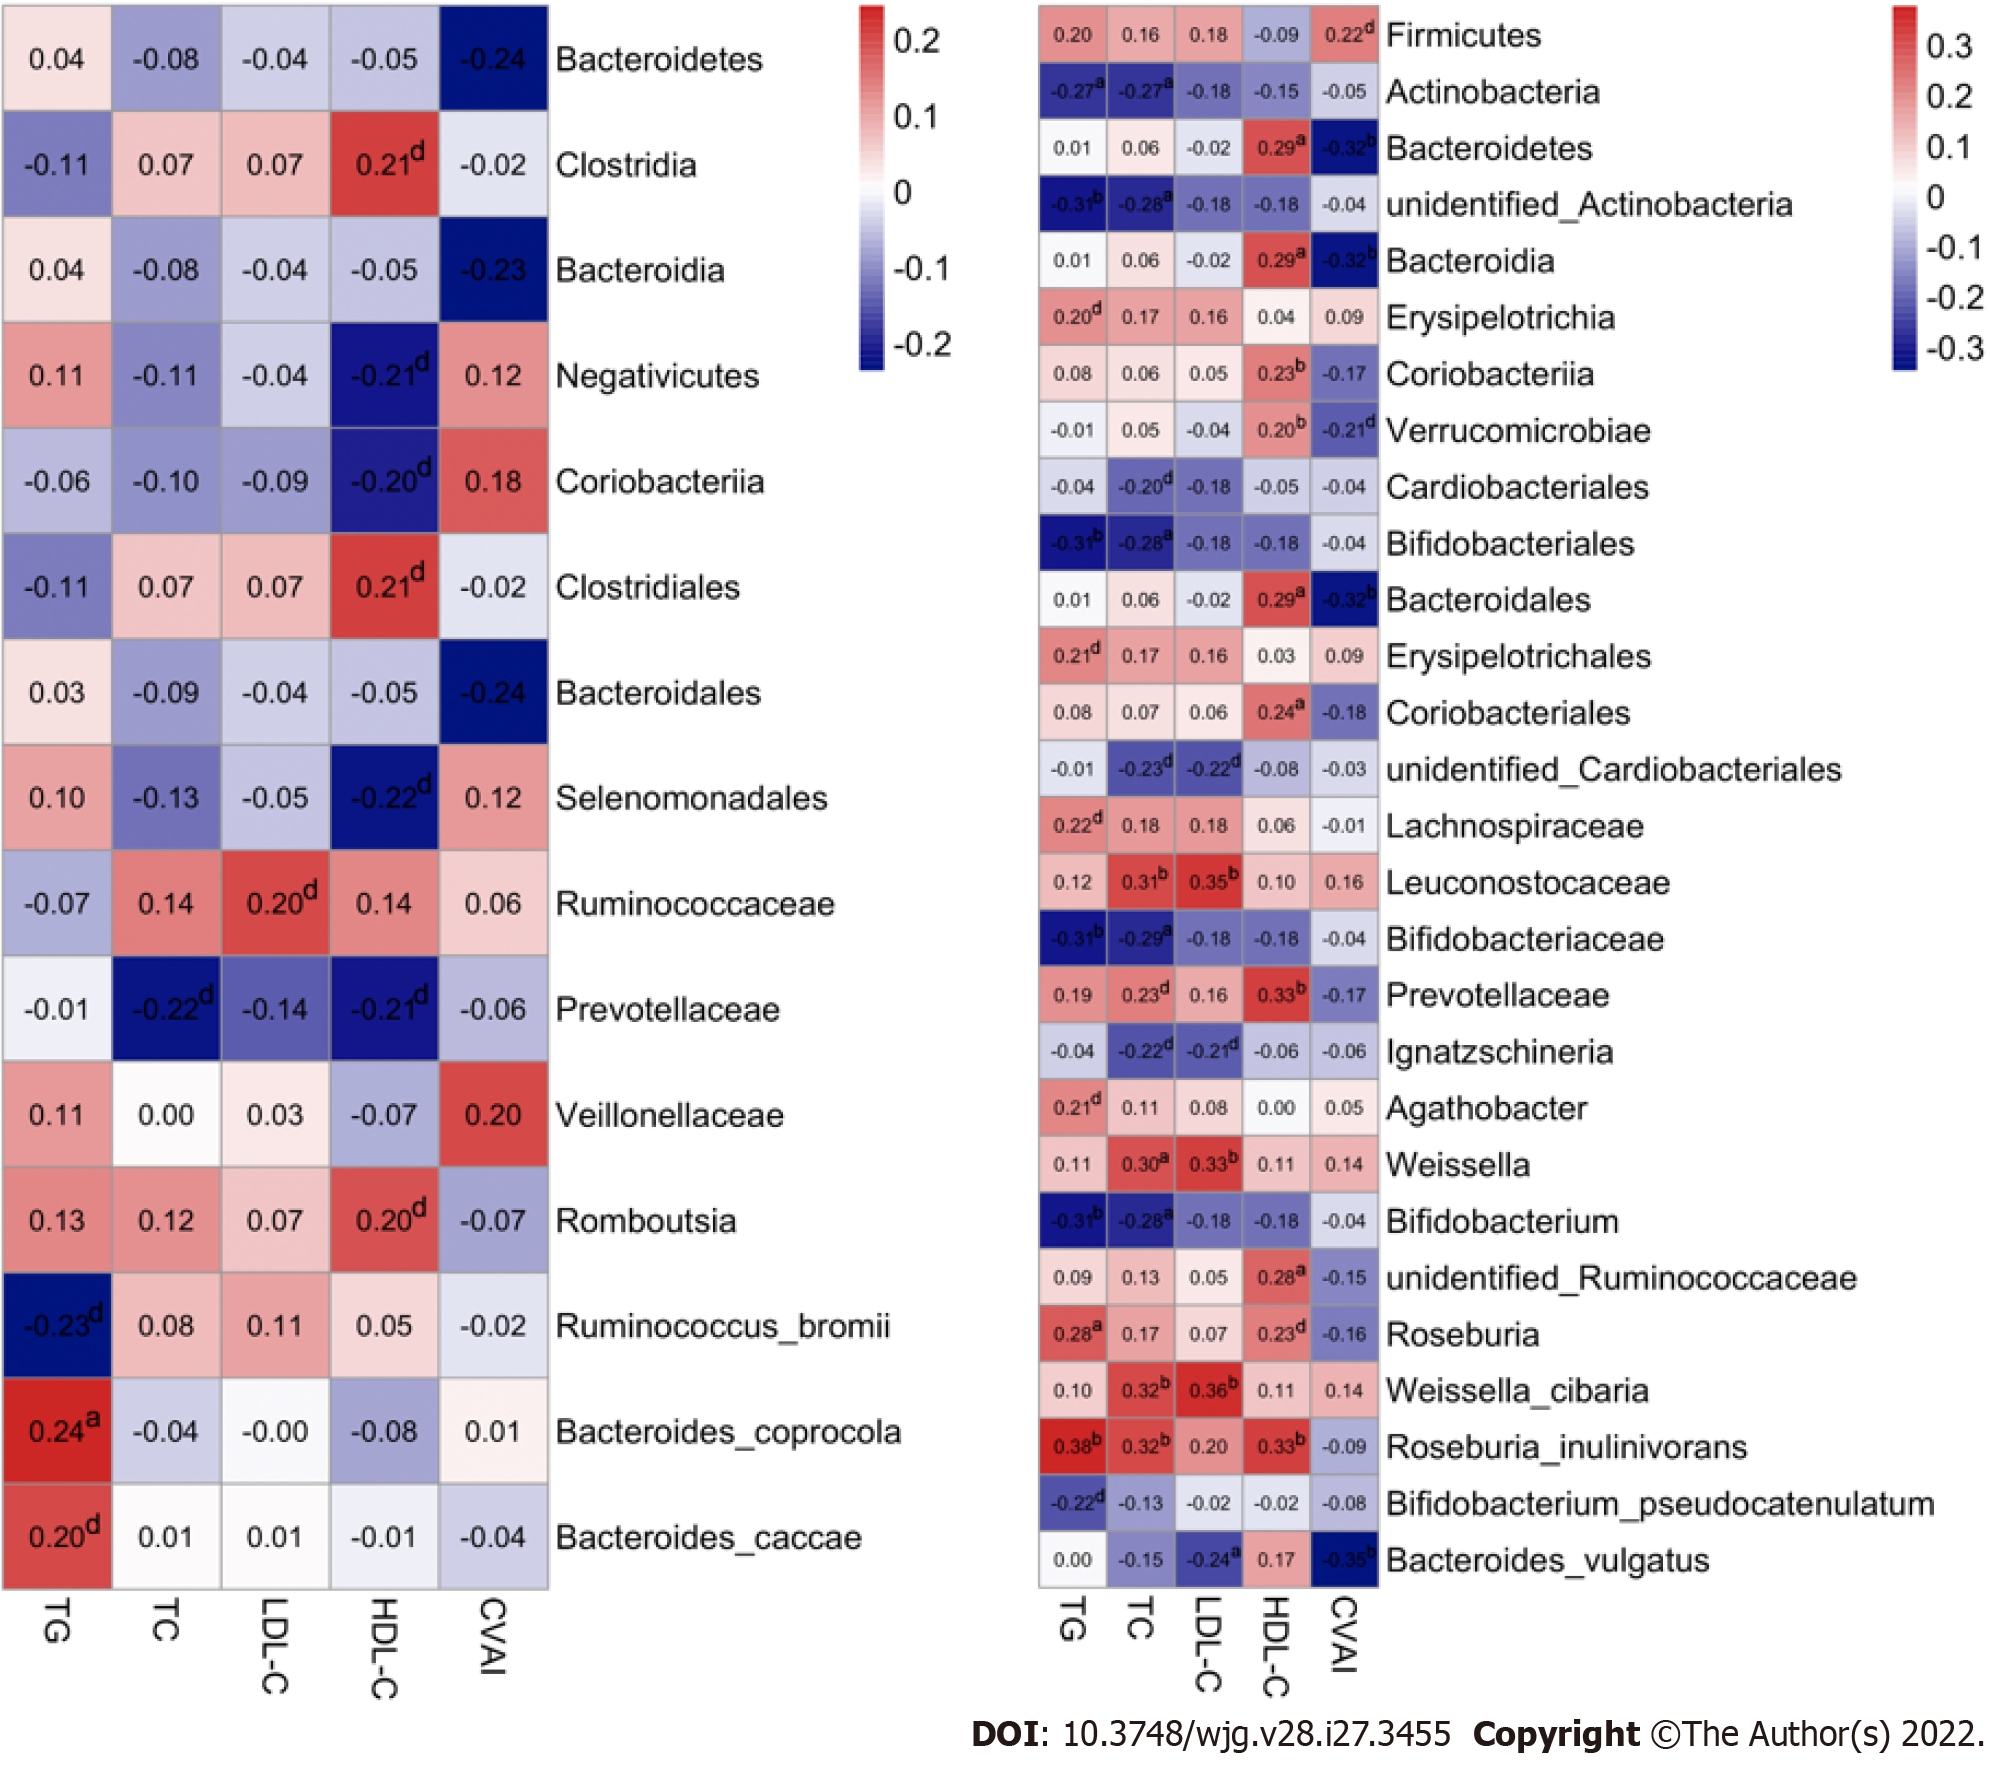
Figure 8 Associations of gut microbiota taxa with serum lipid indicators in the study population.
A: Correlations of gut microbiota (GM) taxa with serum lipid indicators in females. Spearman’s correlation analysis was conducted. The number presented in each cell is the correlation coefficient. The larger the absolute value is, the stronger the correlation is. Blue indicates a negative correlation and red indicates a positive correlation. The depth of the color represents the strength of the correlation. The deeper the color is, the stronger the correlation is; B: Correlations of GM taxa with serum lipid indicators in males. aP < 0.05, bP < 0.01, dP < 0.1. TG: Triglyceride; TC: Total cholesterol; LDL-C: Low-density lipoprotein cholesterol; HDL-C: High-density lipoprotein cholesterol; CVAI: Chinese visceral adiposity index.
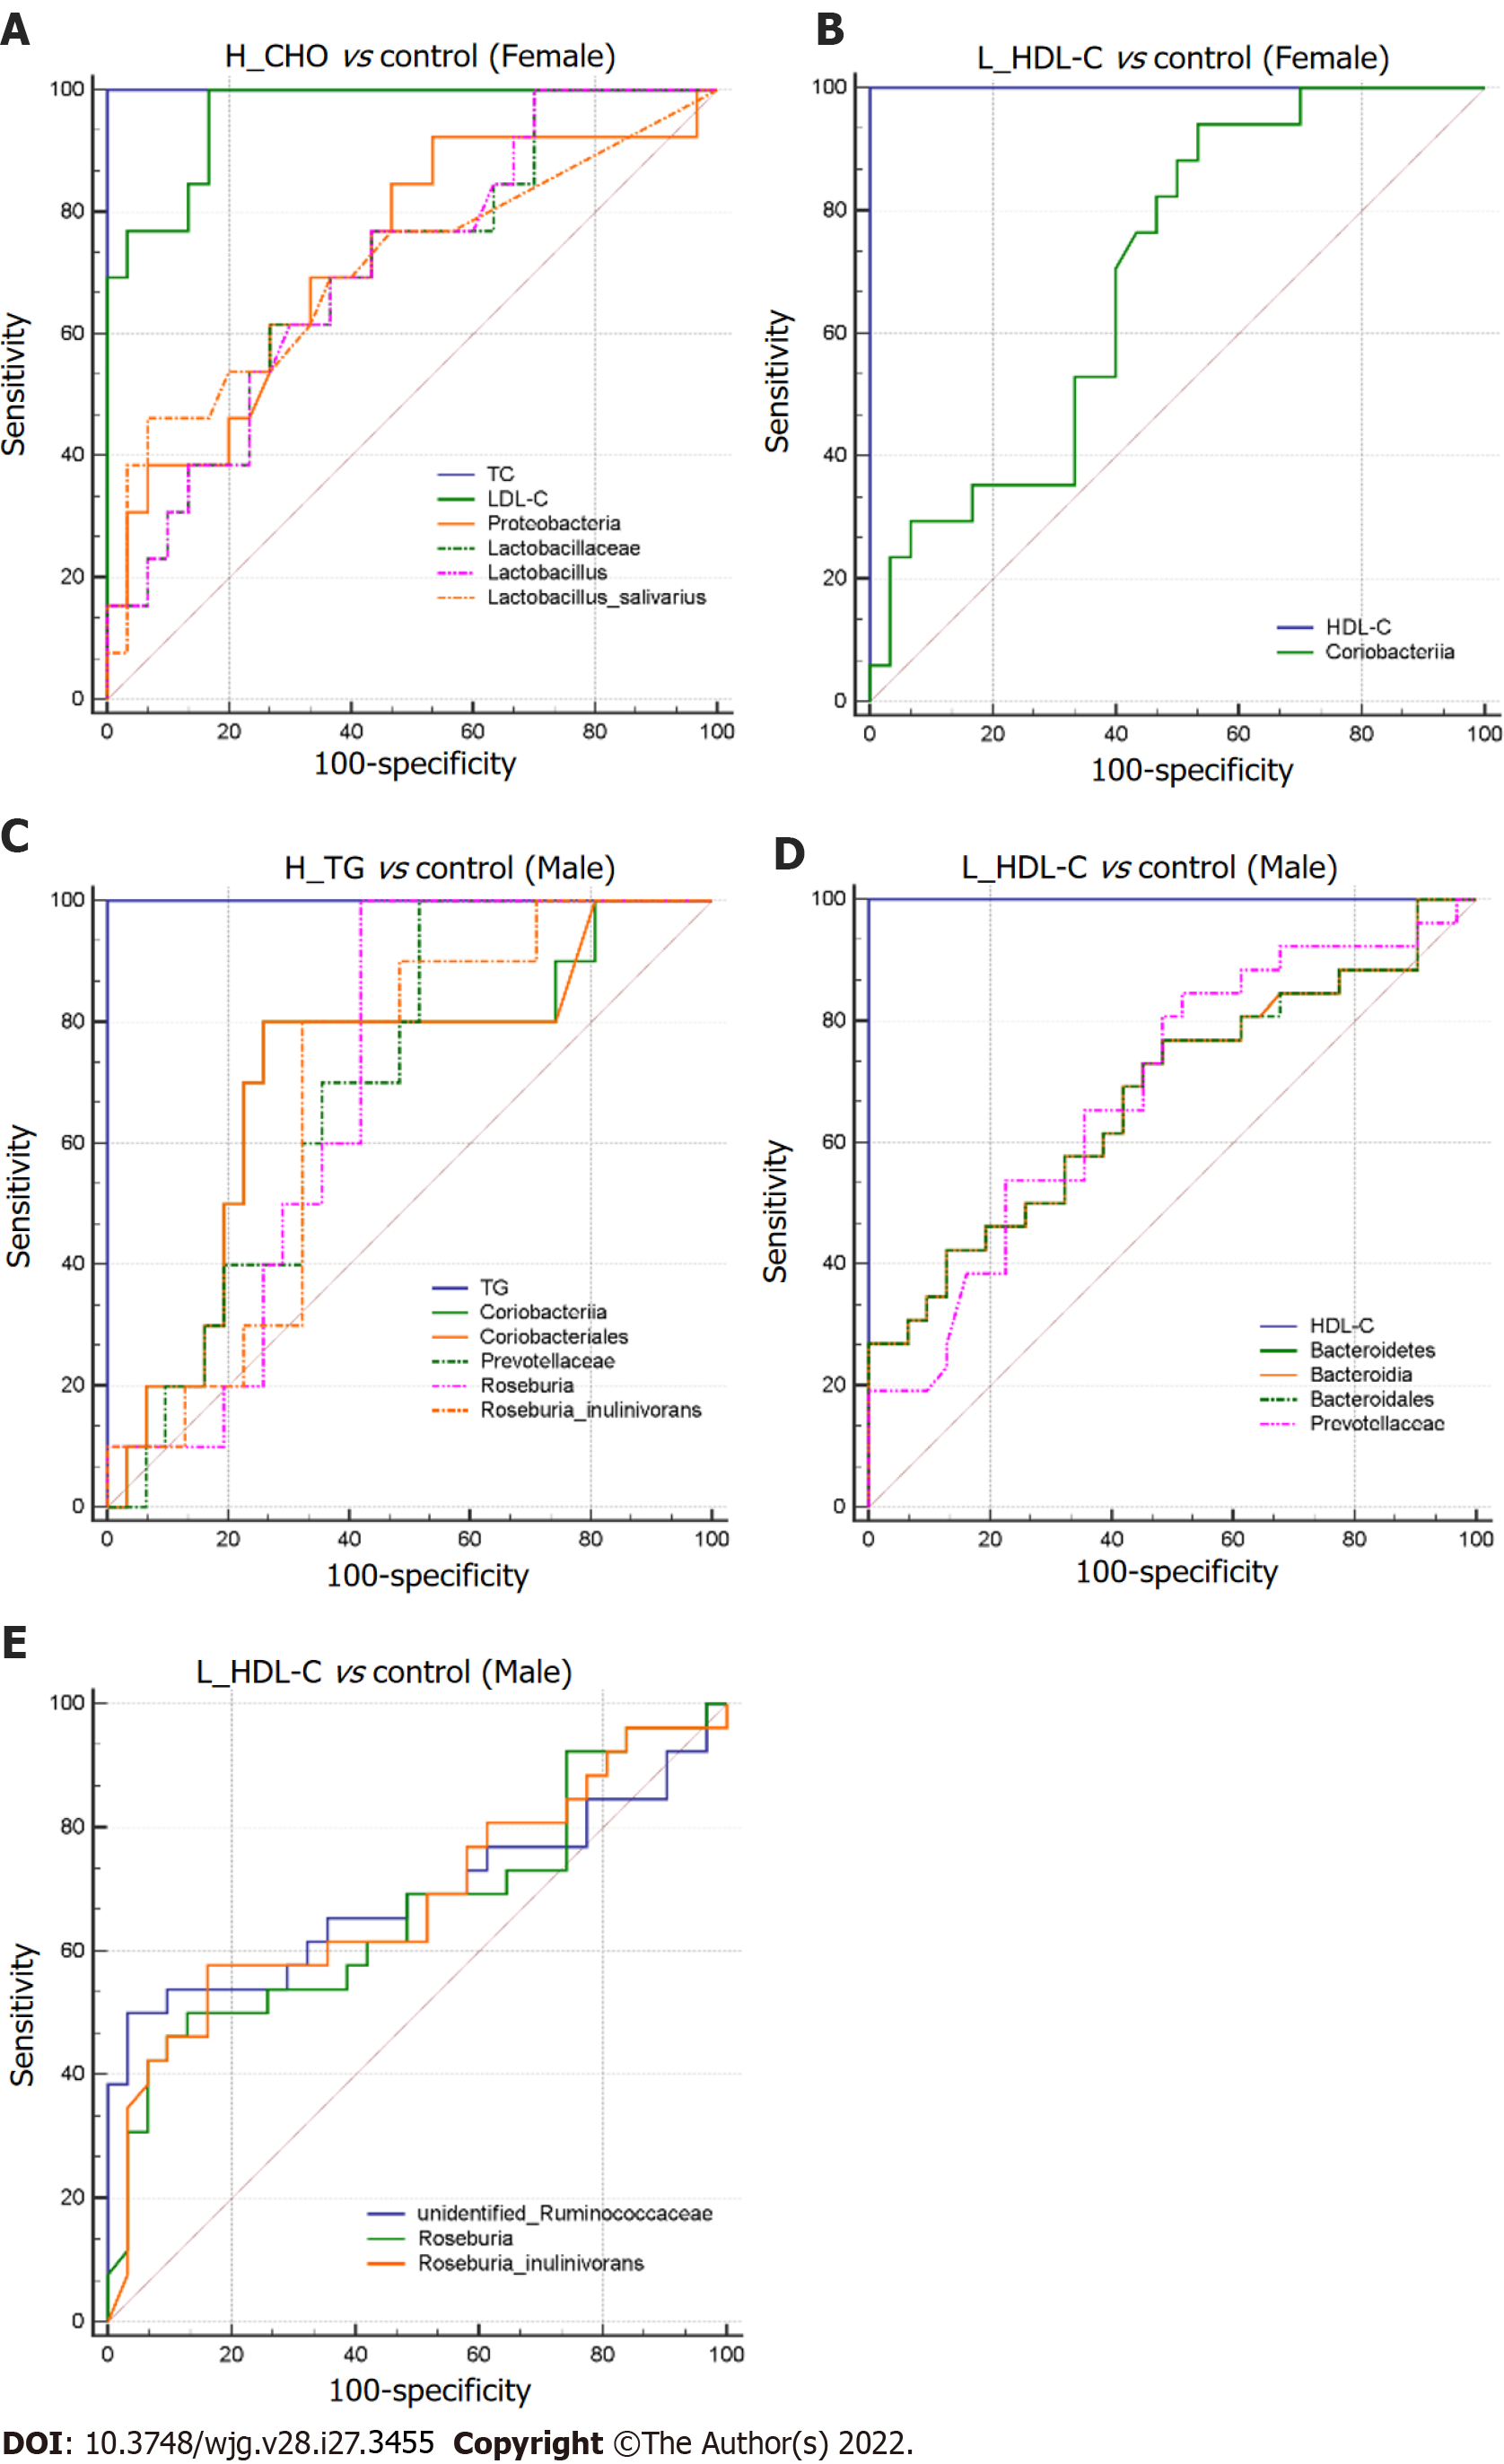
Figure 9 Differential gut microbiota taxa-based classification of dyslipidemia in the study population.
Receiver operating characteristic curve analysis for identifying dyslipidemia subgroup from controls by gut microbiota taxa in females and males. A: High total cholesterol vs control (Female); B: Low high-density lipoprotein cholesterol (L_HDL-C) vs control (Female); C: High triglyceride vs control (Male); D and E: L_HDL-C vs control (Male). H_CHO: High total cholesterol; H_TG: high triglyceride; L_HDL-C: Low high-density lipoprotein cholesterol.
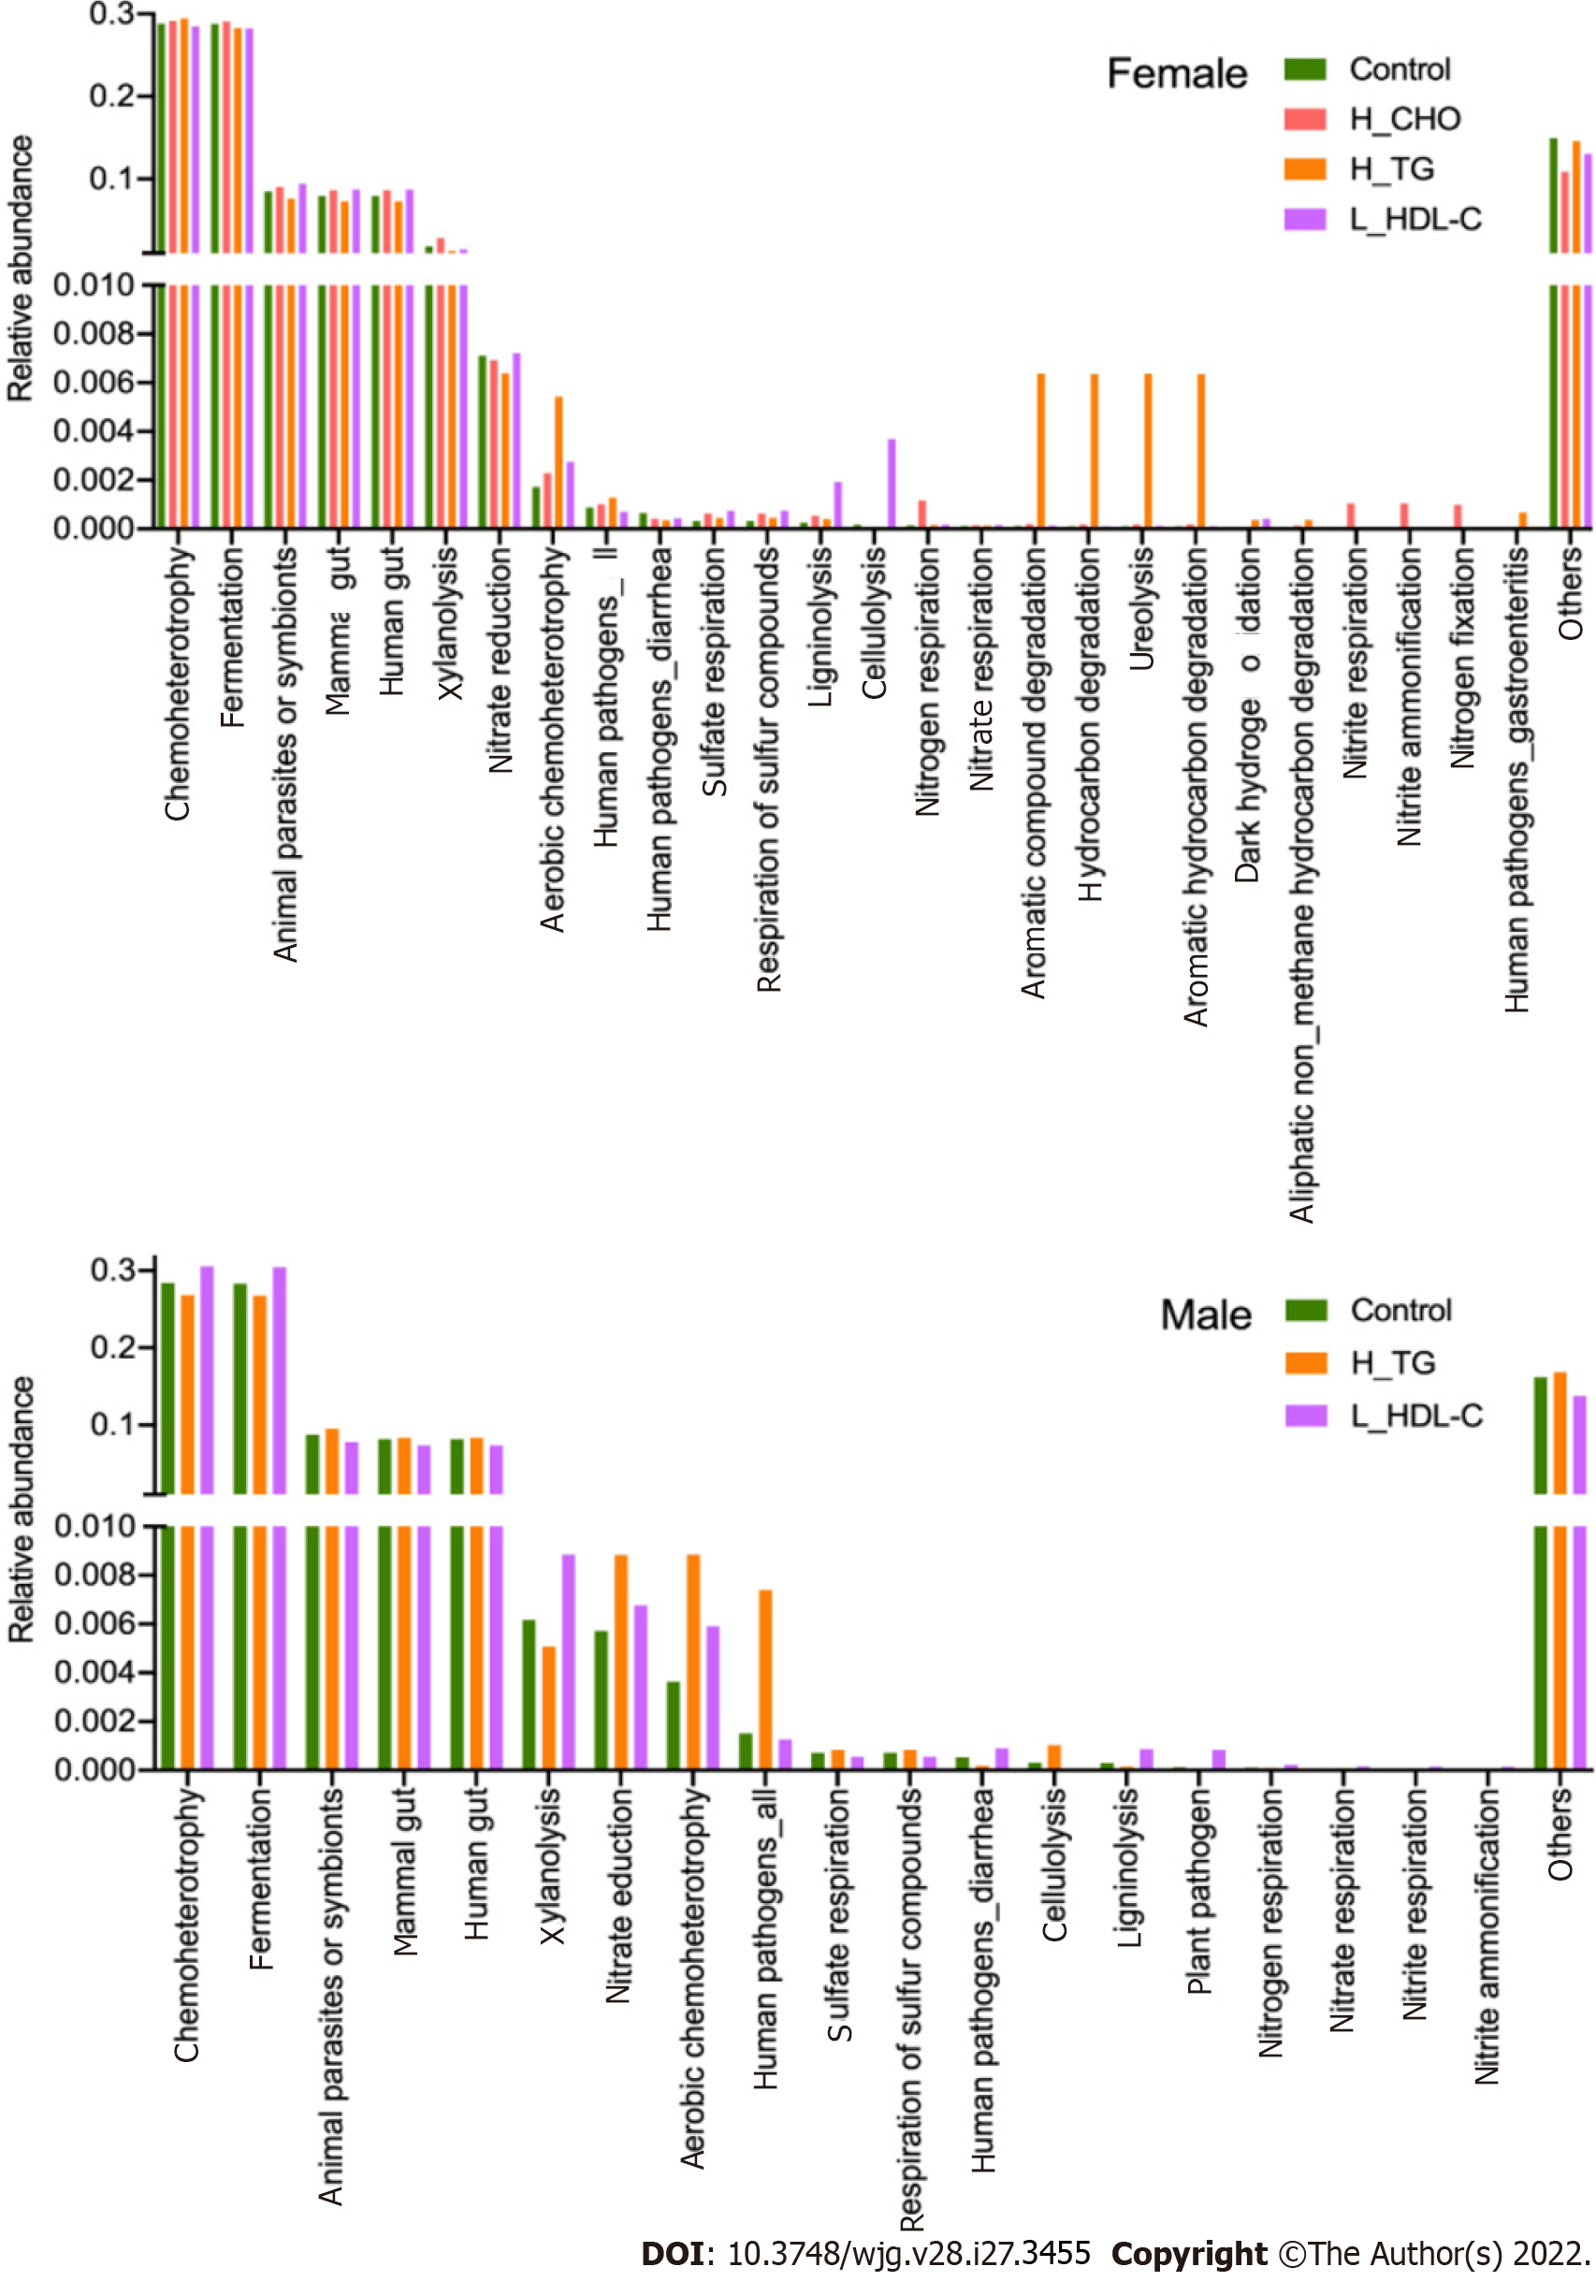
Figure 10 The main functional annotations of gut microbiota in the study population.
Bar plots show the relative abundances of top twenty annotated functions with higher relative abundances in female subgroups and male subgroups, respectively, using the FAPROTAX database. H_CHO: High total cholesterol; H_TG: high triglyceride; L_HDL-C: Low high-density lipoprotein cholesterol.
- Citation: Guo L, Wang YY, Wang JH, Zhao HP, Yu Y, Wang GD, Dai K, Yan YZ, Yang YJ, Lv J. Associations of gut microbiota with dyslipidemia based on sex differences in subjects from Northwestern China. World J Gastroenterol 2022; 28(27): 3455-3475
- URL: https://www.wjgnet.com/1007-9327/full/v28/i27/3455.htm
- DOI: https://dx.doi.org/10.3748/wjg.v28.i27.3455


