Copyright
©The Author(s) 2020.
World J Gastroenterol. Mar 28, 2020; 26(12): 1298-1316
Published online Mar 28, 2020. doi: 10.3748/wjg.v26.i12.1298
Published online Mar 28, 2020. doi: 10.3748/wjg.v26.i12.1298
Figure 1 Volcano map of differentially expressed RNAs in the Cancer Genome Atlas database.
The upregulated and downregulated RNAs are shown as red and green spots, respectively (P < 0.05).
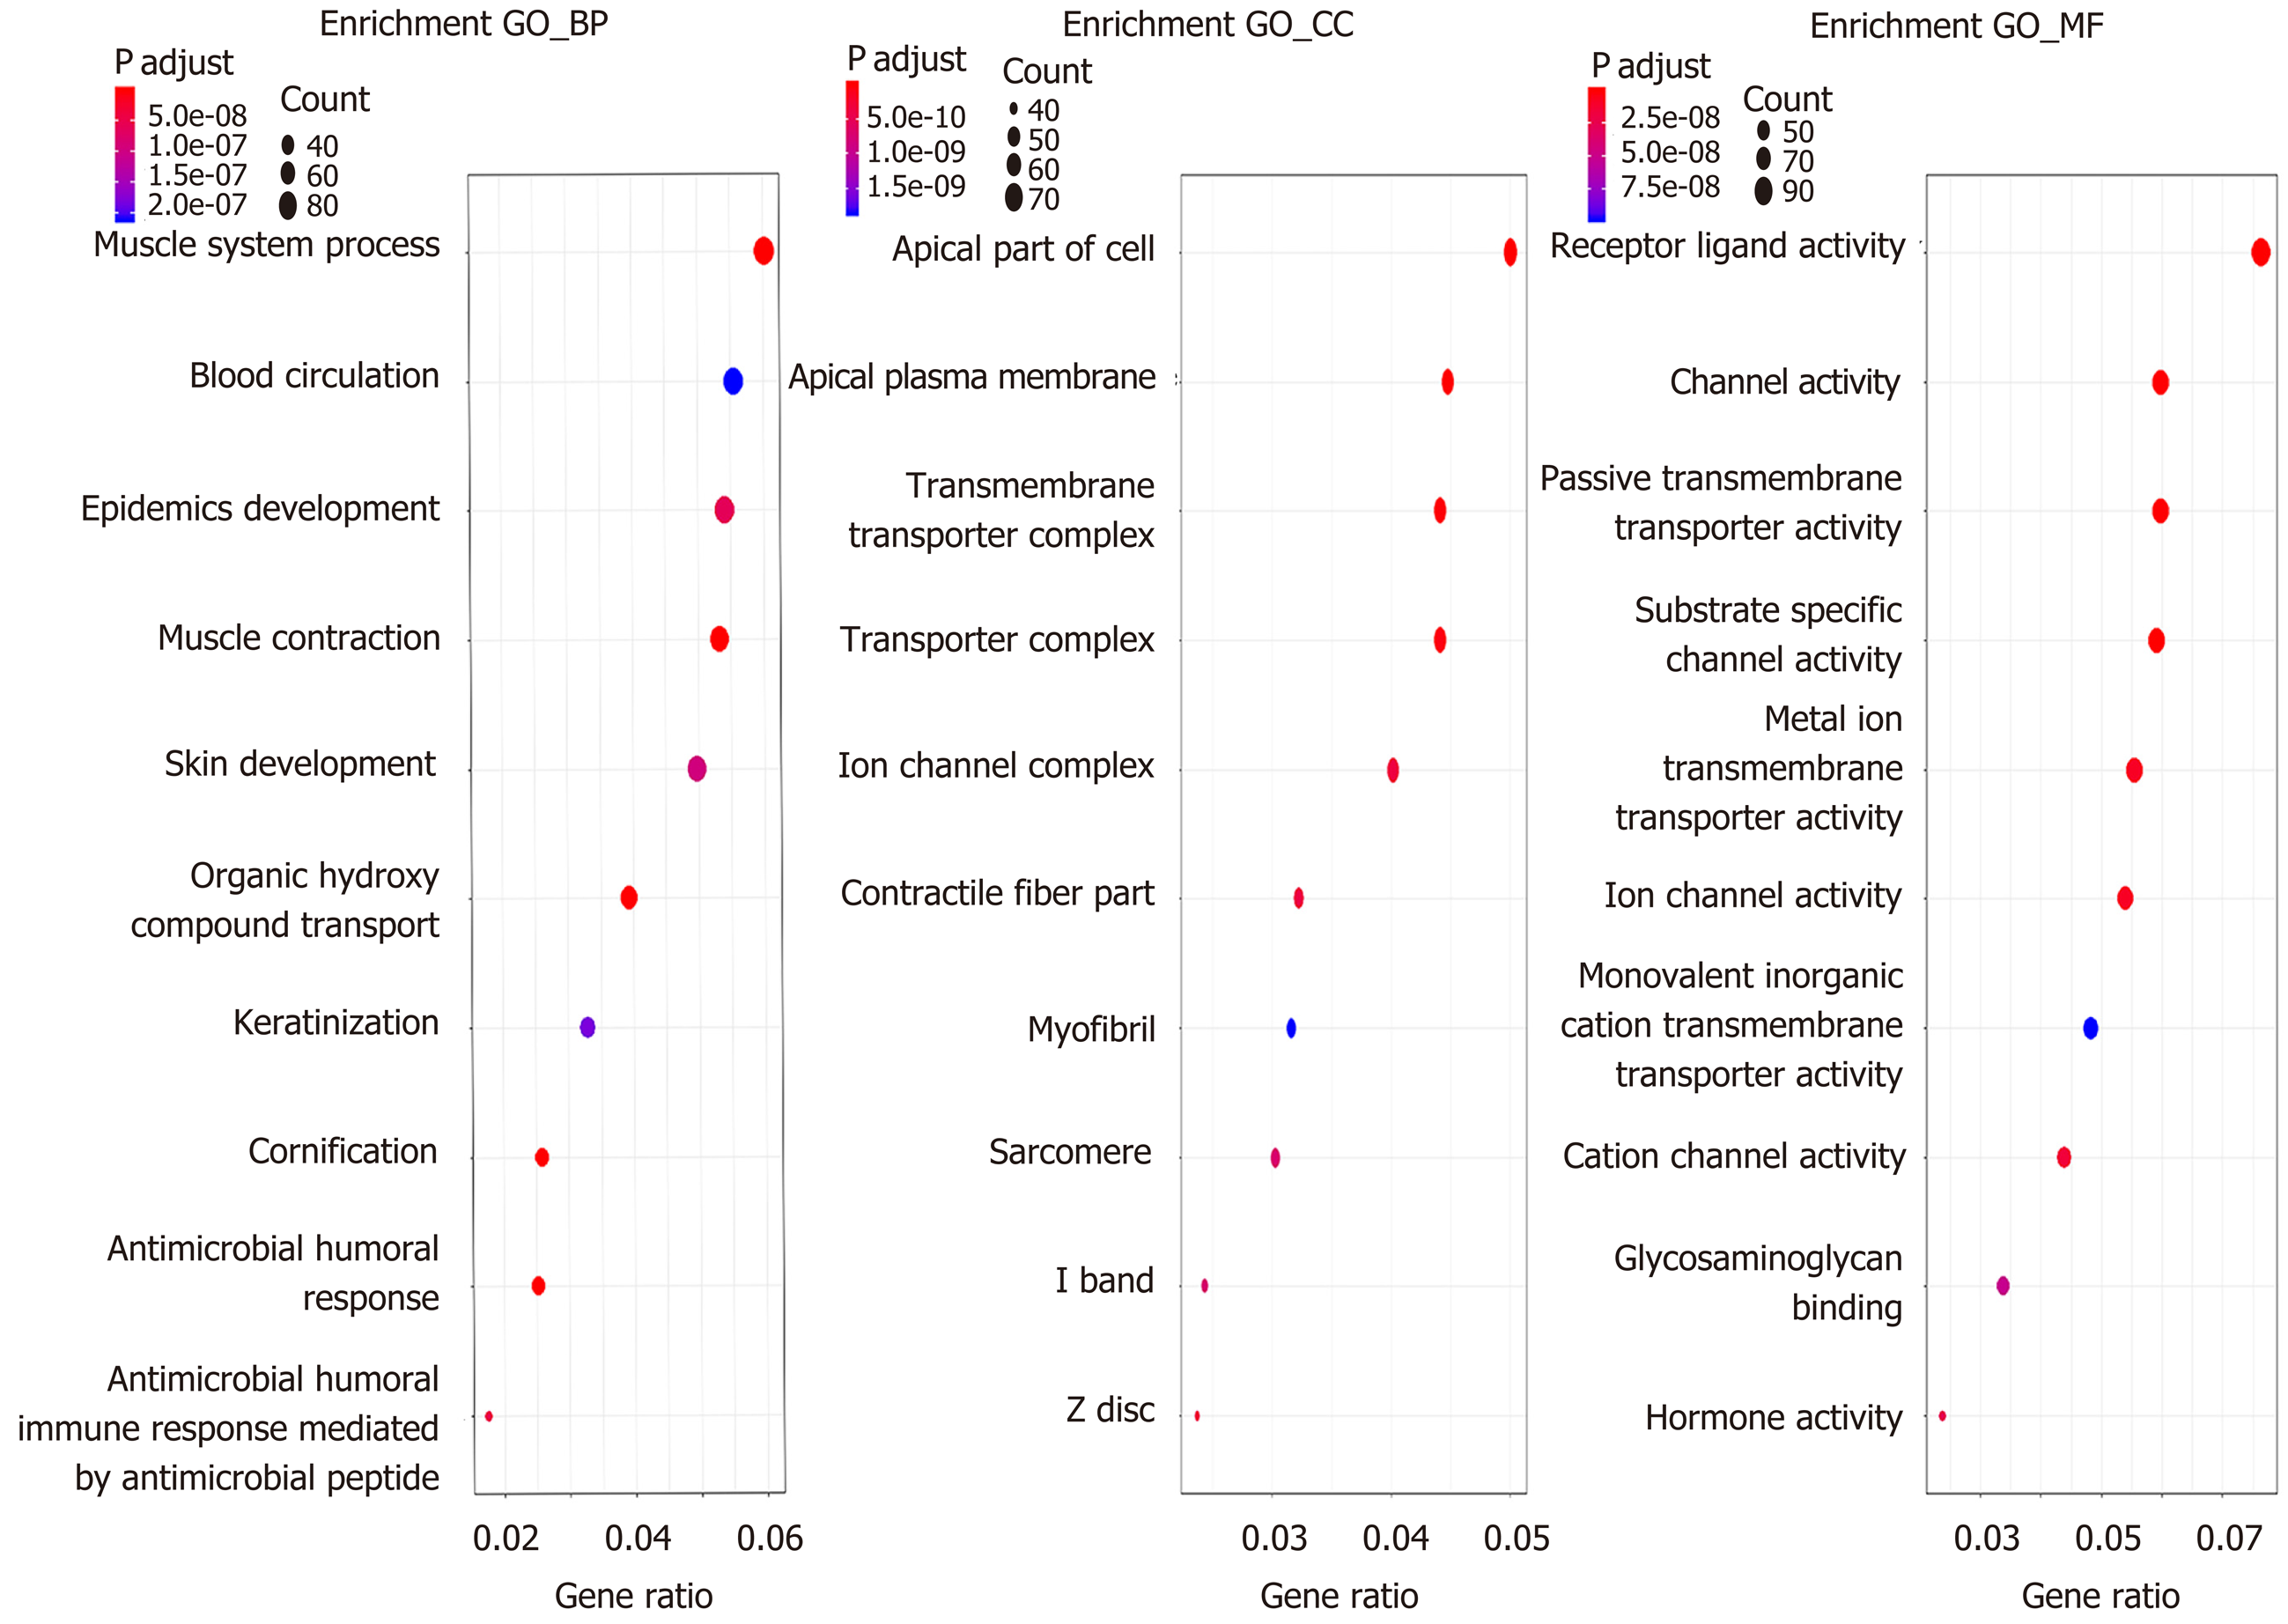
Figure 2 Functional enrichment analysis of Gene Ontology.
The Gene Ontology terms include biological process, cellular component, and molecular function (P < 0.05). GO: Gene Ontology; BP: Biological process; CC: Cellular component; MF: Molecular function.
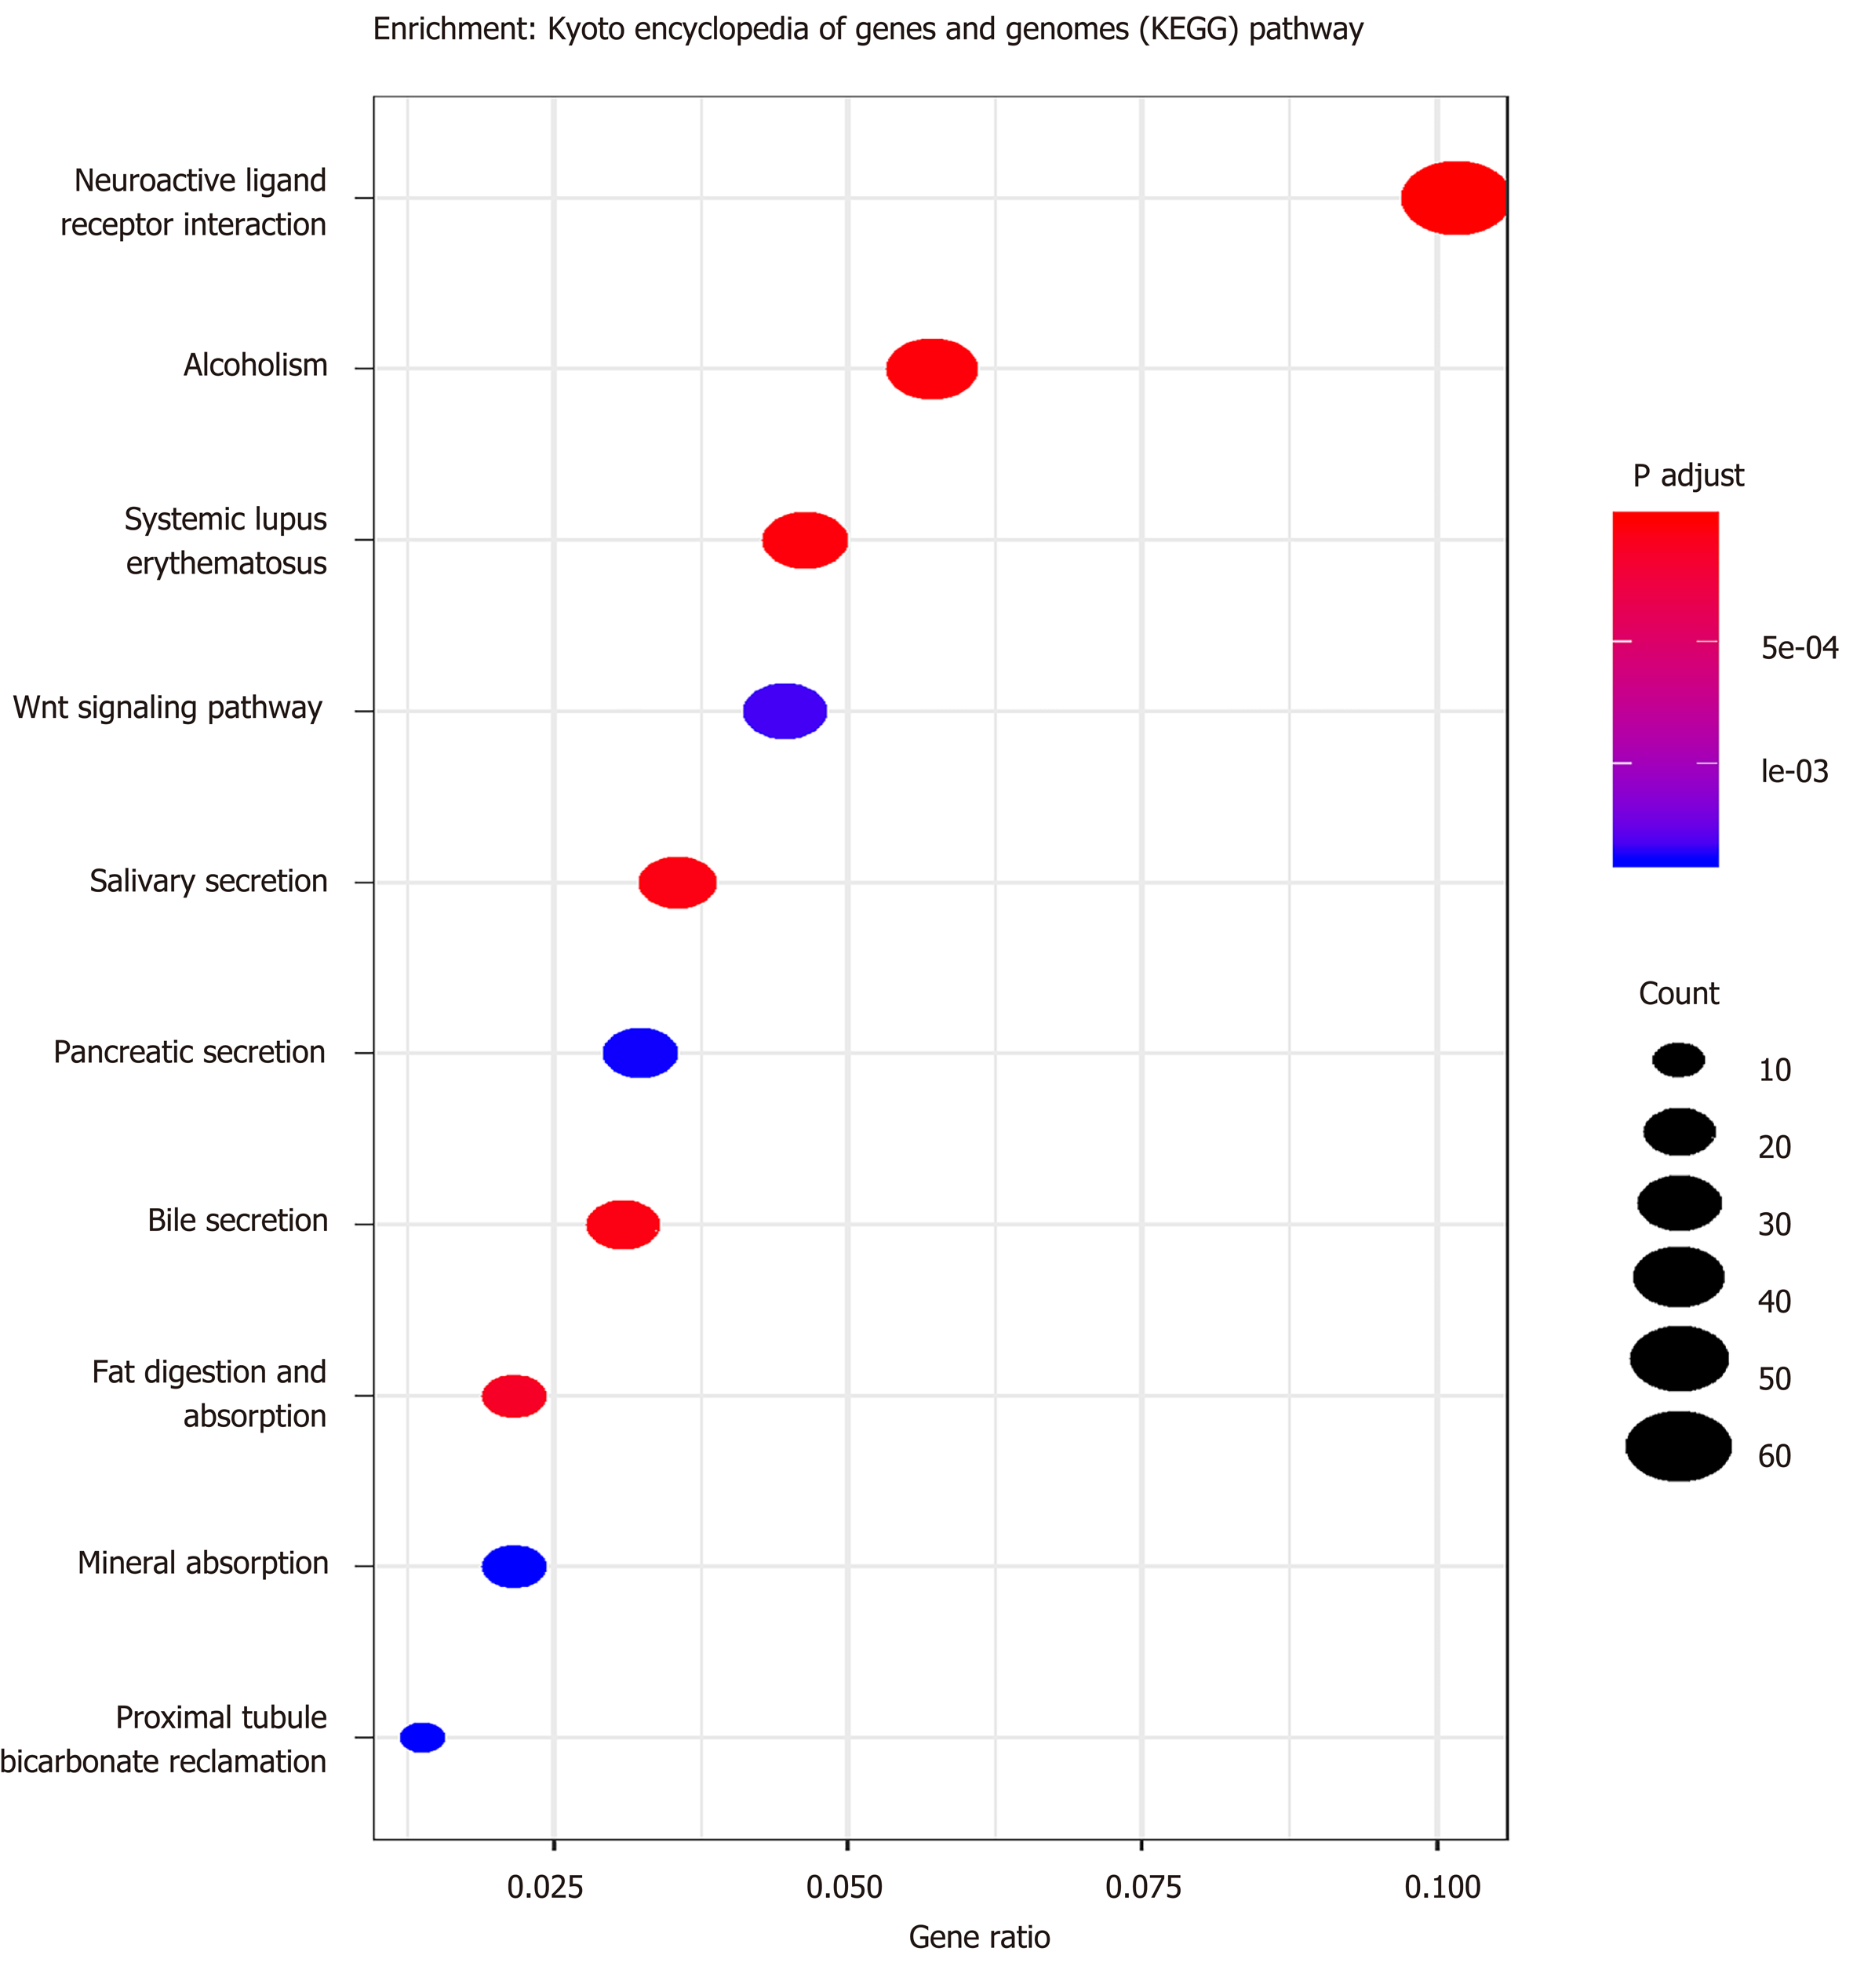
Figure 3 Functional enrichment analyses of the Kyoto Encyclopedia of Genes and Genomes (P < 0.
05).
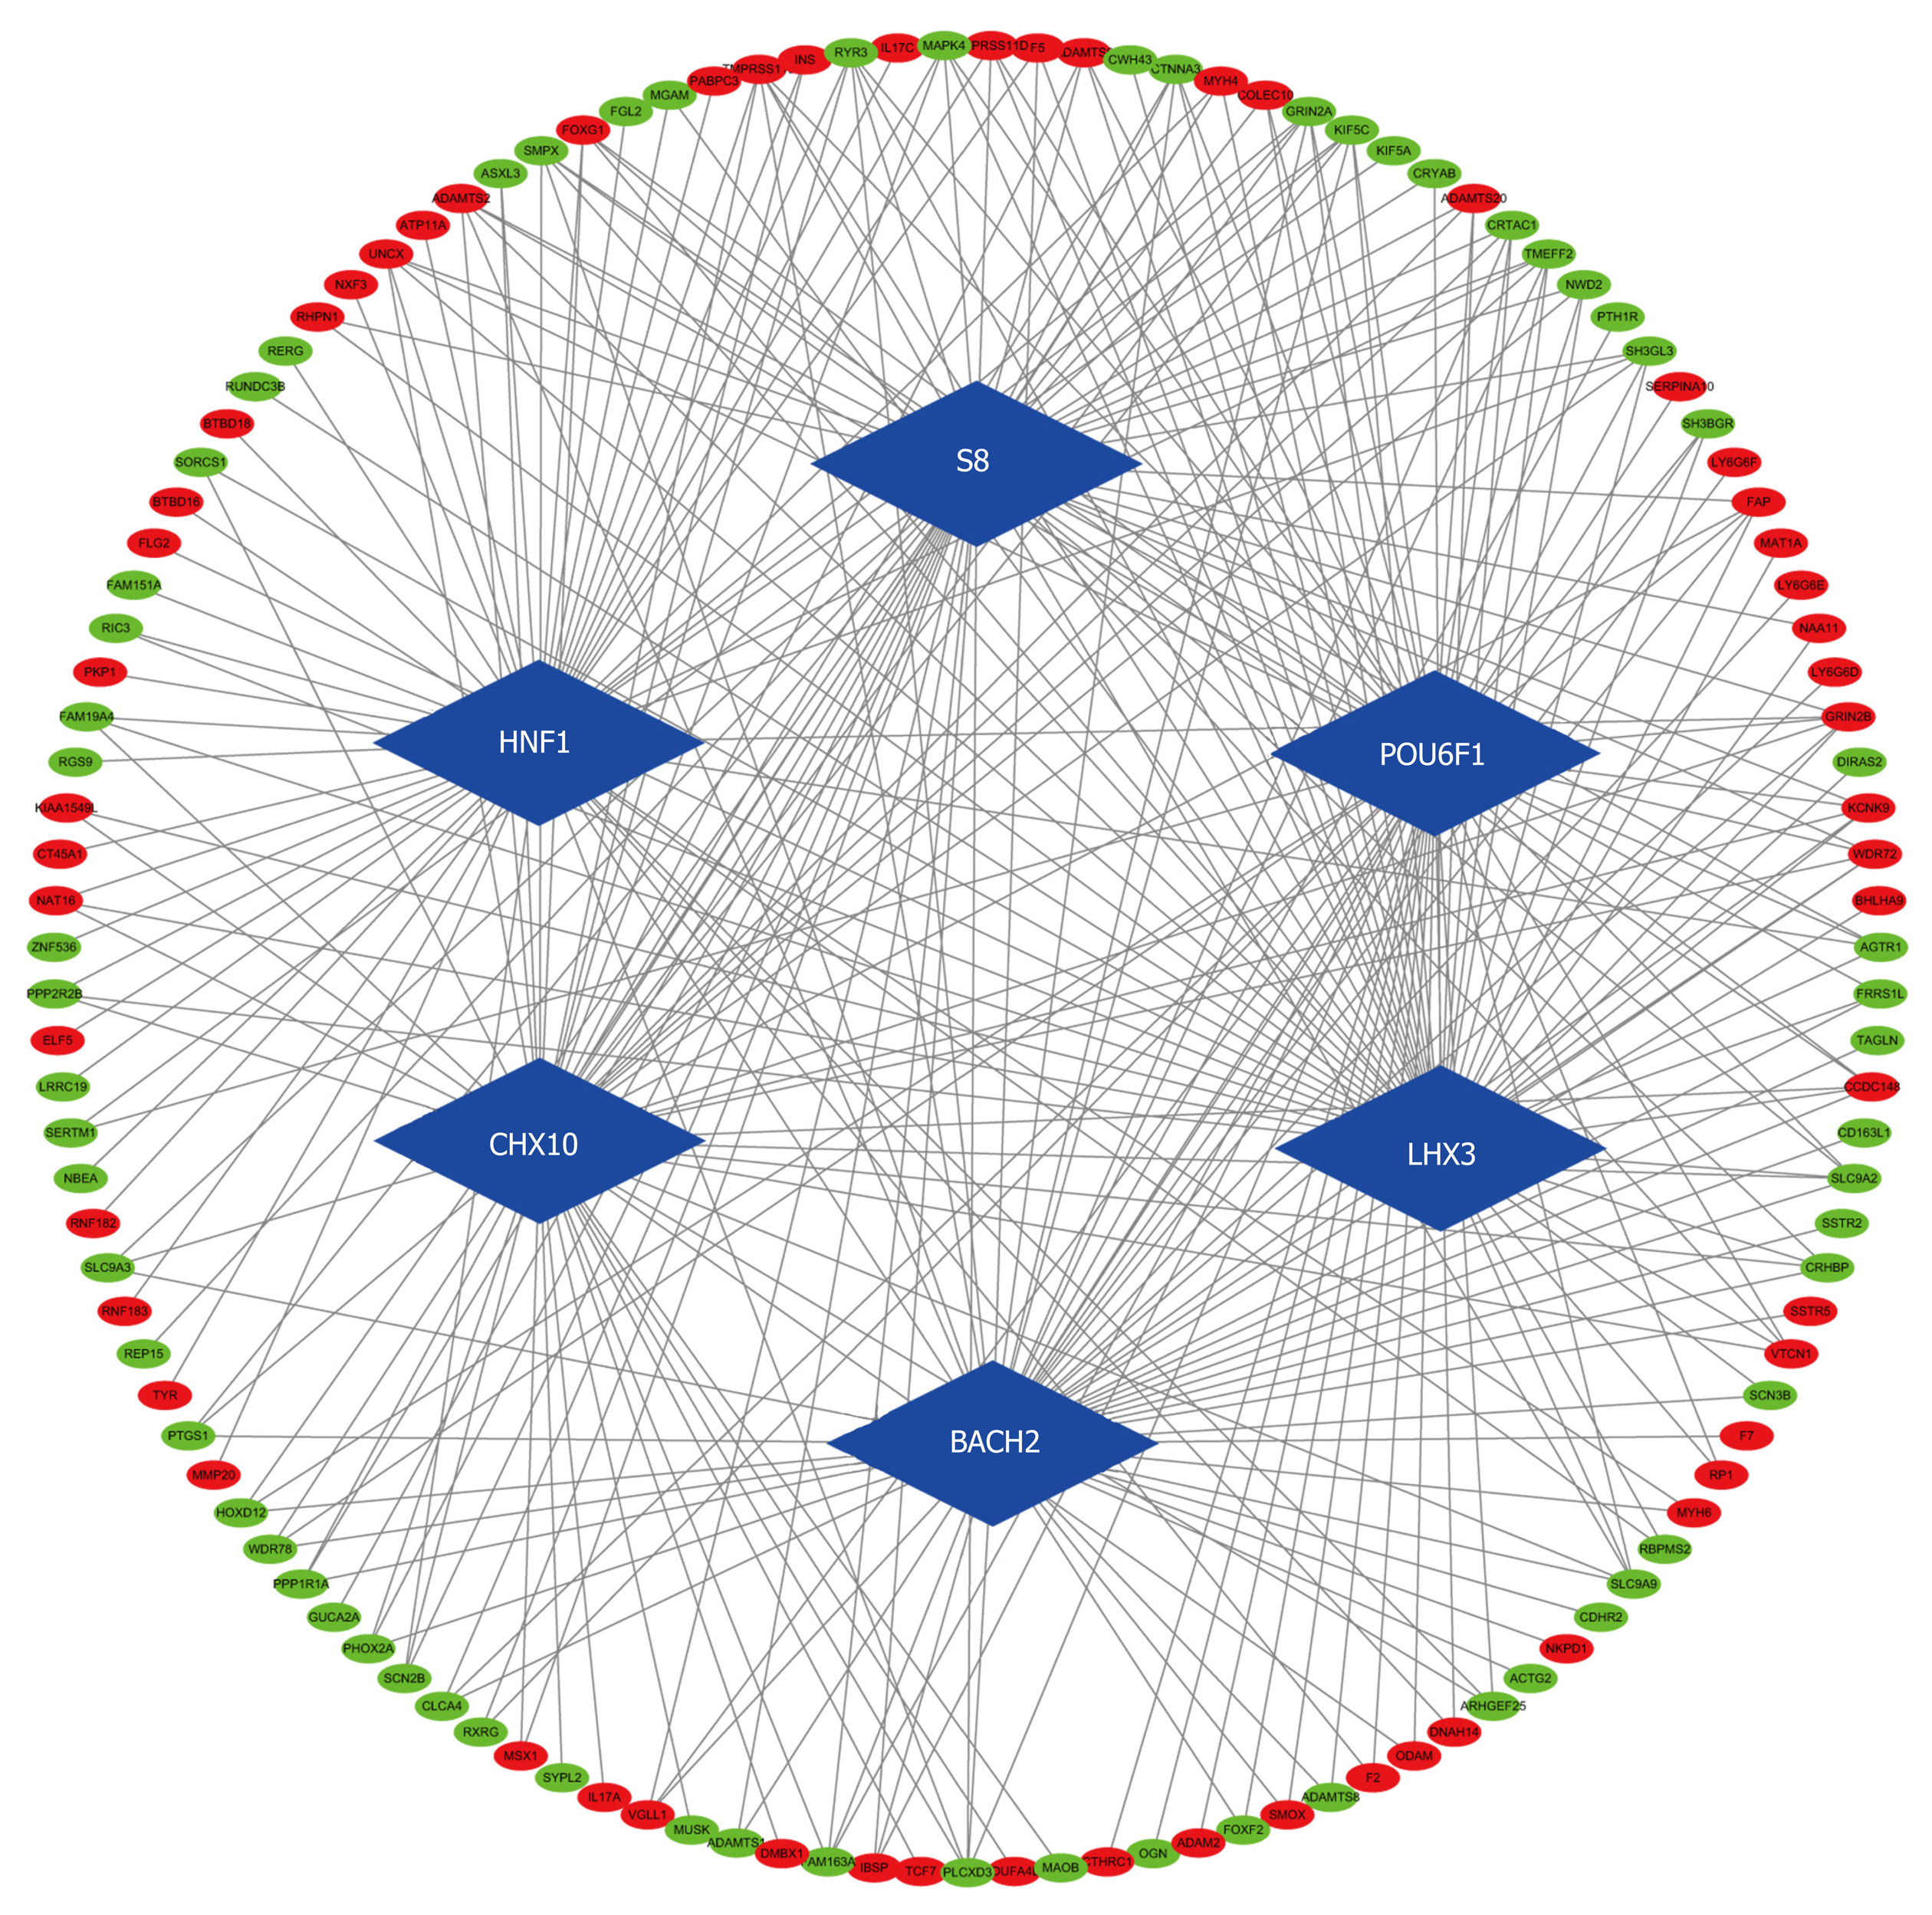
Figure 4 Transcription factor-differentially expressed mRNA regulatory network.
Every node represents one gene, and each edge represents the interaction between genes. Transcription factors and mRNAs are indicated with diamond shapes and circles, respectively (P < 0.05).
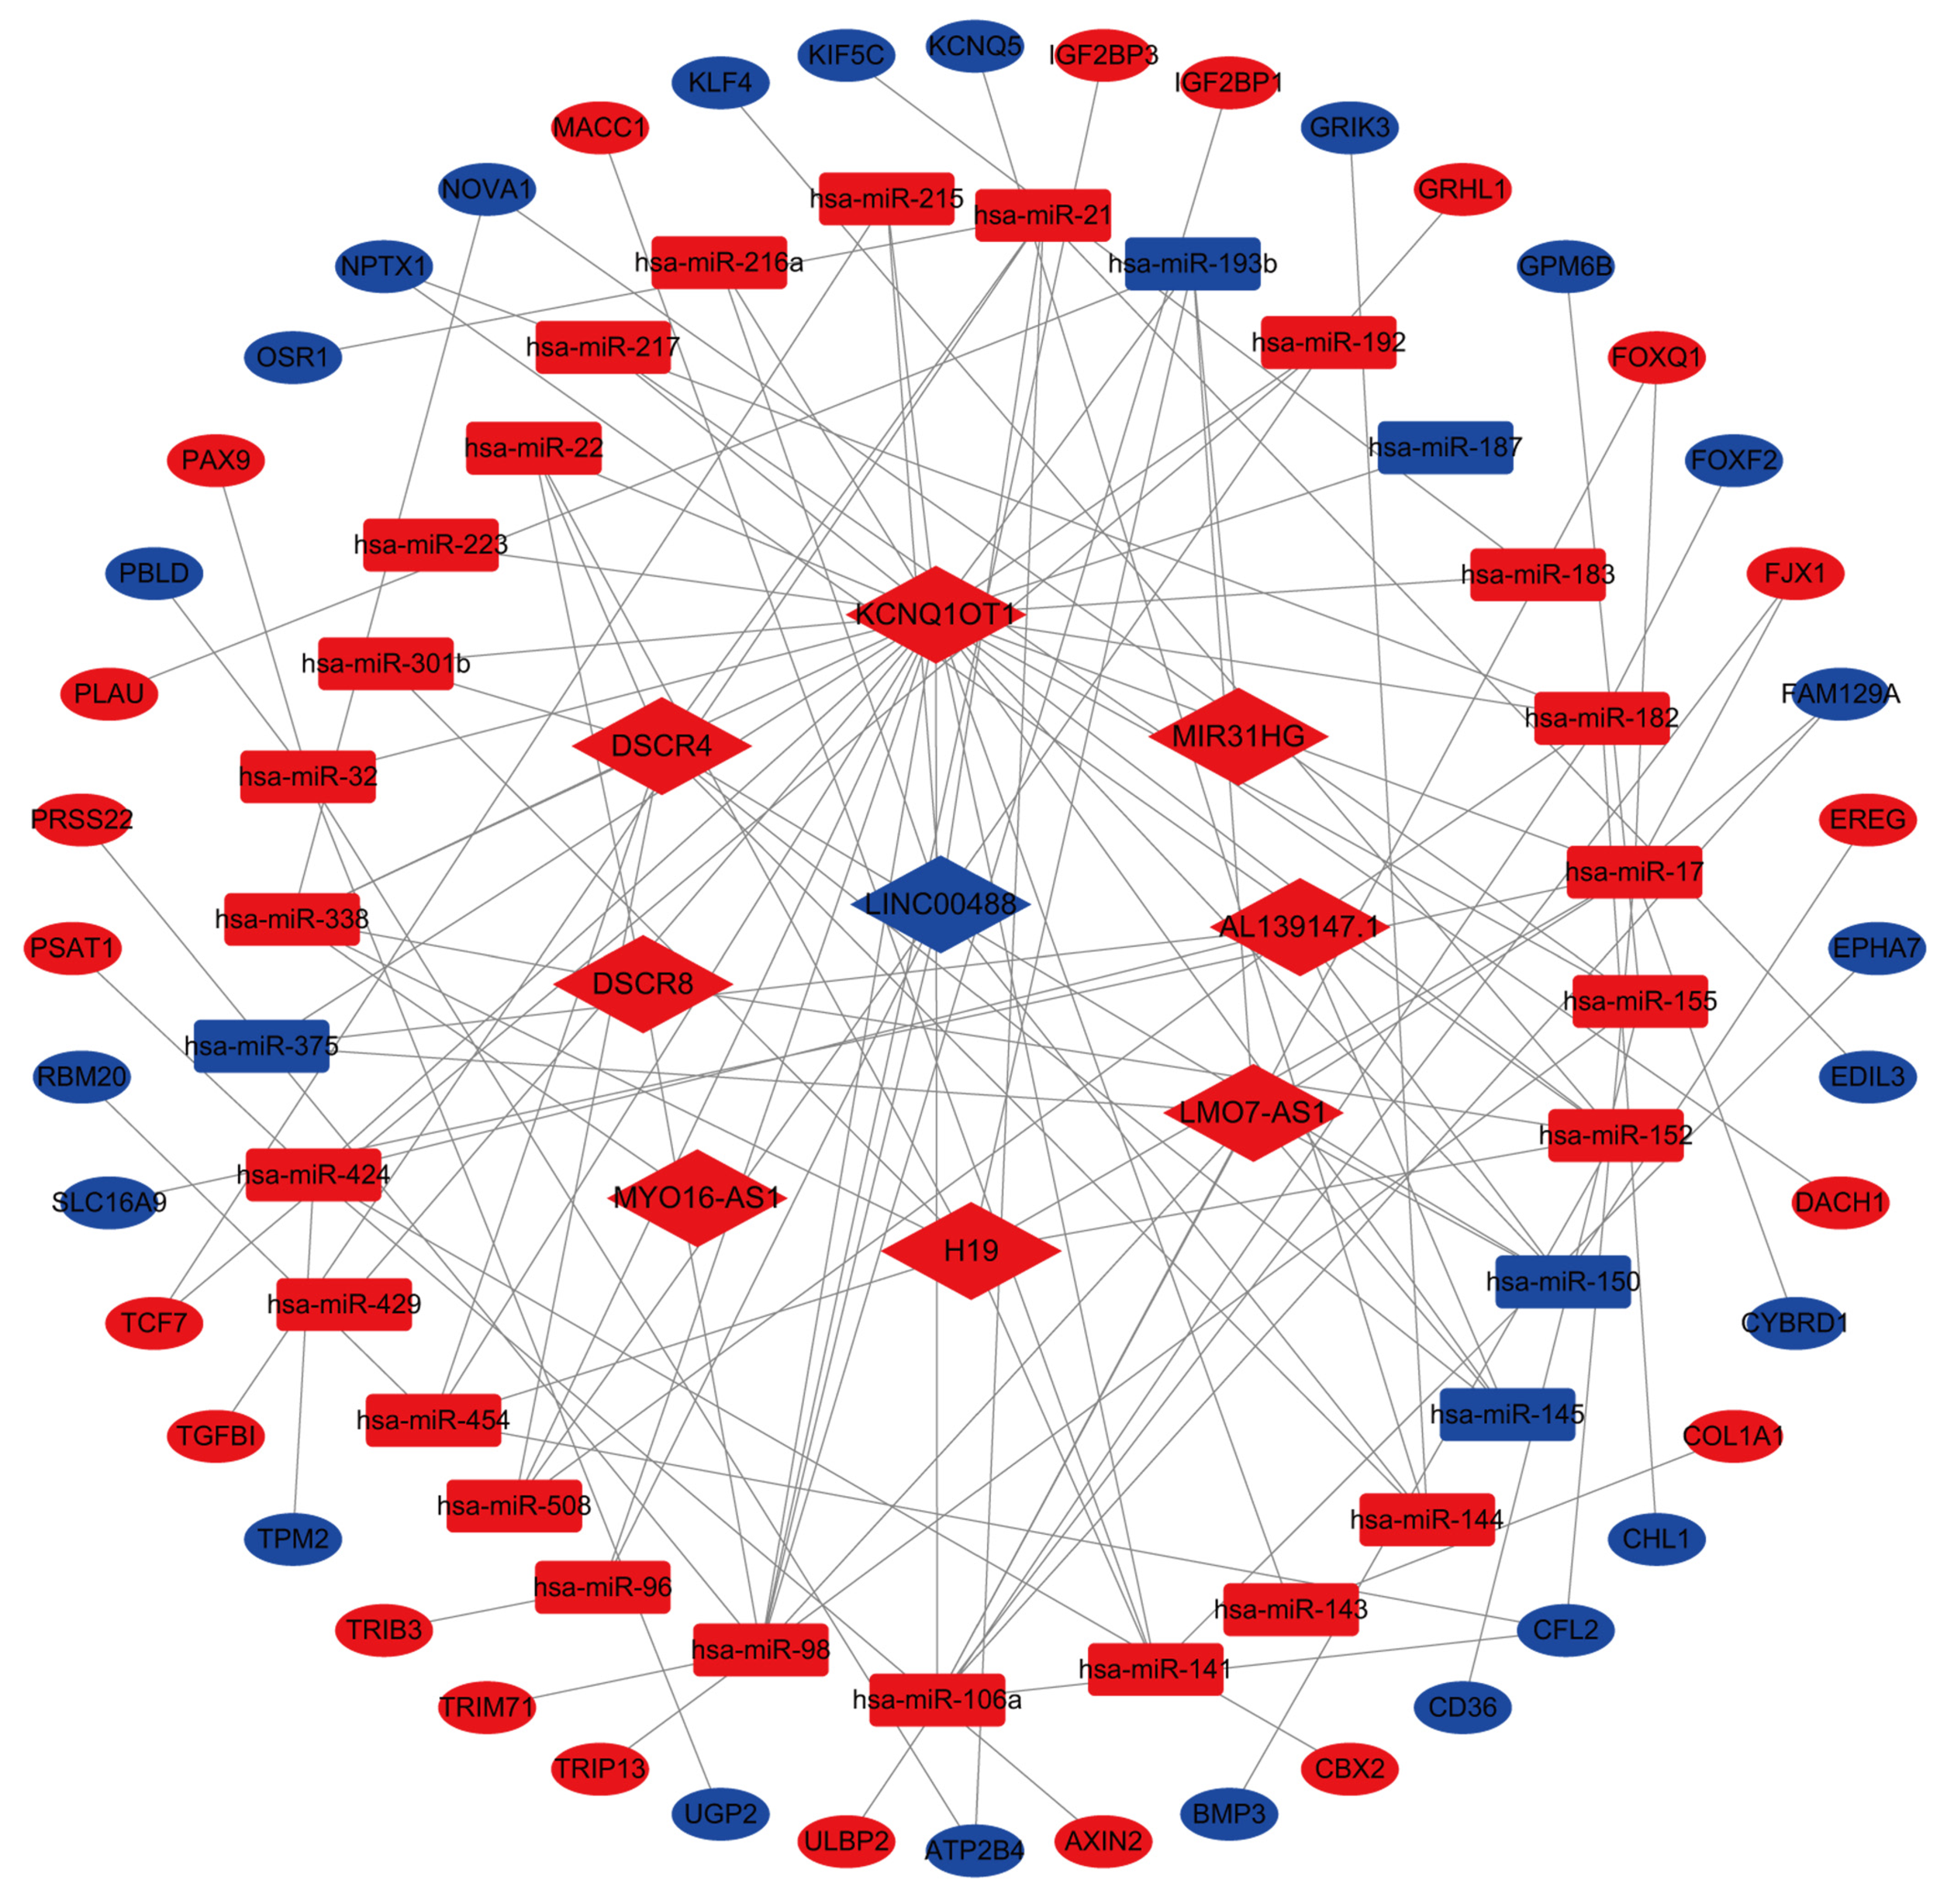
Figure 5 mRNA-long noncoding RNA-miRNA regulatory network.
The red and blue nodes represent upregulated and downregulated genes, respectively. mRNAs, long noncoding RNA, and miRNAs are represented by ellipses, diamonds, and rounded rectangles, respectively (P < 0.05).
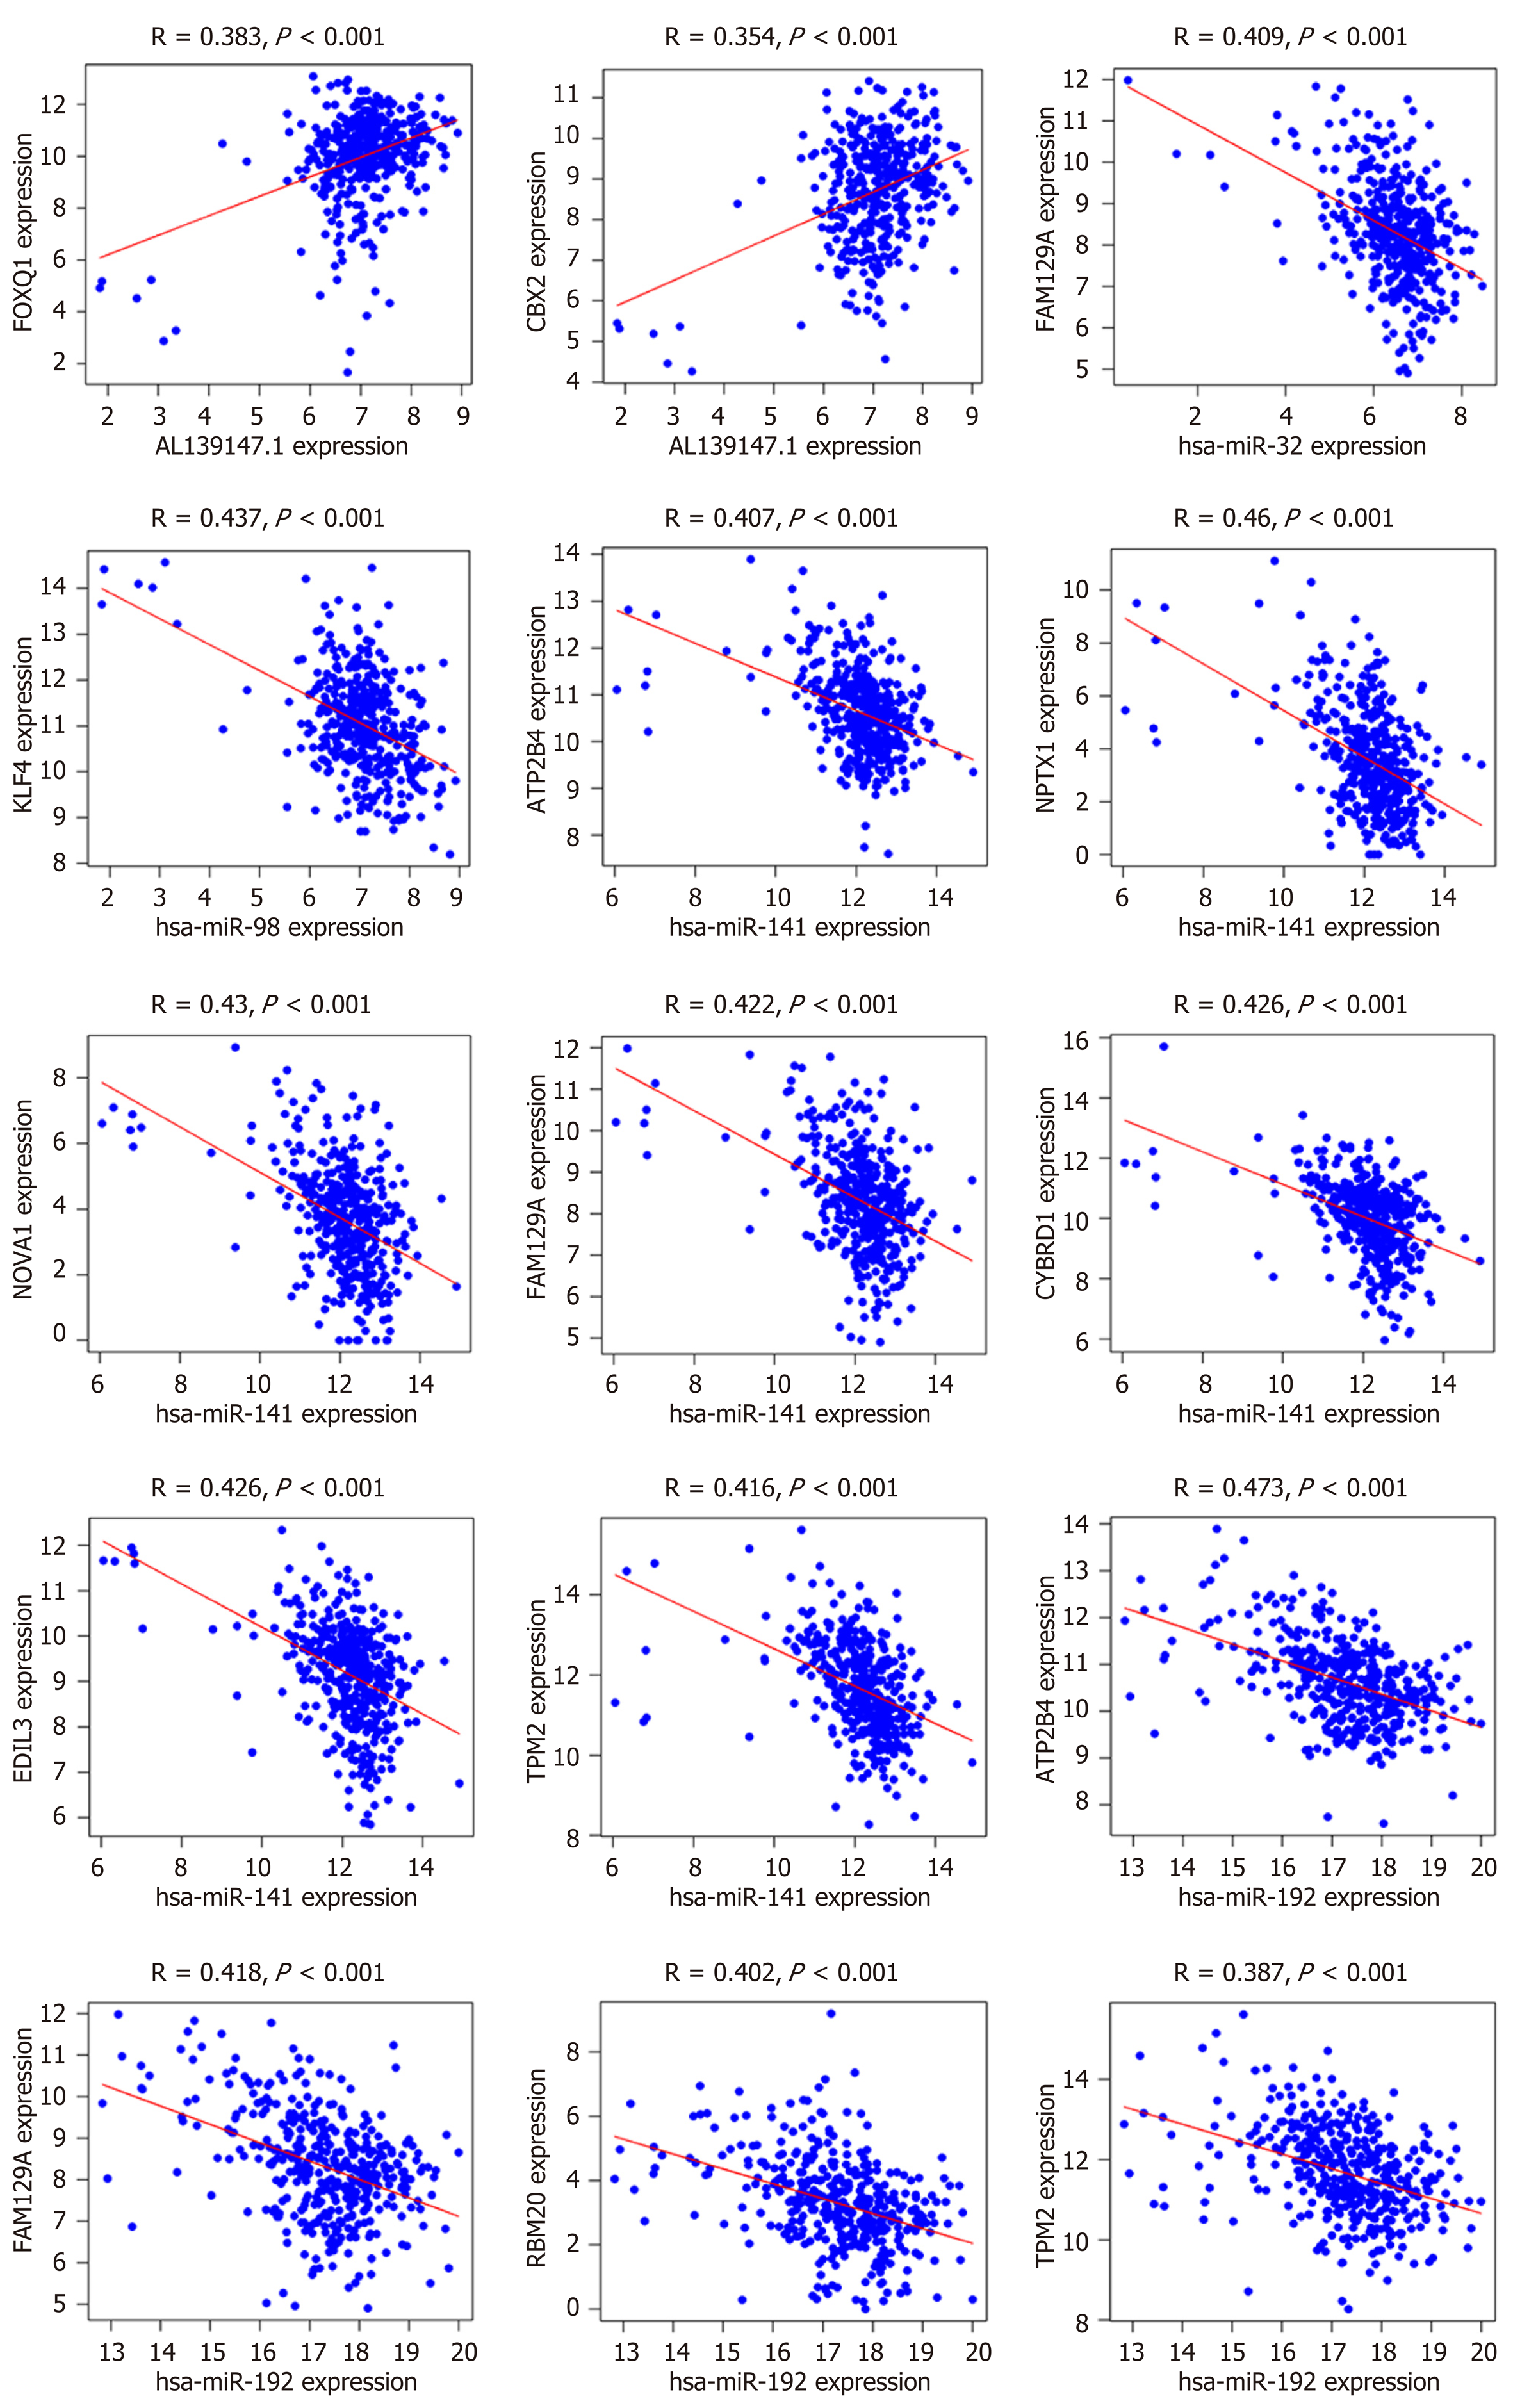
Figure 6 Linear regression of differentially expressed RNA expression levels (R > 0.
35, P < 0.01).
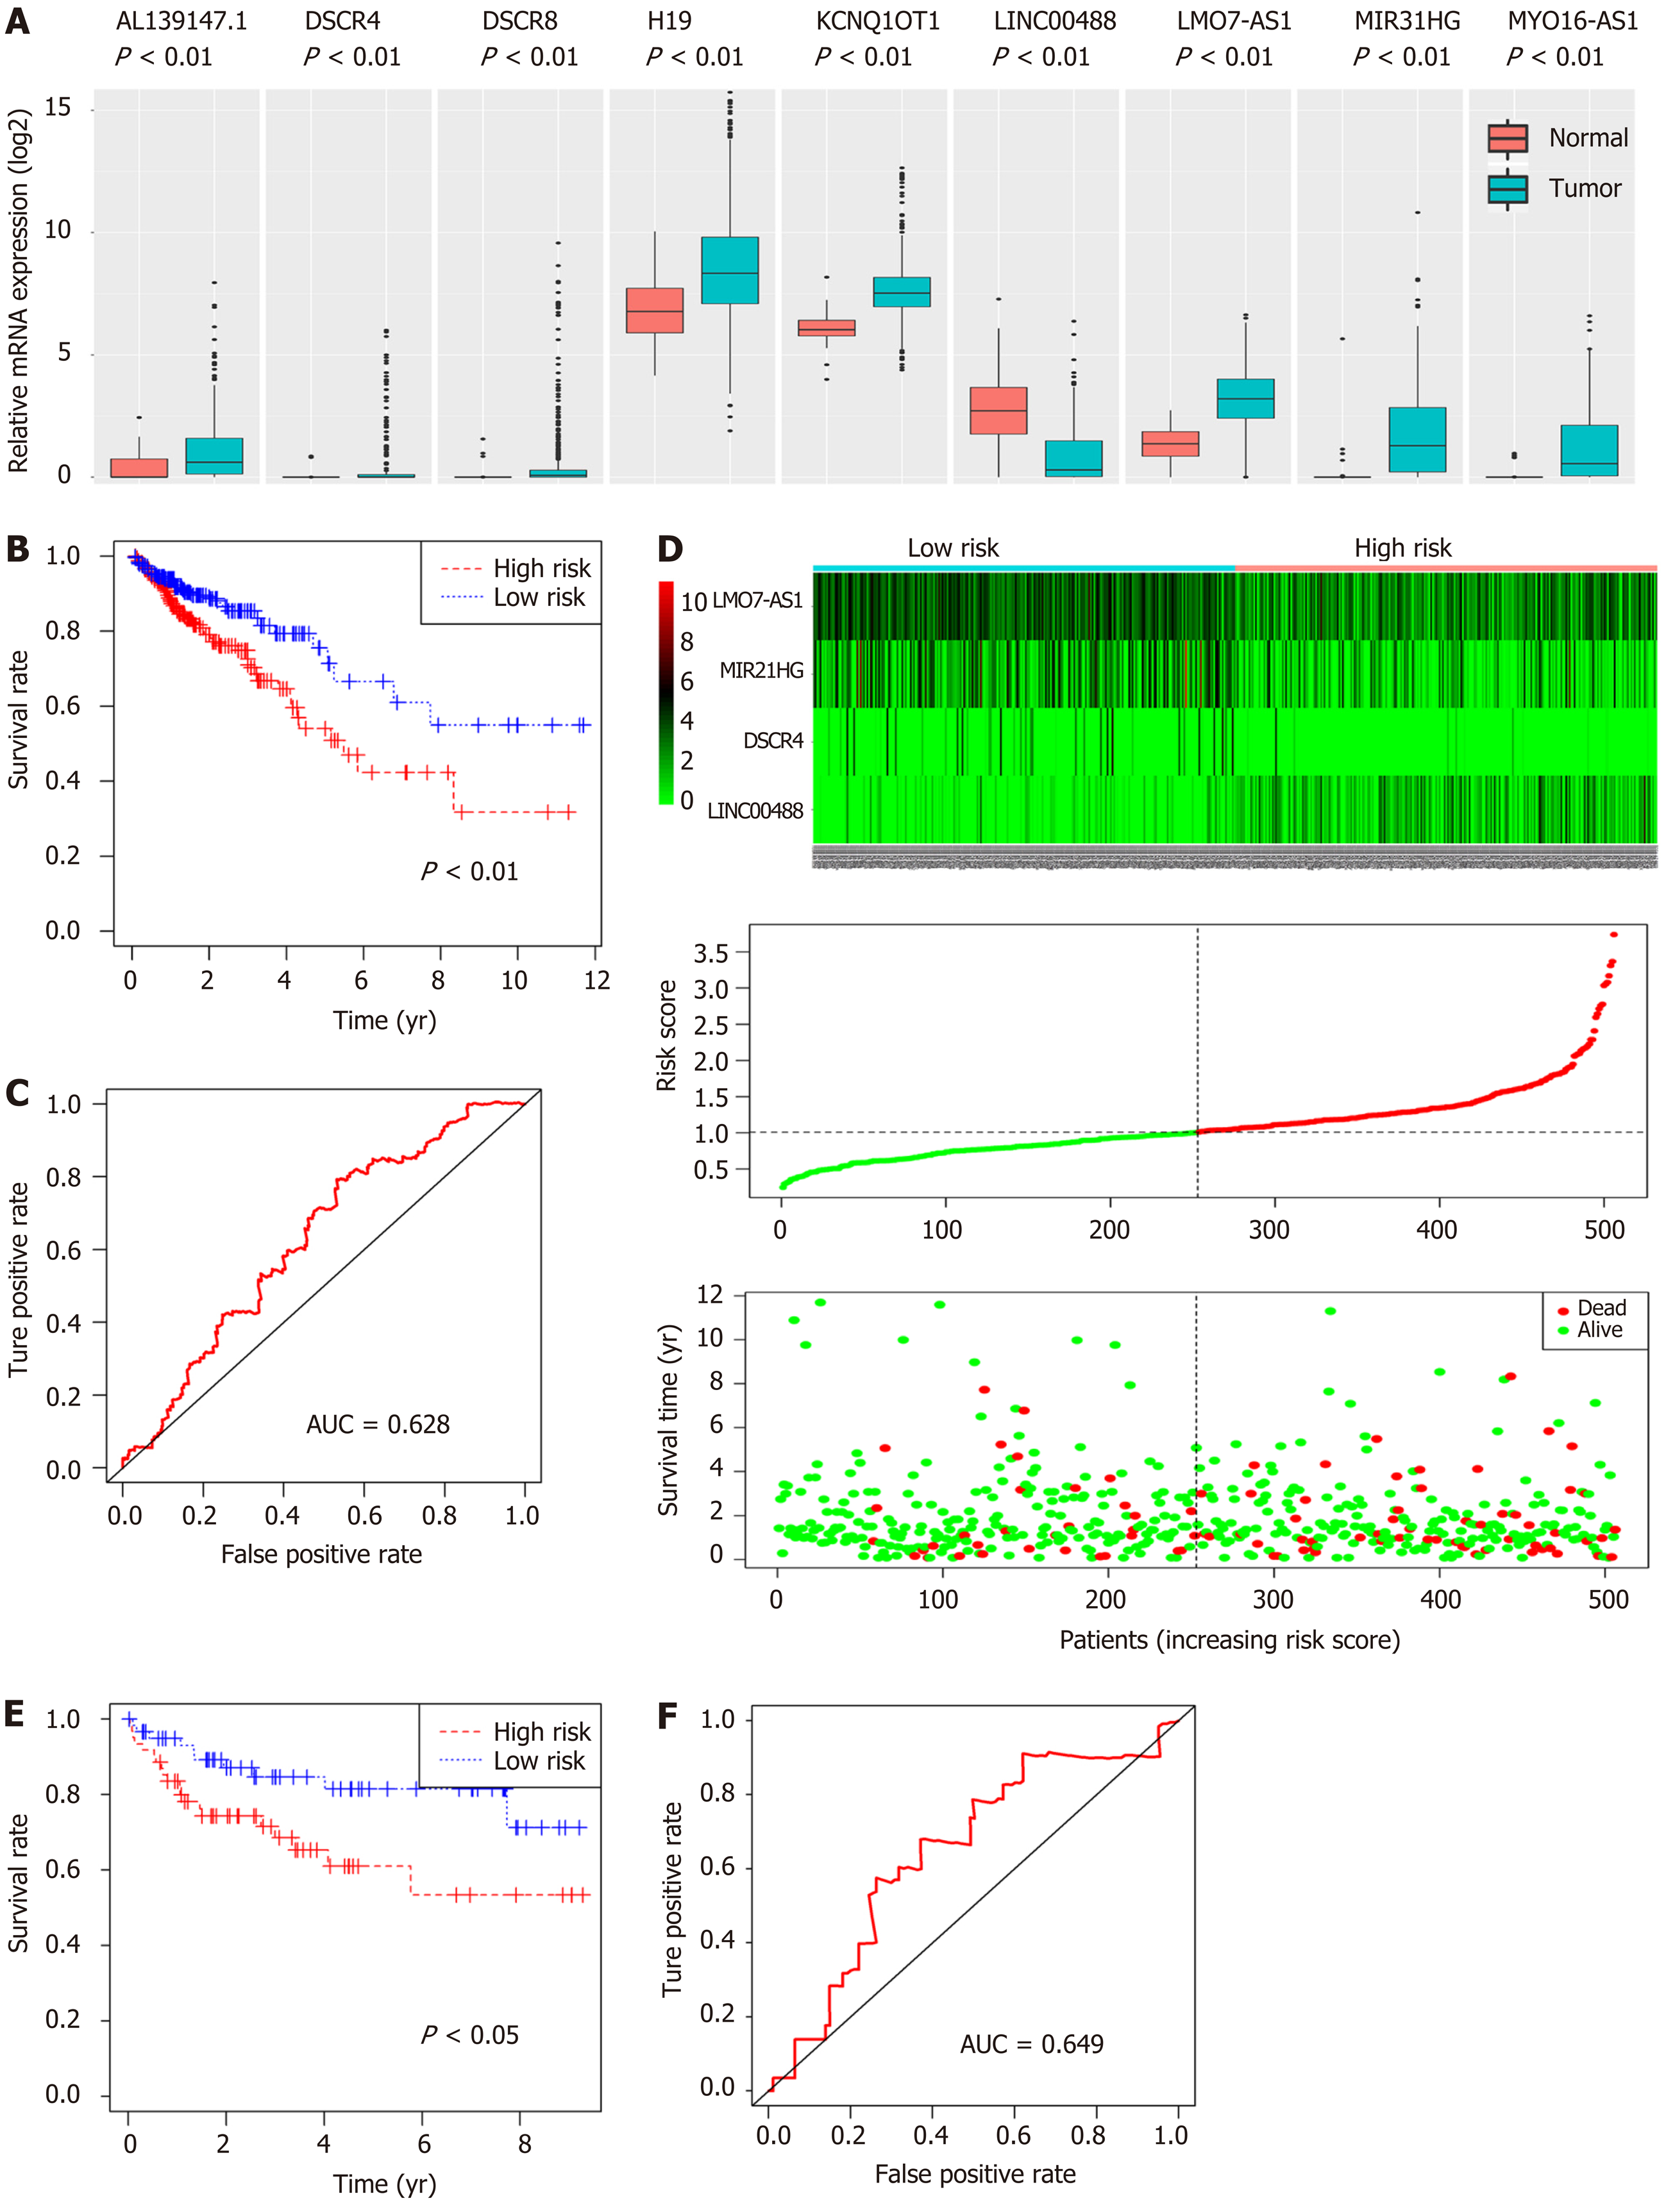
Figure 7 Predictive value assessment of the four-long noncoding RNA model.
A: mRNA expression levels of nine long noncoding RNAs involved in the competing endogenous RNAs network (P < 0.01); B: Kaplan-Meier survival curves of the risk score for high- and low-risk groups (P < 0.01); C: Receiver operating characteristic curve of the risk score predicting 5-year overall survival (P < 0.01); D: The heatmap, distribution of risk score, and patient status for the four-long noncoding RNA expression profiles between high- and low-risk groups; E: Kaplan-Meier survival curves of the risk score based on GSE38832 (P < 0.05); F: Receiver operating characteristic curve of the risk score for predicting 5-year overall survival based on GSE38832 (P < 0.05).
Figure 8 Cox regression analysis of clinical features and risk score in colorectal cancer patients.
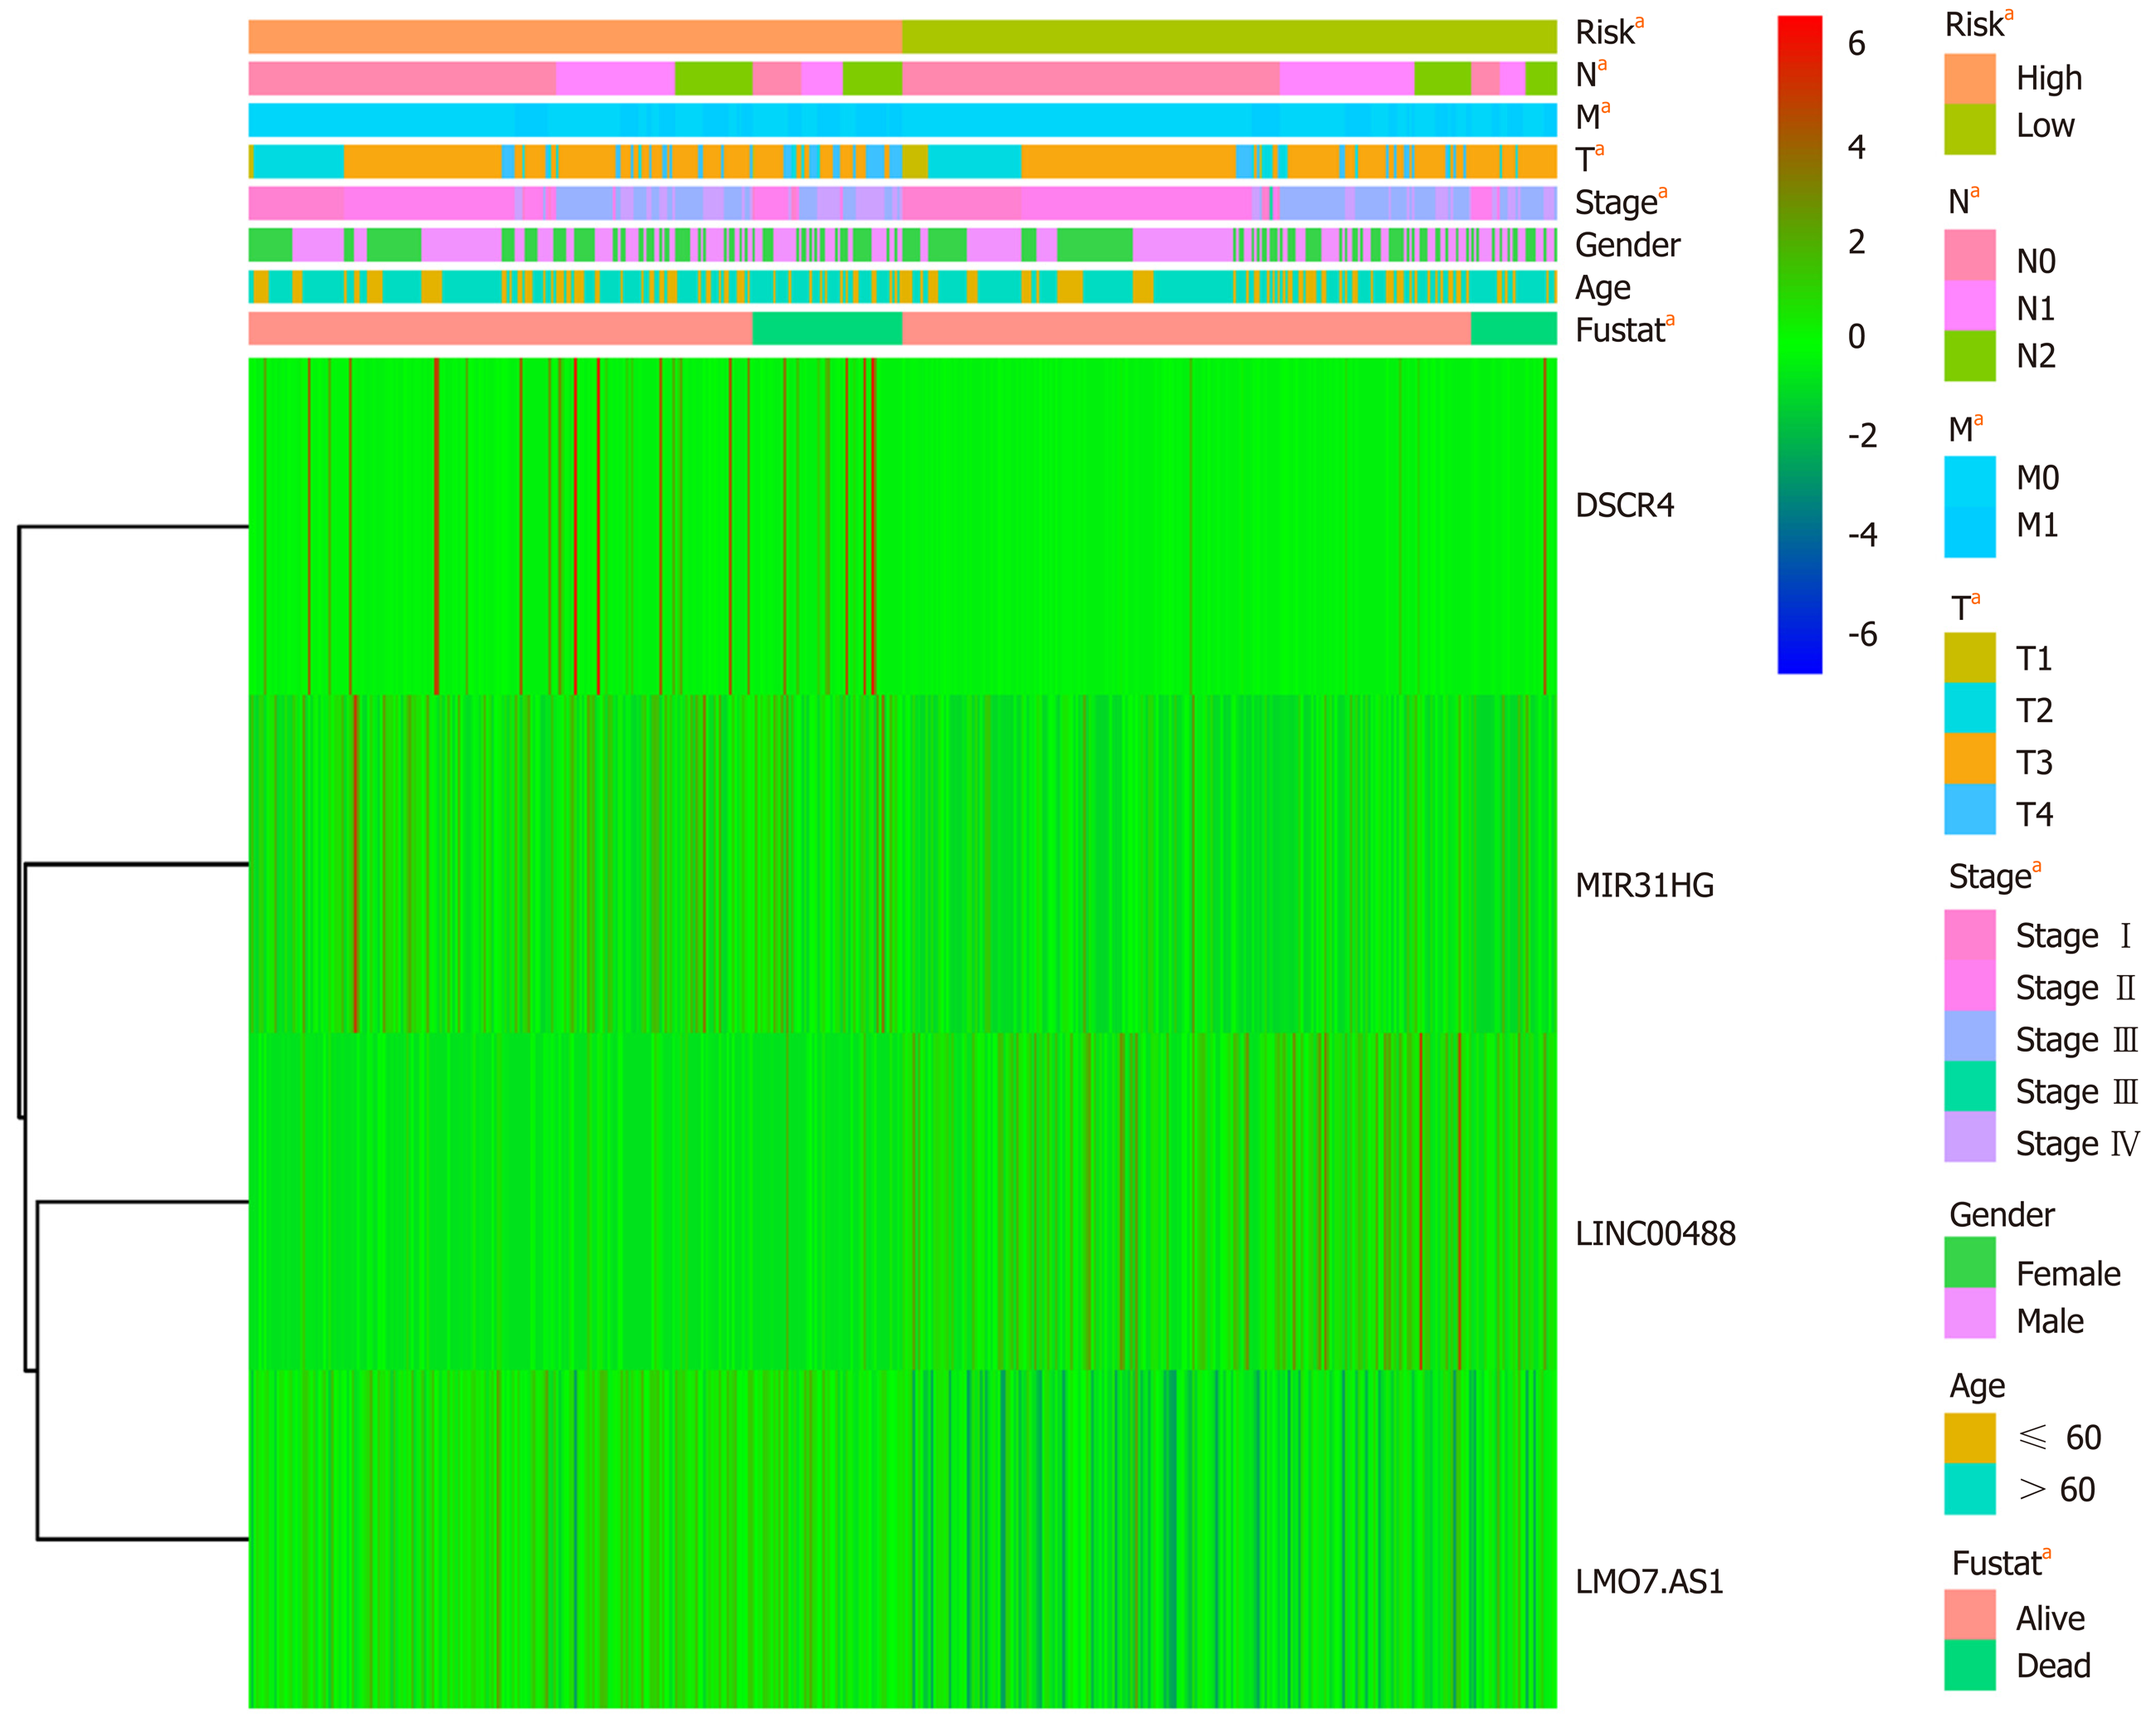
Figure 9 Heatmap of the four-long noncoding RNA model combined with clinical features and long noncoding RNA expression.
aP < 0.05.
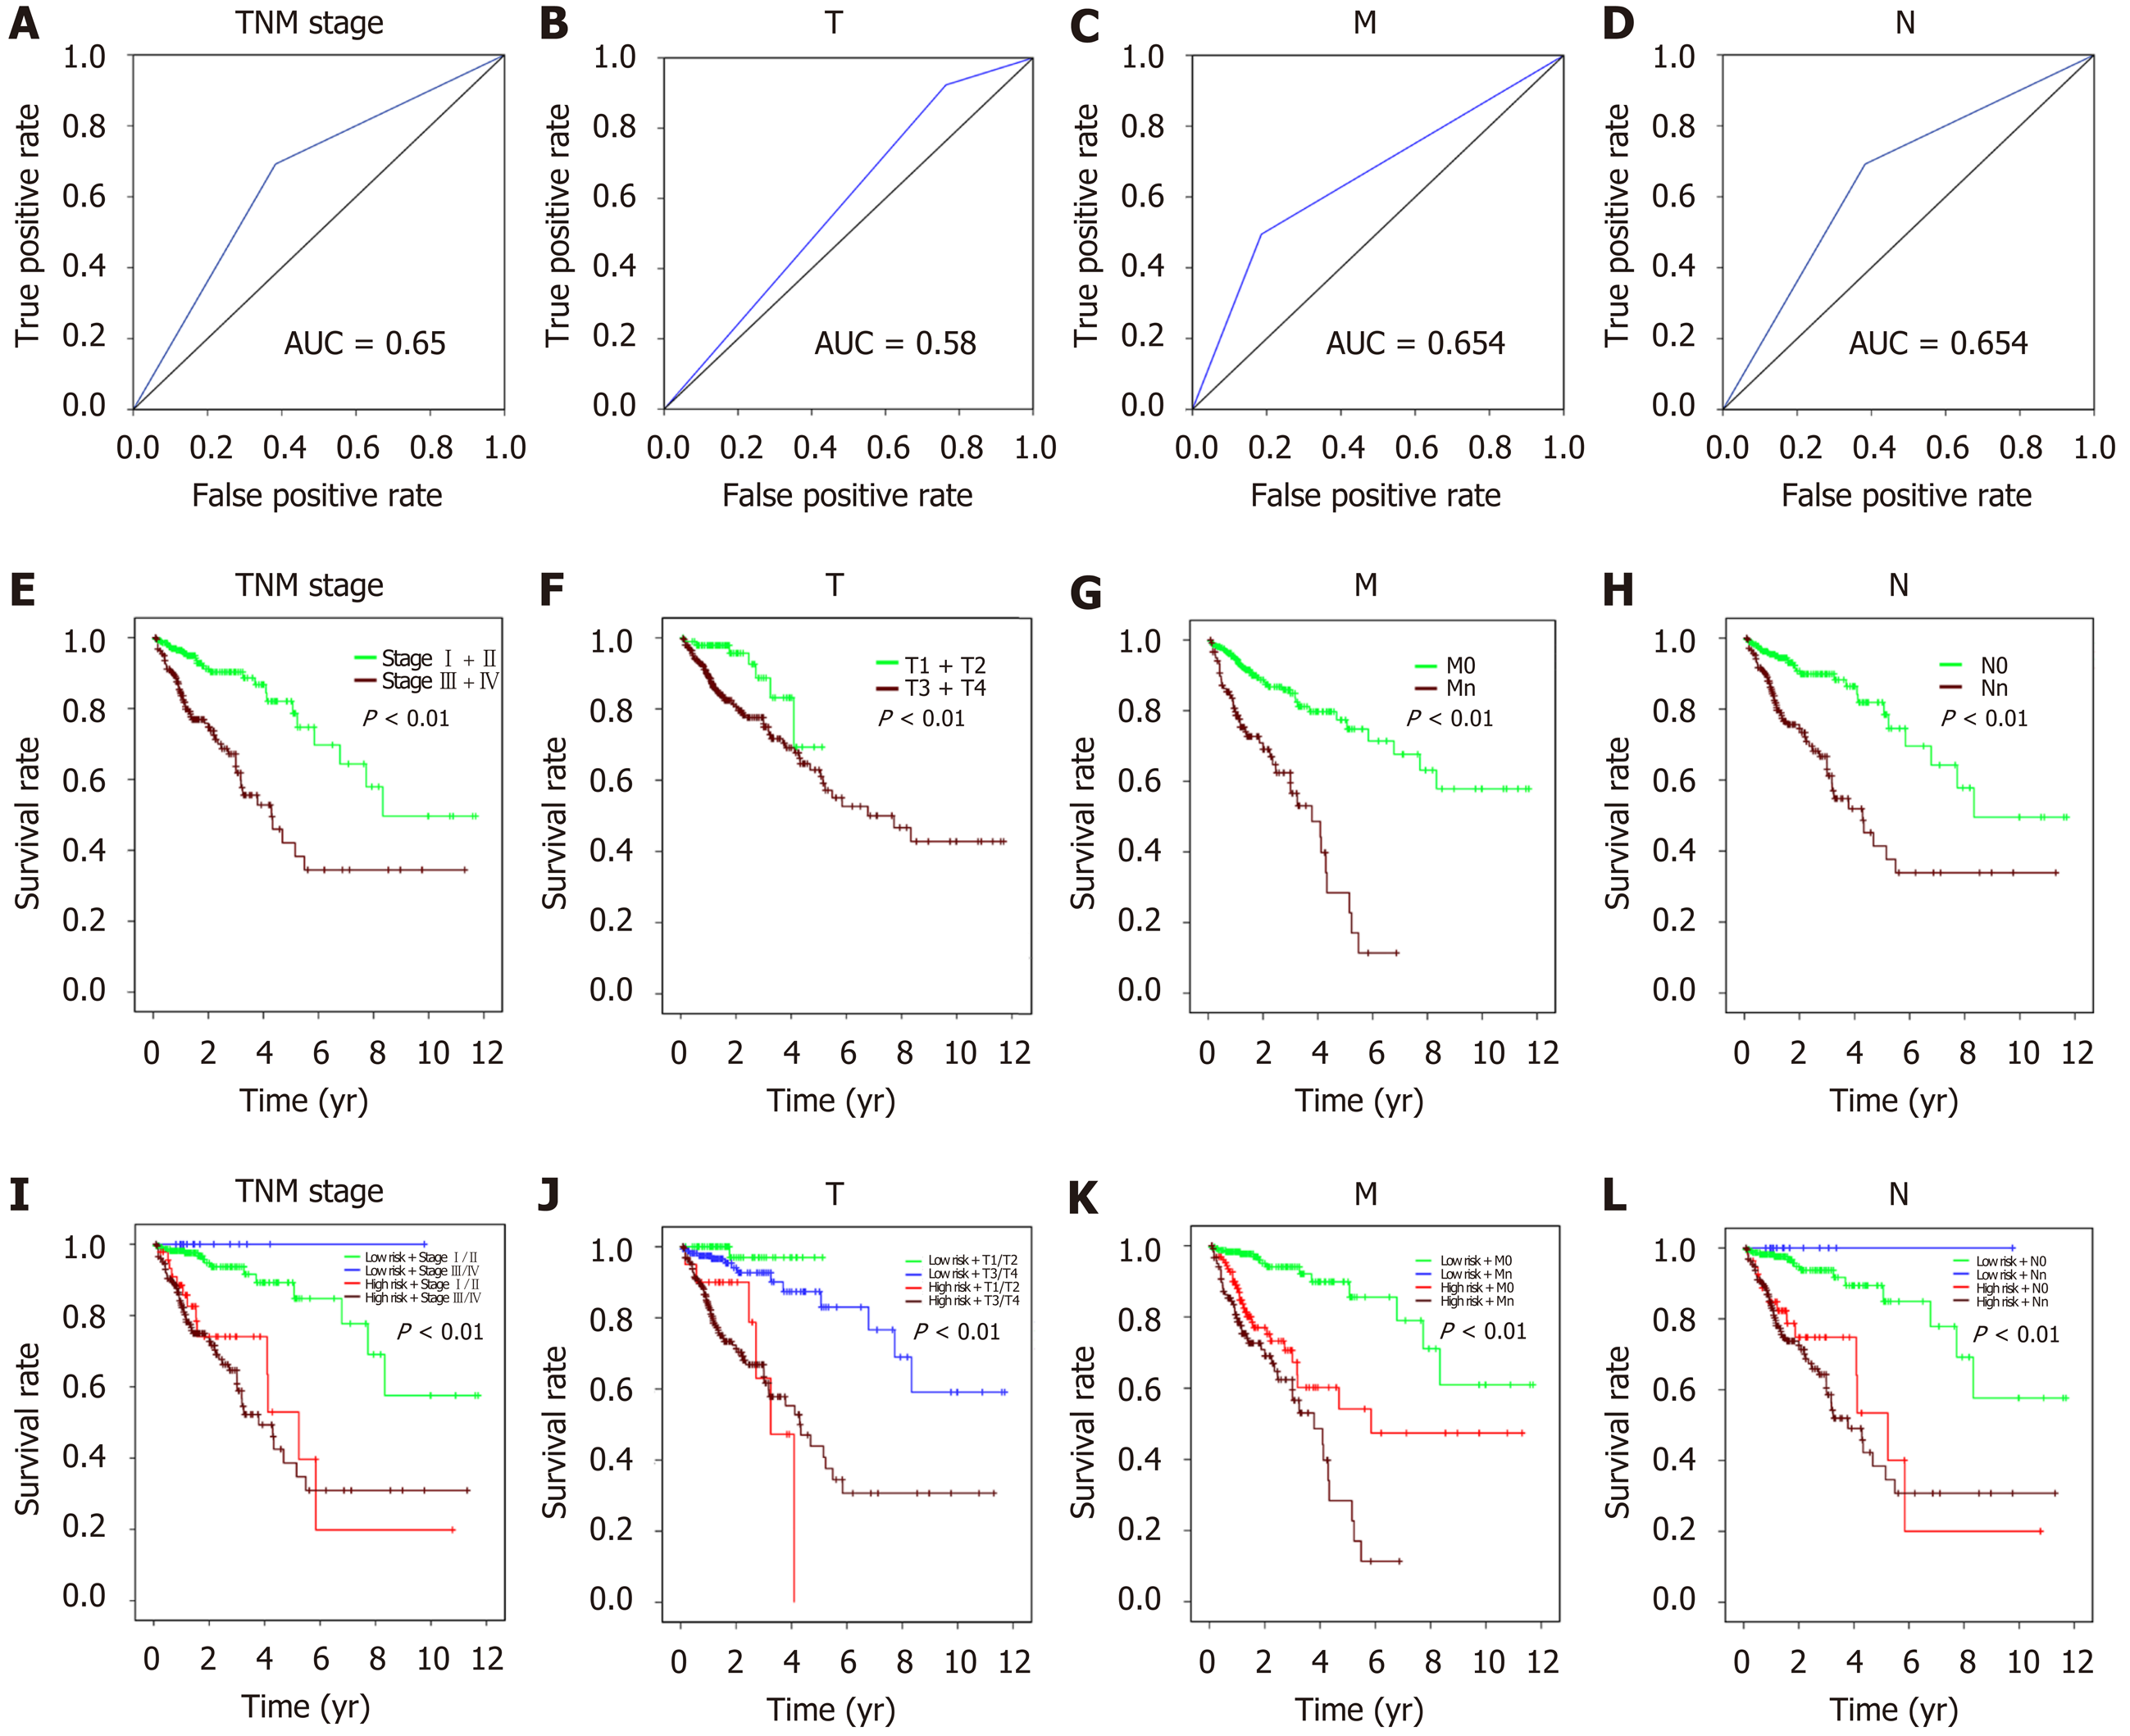
Figure 10 Prognostic value of clinical features and risk score for the overall survival of colorectal cancer patients (P < 0.
01).
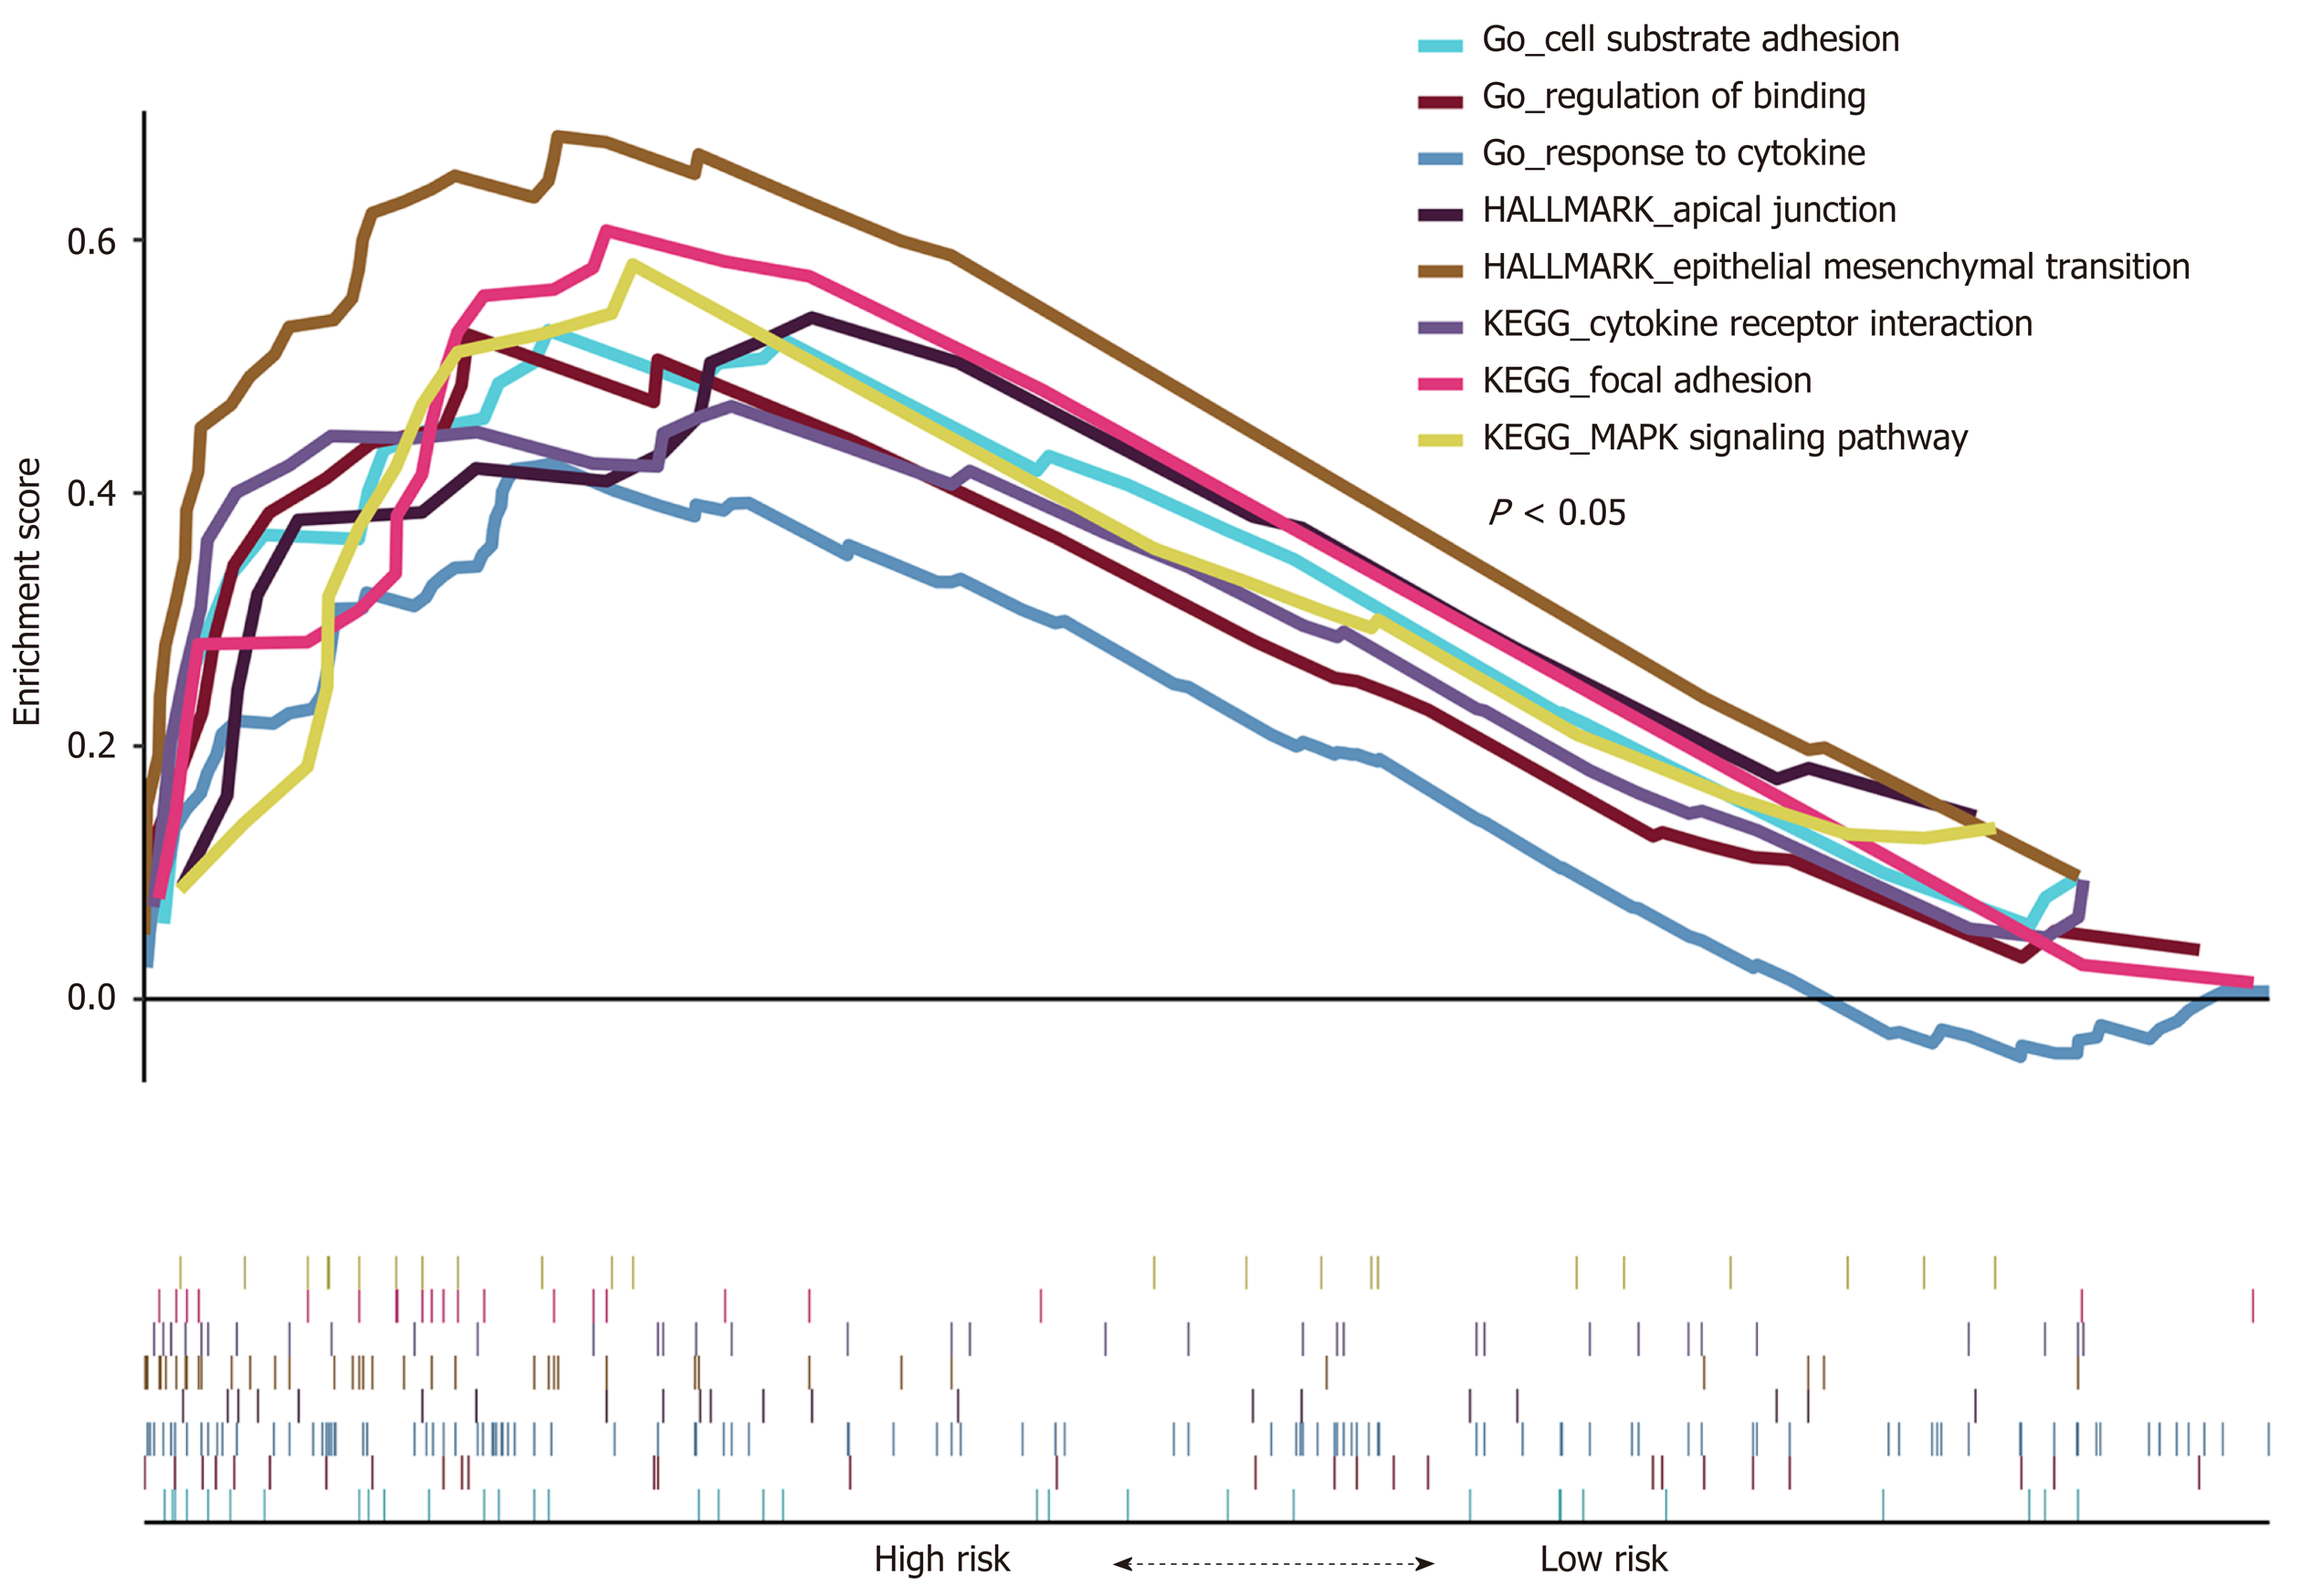
Figure 11 Gene Set Enrichment Analysis for high-risk patients (P < 0.
05). GSEA: Gene Set Enrichment Analysis; GO: Gene Ontology.
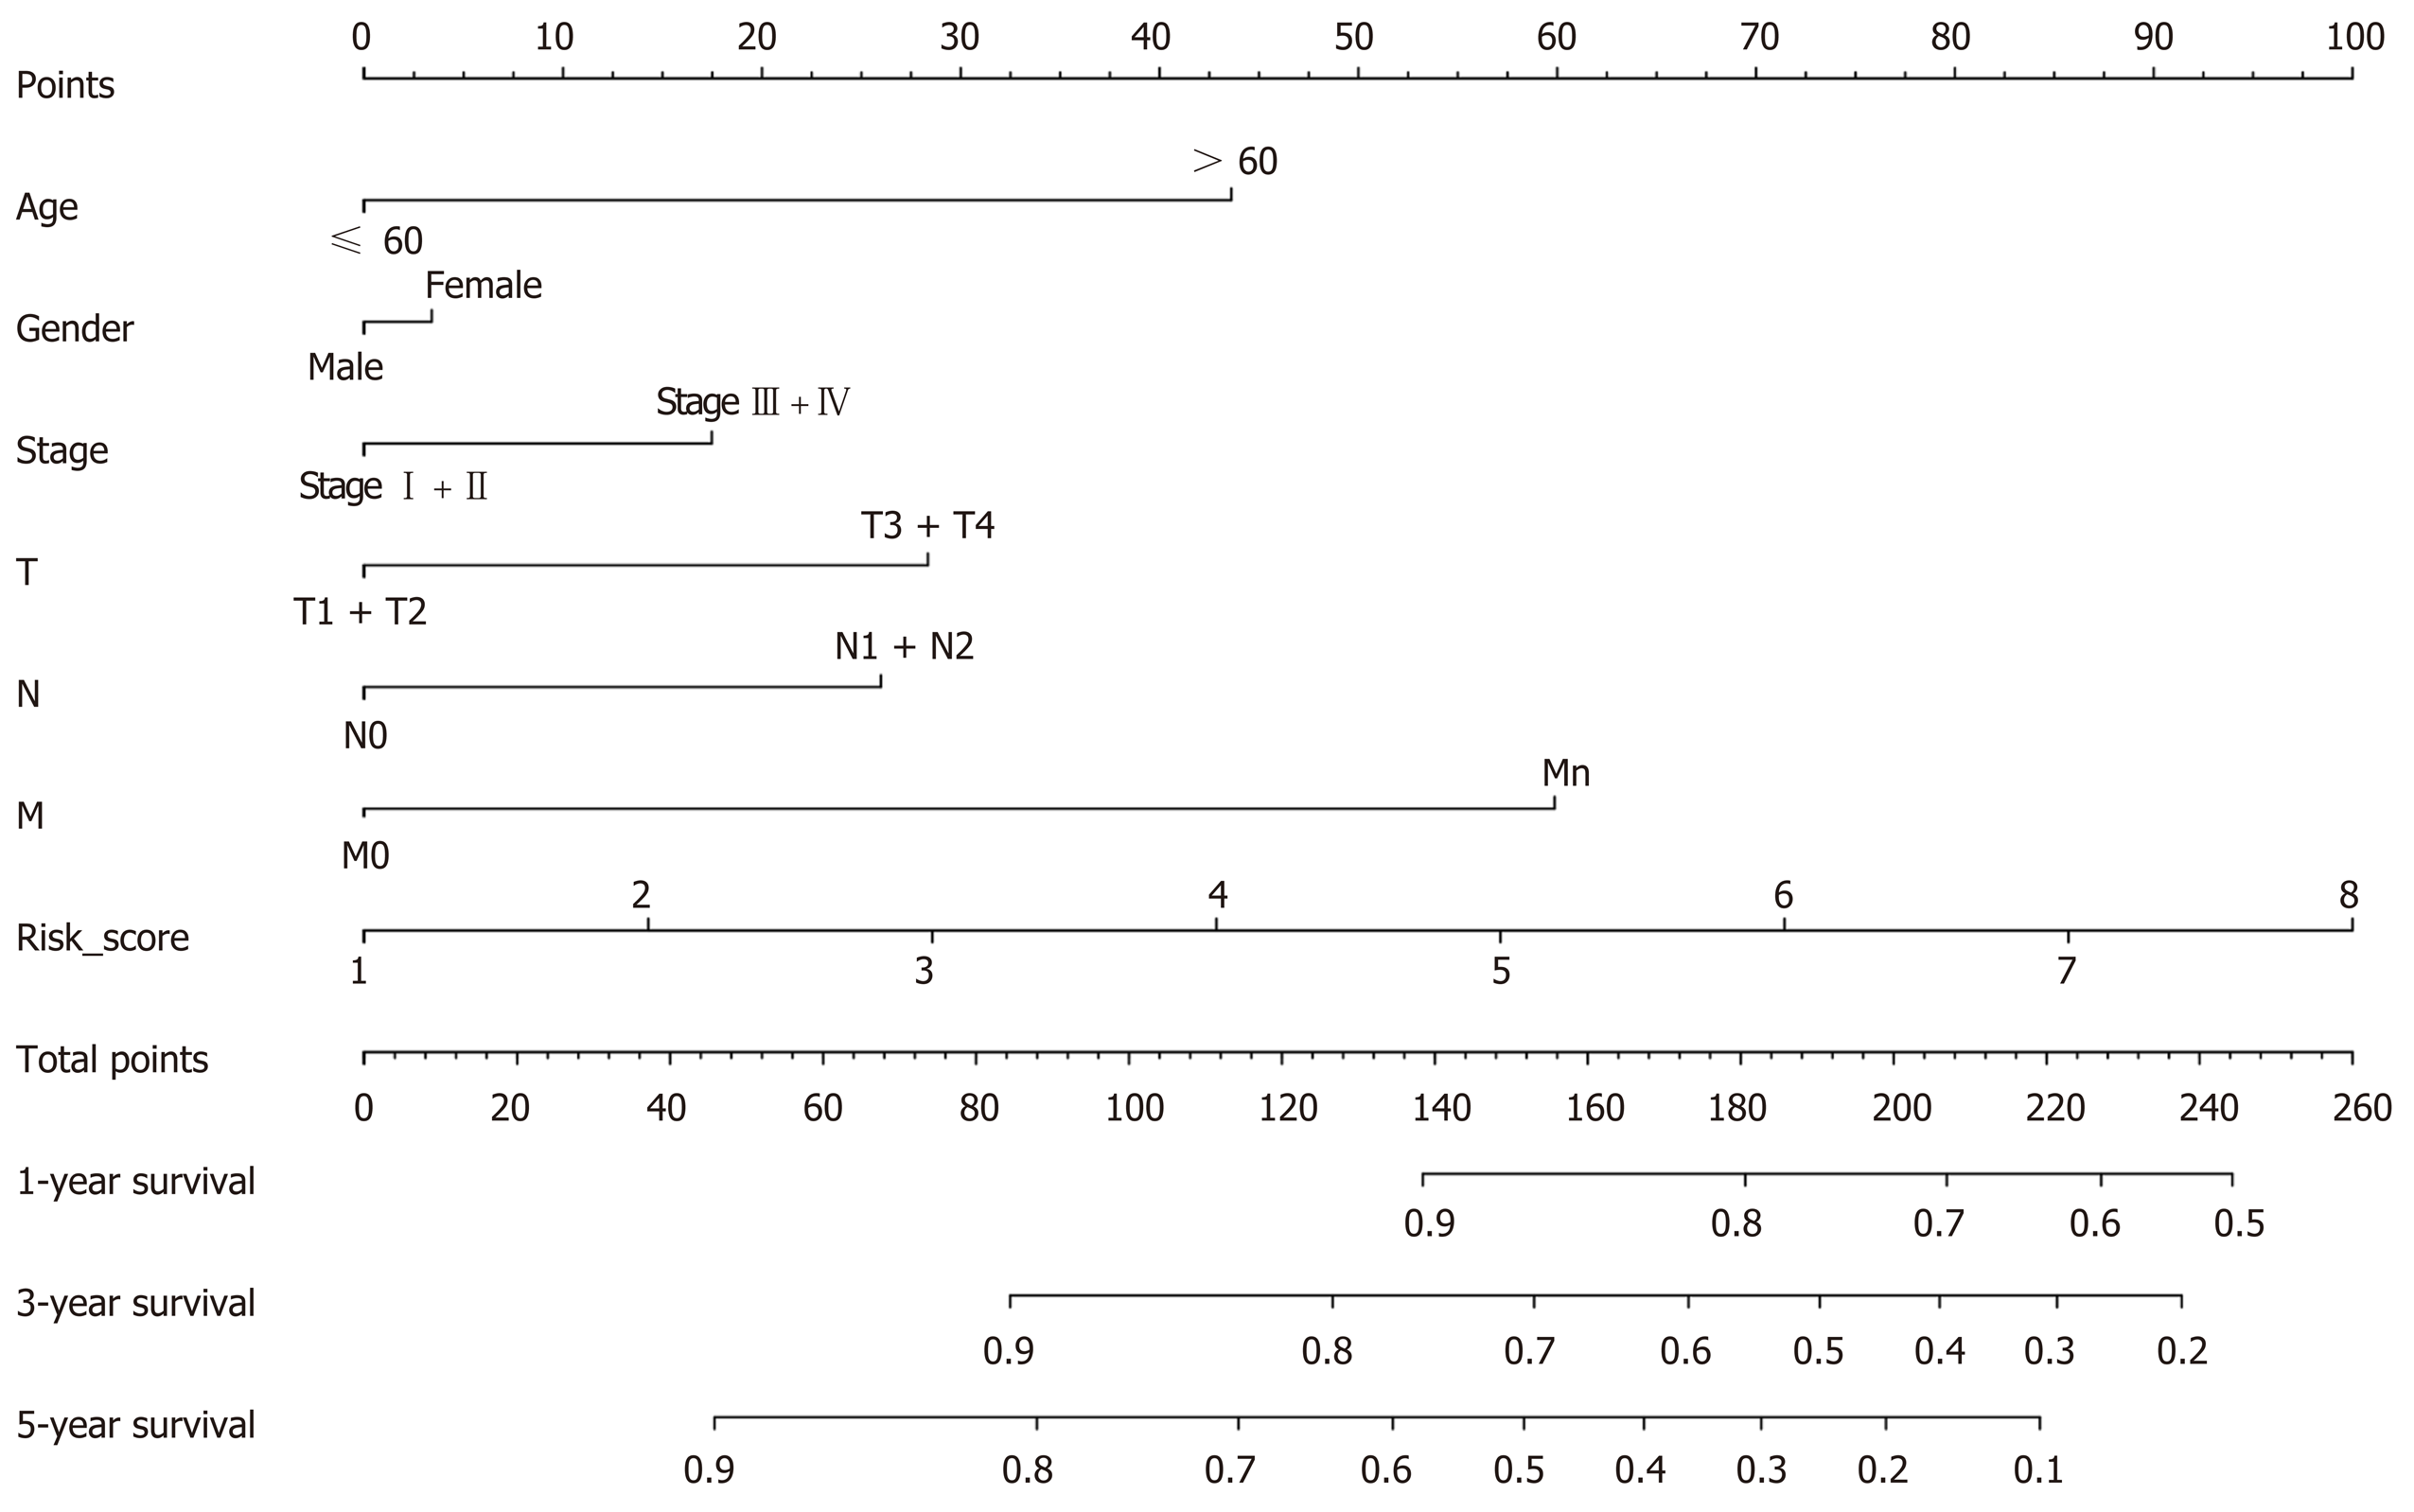
Figure 12 Nomogram construction.
T: Tumor invasion depth; N: Lymph node metastasis; M: Distant metastasis.
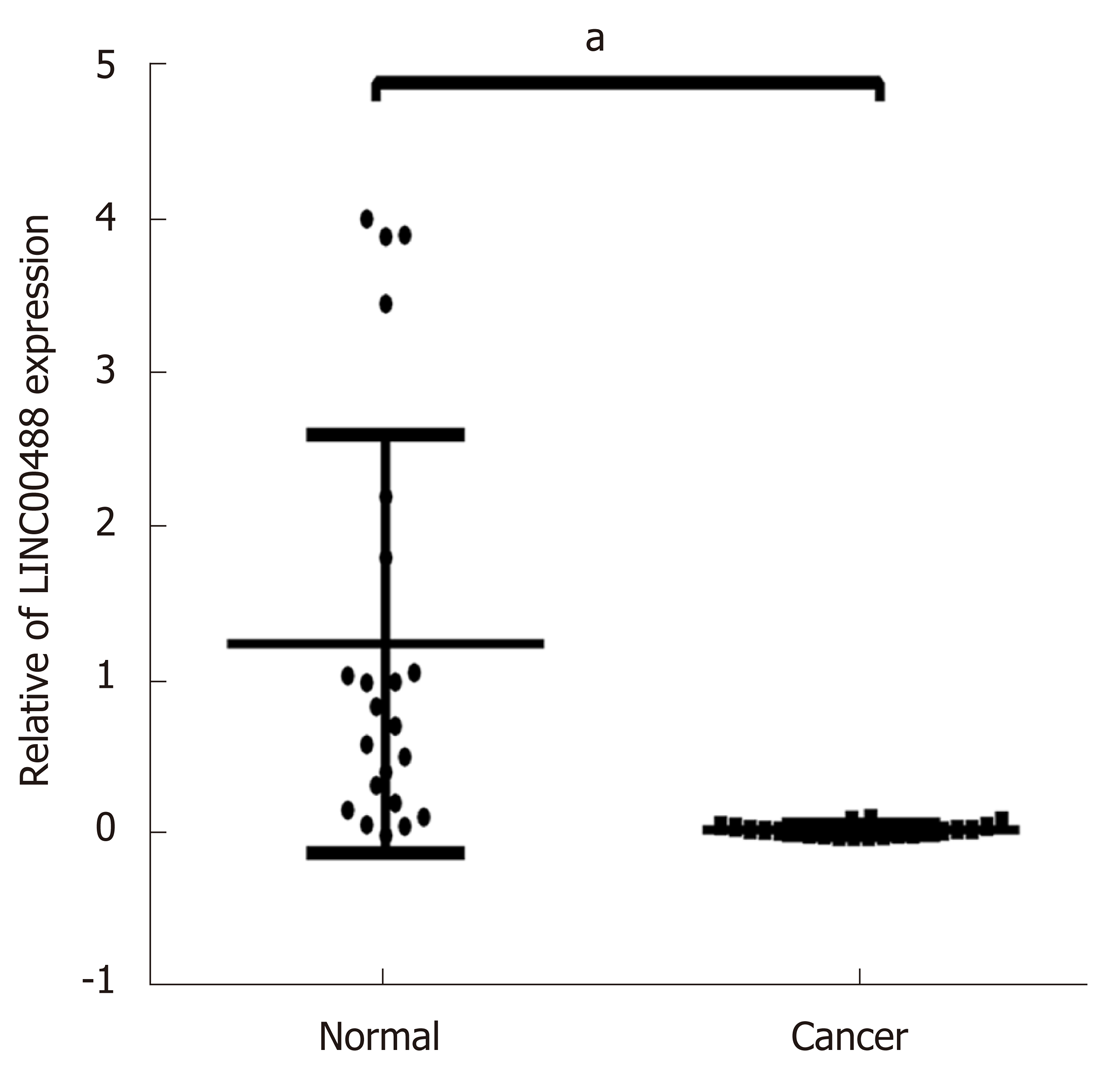
Figure 13 Expression levels of two long noncoding RNAs in the competing endogenous RNA network related to overall survival.
Quantitative real-time polymerase chain reaction analysis demonstrated that LINC00488 was significantly downregulated in colorectal cancer compared to adjacent normal tissues (aP < 0.05).
- Citation: Yang ZD, Kang H. Exploring prognostic potential of long noncoding RNAs in colorectal cancer based on a competing endogenous RNA network. World J Gastroenterol 2020; 26(12): 1298-1316
- URL: https://www.wjgnet.com/1007-9327/full/v26/i12/1298.htm
- DOI: https://dx.doi.org/10.3748/wjg.v26.i12.1298


