Copyright
©The Author(s) 2019.
World J Gastroenterol. Feb 21, 2019; 25(7): 837-847
Published online Feb 21, 2019. doi: 10.3748/wjg.v25.i7.837
Published online Feb 21, 2019. doi: 10.3748/wjg.v25.i7.837
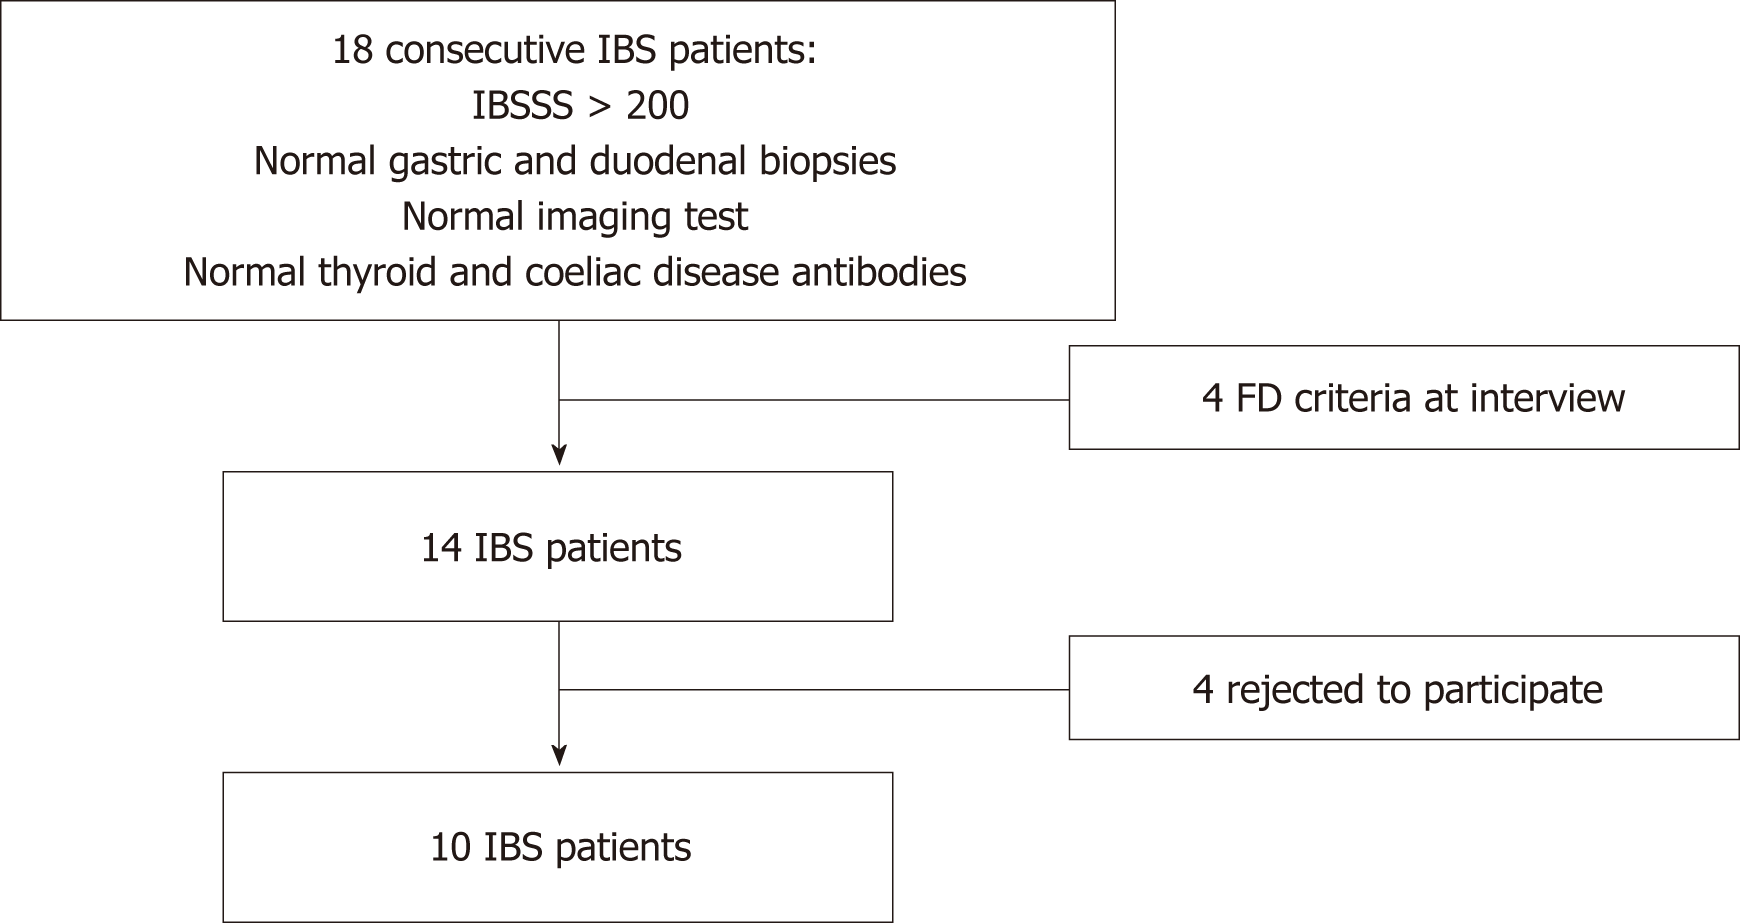
Figure 1 Flowchart of patients recruitment.
Left column shows flow of inclusion and right column the excluded patients. IBS: Irritable bowel syndrome; IBSSS: Irritable bowel severity scoring system; FD: Functional dyspepsia.
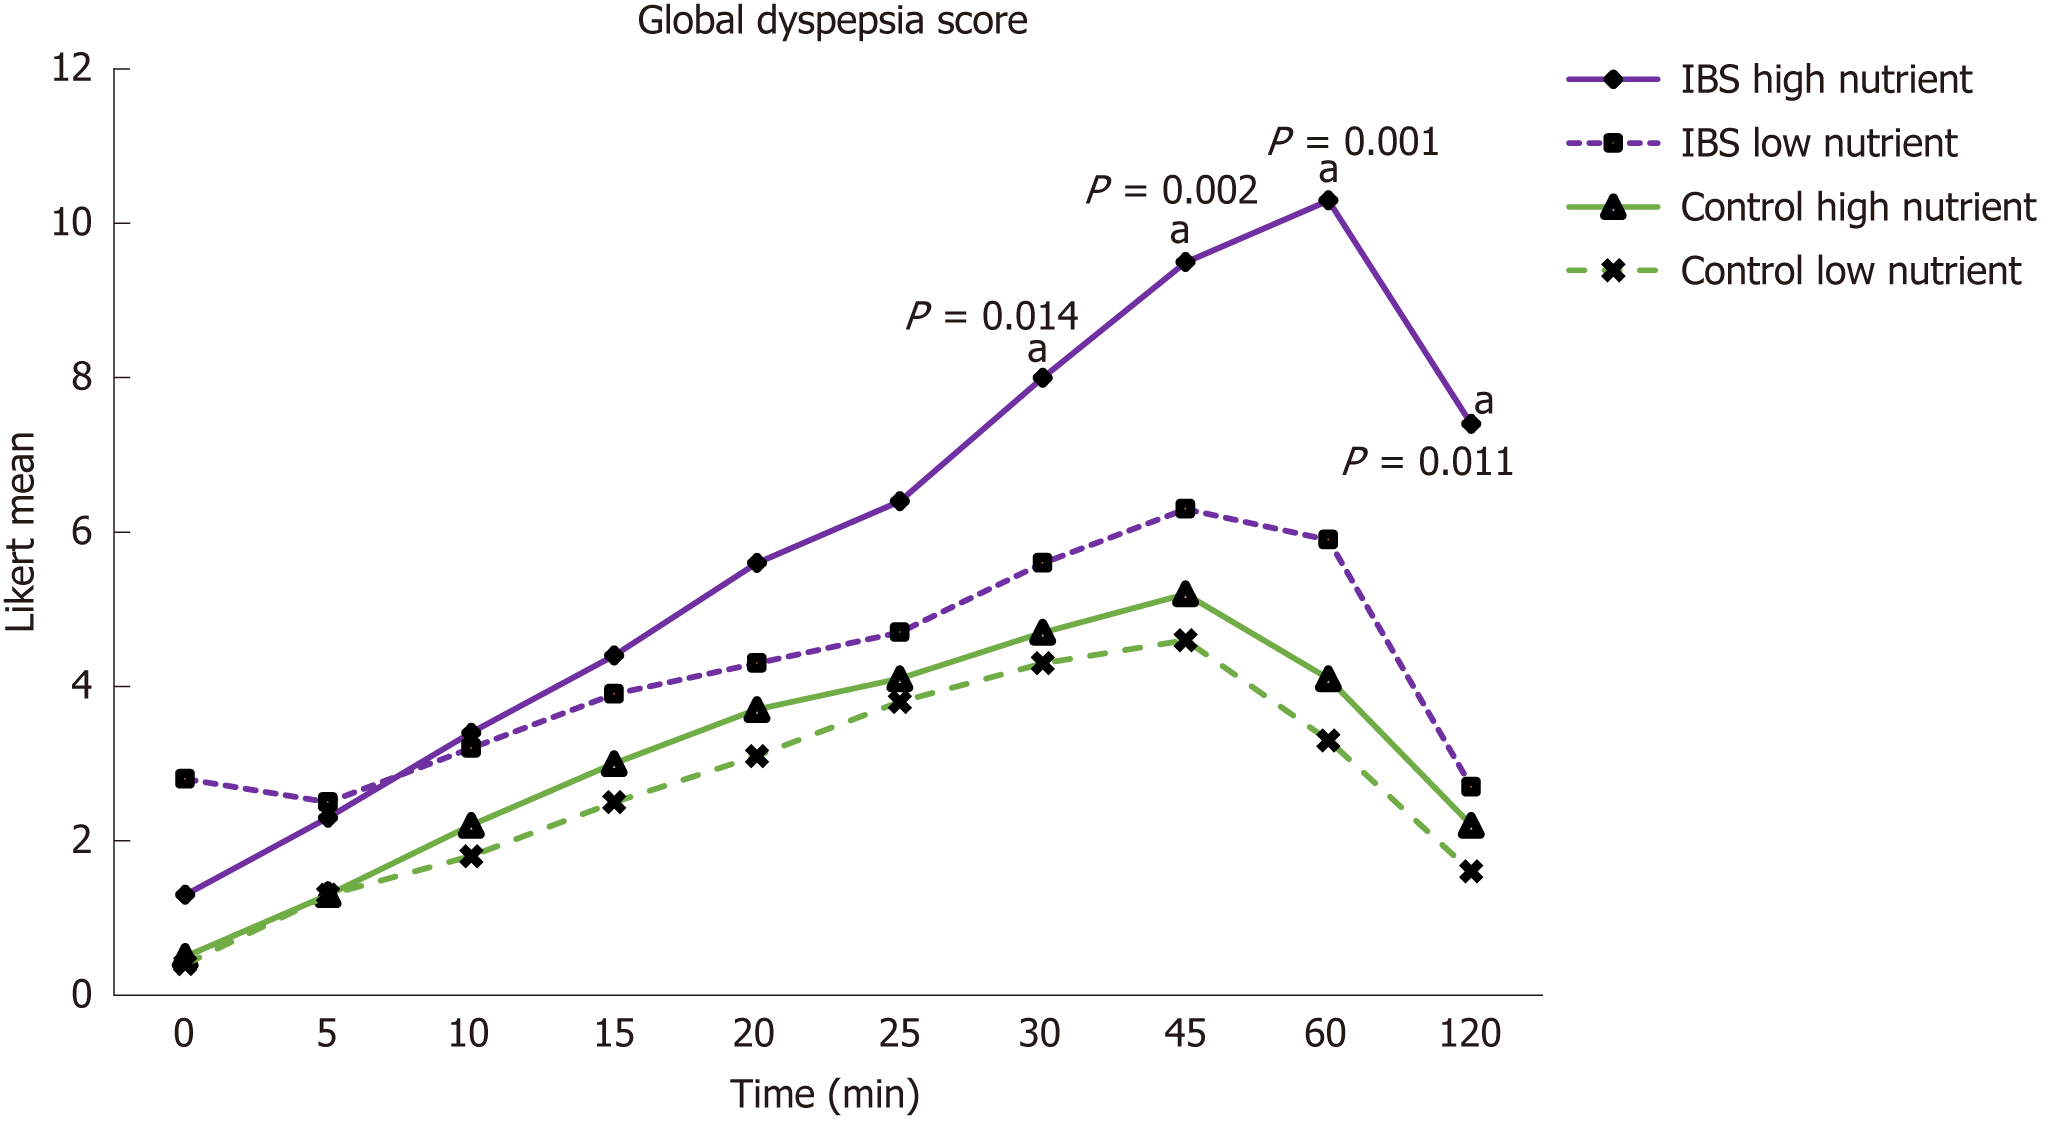
Figure 2 Global dyspepsia in irritable bowel syndrome patients and control subjects after the nutrient drink test.
Global dyspepsia mean Likert score in IBS patients and control subjects was measured for the first 2 h after the two drinks. Statistically significant differences are shown in the graph (aP < 0.05). IBS: Irritable bowel syndrome.
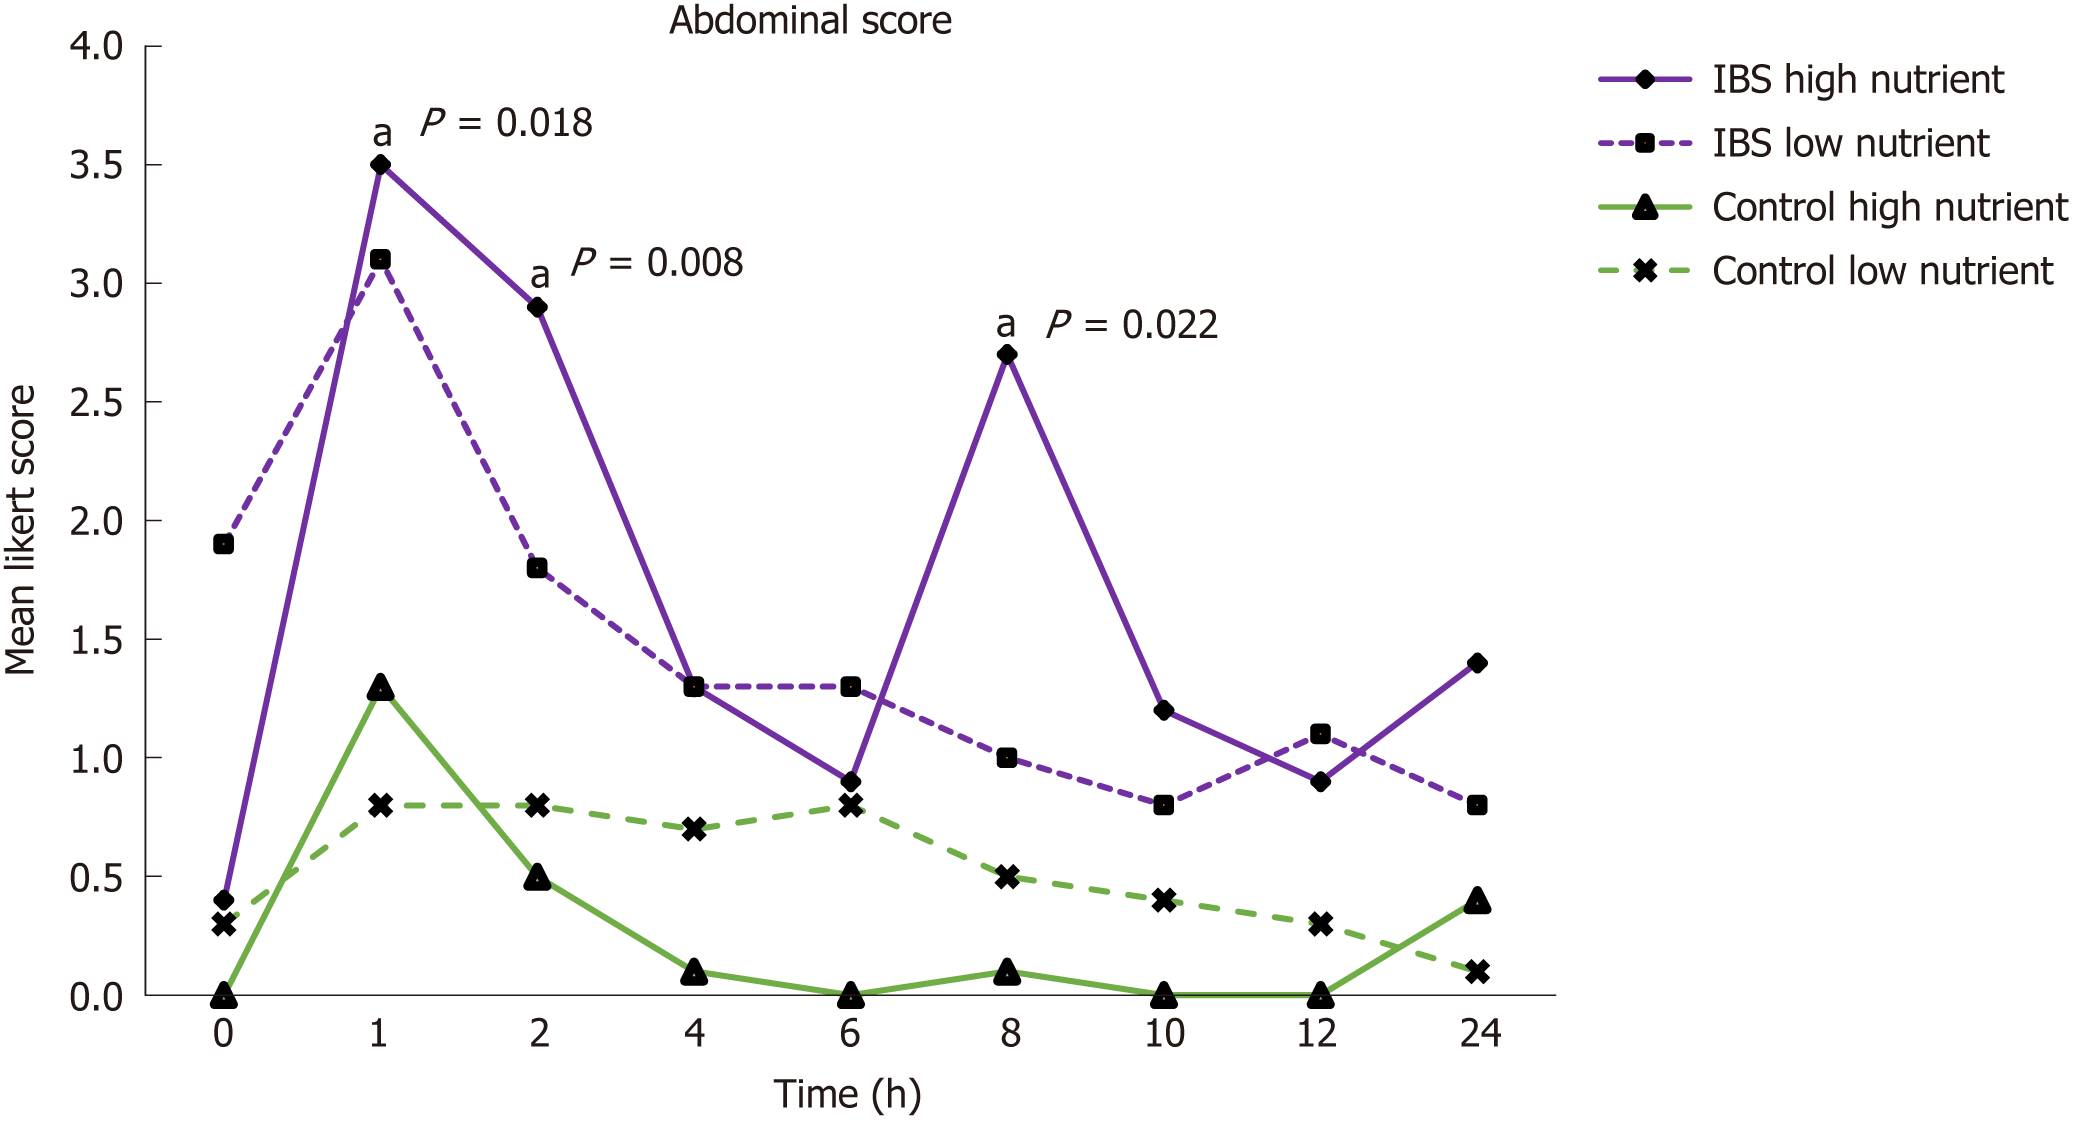
Figure 3 Abdominal symptoms in IBS patients and control subjects after the nutrient drink test.
Abdominal mean Likert score in IBS patients and control subjects were measured after the two test drinks over 24 h. Statistically significant differences are shown in the graph (aP < 0.05). IBS: Irritable bowel syndrome.
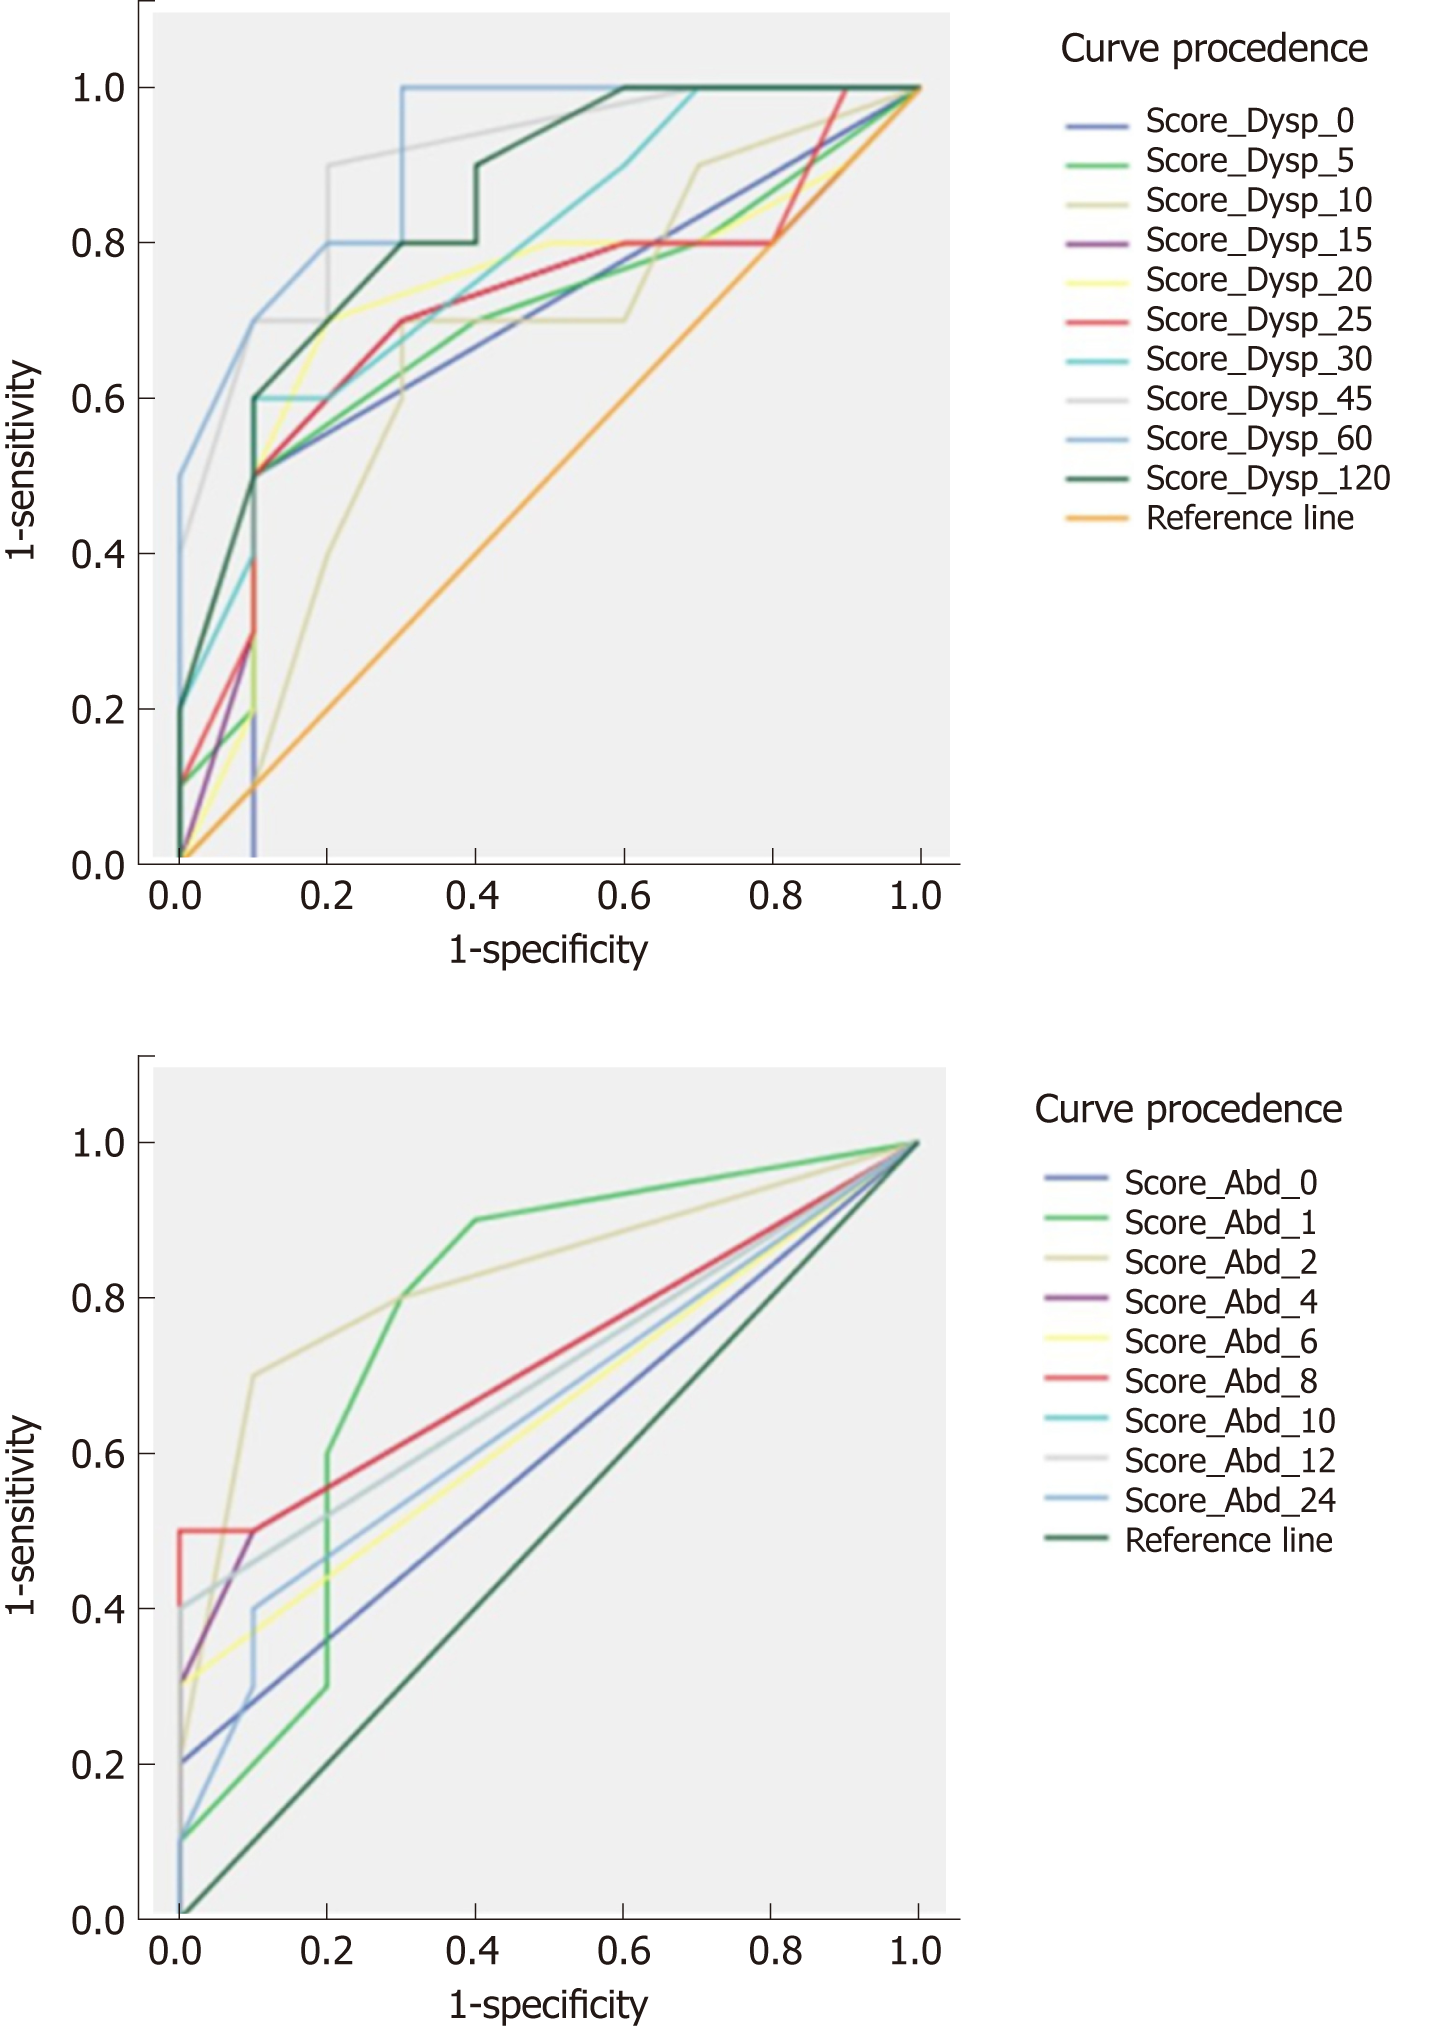
Figure 4 Sensitivity and specificity of the nutrient drink test.
Receiver operating characteristic curves for Global Dyspepsia (upper) and Global Abdominal (lower) scores obtained at the different time points after the high nutrient drink are represented.
- Citation: Estremera-Arevalo F, Barcelo M, Serrano B, Rey E. Nutrient drink test: A promising new tool for irritable bowel syndrome diagnosis. World J Gastroenterol 2019; 25(7): 837-847
- URL: https://www.wjgnet.com/1007-9327/full/v25/i7/837.htm
- DOI: https://dx.doi.org/10.3748/wjg.v25.i7.837


