Copyright
©The Author(s) 2017.
World J Gastroenterol. Aug 21, 2017; 23(31): 5680-5691
Published online Aug 21, 2017. doi: 10.3748/wjg.v23.i31.5680
Published online Aug 21, 2017. doi: 10.3748/wjg.v23.i31.5680
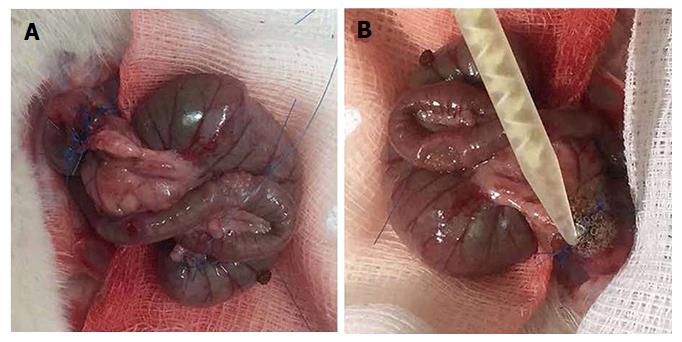
Figure 1 Control and Bioglue group.
A: Creation of end-to-end anastomosis using a single layer of eight interrupted extramucosal 6-0 polypropylene sutures; B: Application of the Bioglue on the colon edges after taking precautions to avoid dispersion of the glue in the peritoneal cavity.
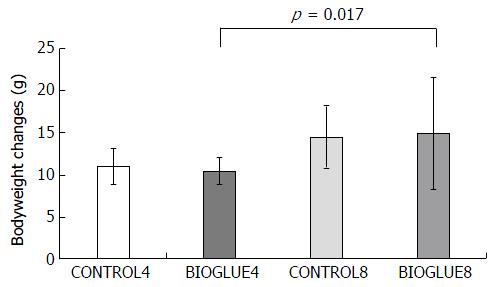
Figure 2 Bodyweight changes in grams in the two groups (mean ± SD).
A statistically significant difference was found between subgroups BIOGLUE4 and BIOGLUE8.
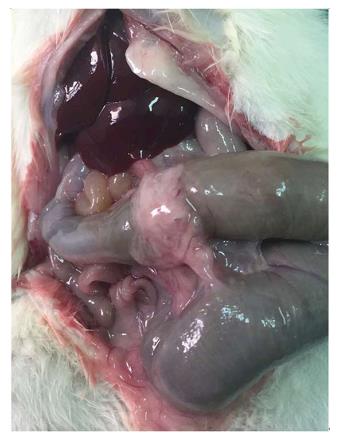
Figure 3 Moderate adhesion formation between the omentum and the anastomotic site in the Bioglue group.
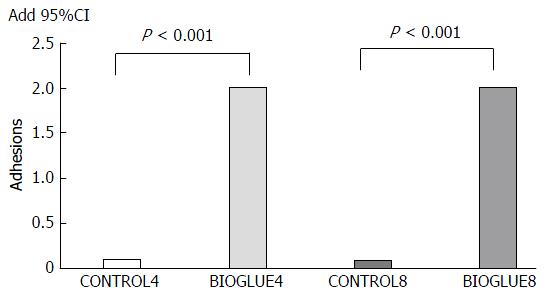
Figure 4 Comparative bar chart of adhesion formation (mean).
The adhesion formation score was statistically significantly higher in both Bioglue subgroups compared to control.
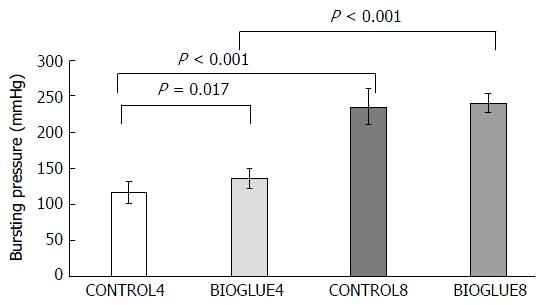
Figure 5 Comparative bar chart presenting bursting pressures (mmHg) (mean ± SD).
A statistically significant increase in the bursting pressure was noted on the fourth postoperative day in the Bioglue subgroup compared to the control.
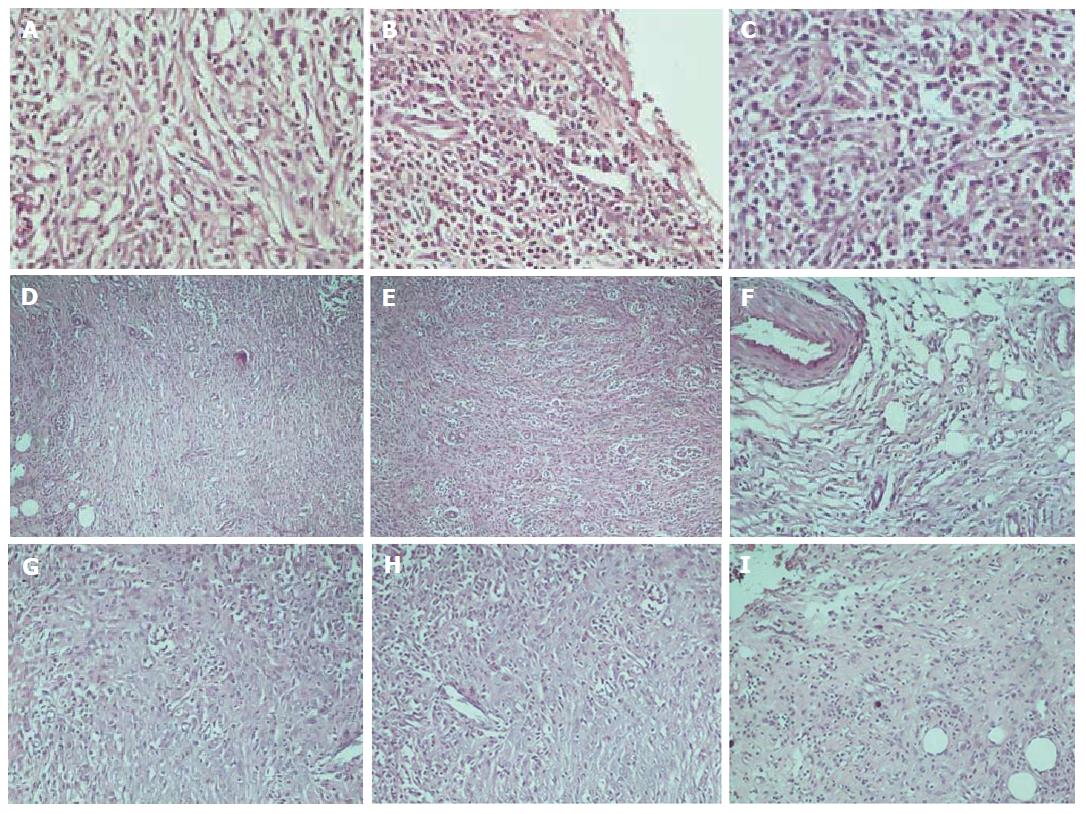
Figure 6 Representative haematoxylin-eosin histopathology images.
A: Inflammatory cell infiltration revealing light scattering (× 400); B: Abundant evidence (× 400); C: Confluent cells (× 400); D: Neoangiogenesis revealing light scattering (A, × 100); E: Abundant evidence (× 100); F: Fibroblast activity revealing light scattering (× 100); G: Abundant evidence (× 200); H: Collagen deposition revealing light scattering (× 200); I: Abundant evidence (× 100).
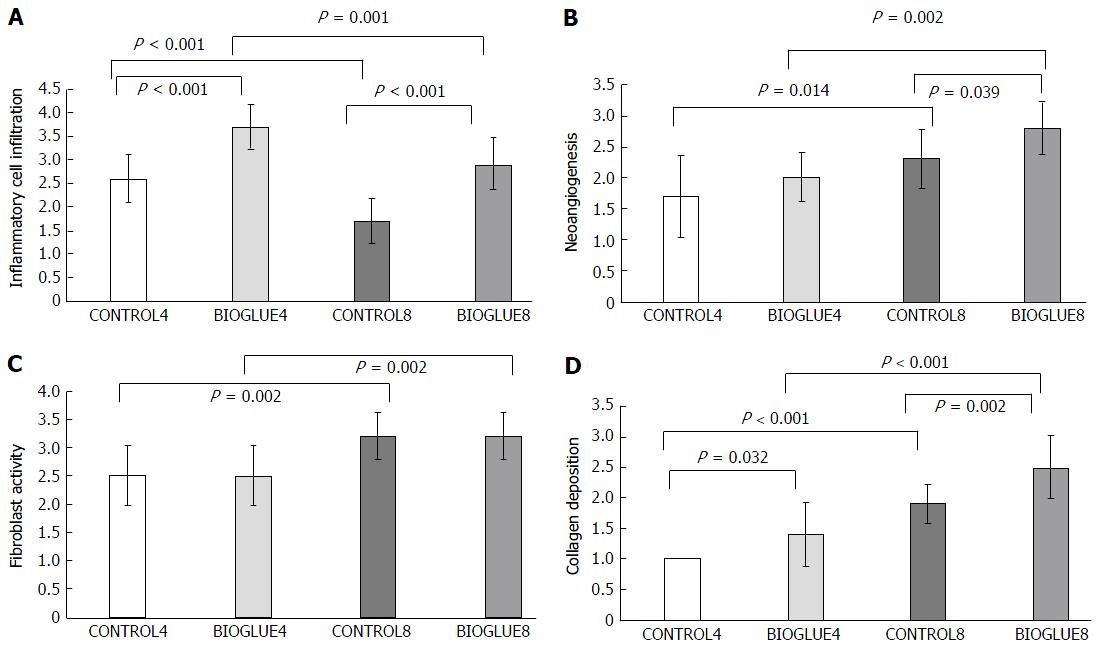
Figure 7 Comparative bar chart presenting the average inflammatory cell infiltration (A), new vessel formation (neoangiogenesis) (B), fibroblast activity (C) and collagen deposition (D), according to the scale of Ehrlich and Hunt, as modified by Phillips et al[19] (0-4) (mean ± SD).
A: The average inflammatory cell infiltration was statistically significantly higher in the Bioglue subgroups on both the fourth and eighth days than in the controls. Also, in each subgroup, there was a statistically significant decrease in the average inflammatory cell infiltration from the fourth to the eighth day; B: The average neoangiogenesis was statistically significantly higher in the Bioglue subgroups on the eighth day than in the control. Also, in each subgroup, there was a statistically significant increase in neoangiogenesis from the fourth to the eighth day; C: The average fibroblast activity was statistically significantly higher in each subgroup from the fourth to the eighth day; D: The average collagen deposition was statistically significantly higher in the Bioglue subgroups on both the fourth and eighth days than in the control. Also, in each subgroup there was a statistically significant increase in collagen deposition from the fourth to the eighth day.
Figure 8 Comparative bar chart of hydroxyproline tissue contents (A), collagenase I tissue contents (B) (μg/g tissue) at the anastomotic site (mean ± SD).
A: In each subgroup, there was a statistically significant increase in hydroxyproline tissue content from the fourth to the eighth day; B: No statistically significant difference was noted.
- Citation: Despoudi K, Mantzoros I, Ioannidis O, Cheva A, Antoniou N, Konstantaras D, Symeonidis S, Pramateftakis MG, Kotidis E, Angelopoulos S, Tsalis K. Effects of albumin/glutaraldehyde glue on healing of colonic anastomosis in rats. World J Gastroenterol 2017; 23(31): 5680-5691
- URL: https://www.wjgnet.com/1007-9327/full/v23/i31/5680.htm
- DOI: https://dx.doi.org/10.3748/wjg.v23.i31.5680


