Copyright
©The Author(s) 2017.
World J Gastroenterol. Jul 21, 2017; 23(27): 4920-4934
Published online Jul 21, 2017. doi: 10.3748/wjg.v23.i27.4920
Published online Jul 21, 2017. doi: 10.3748/wjg.v23.i27.4920
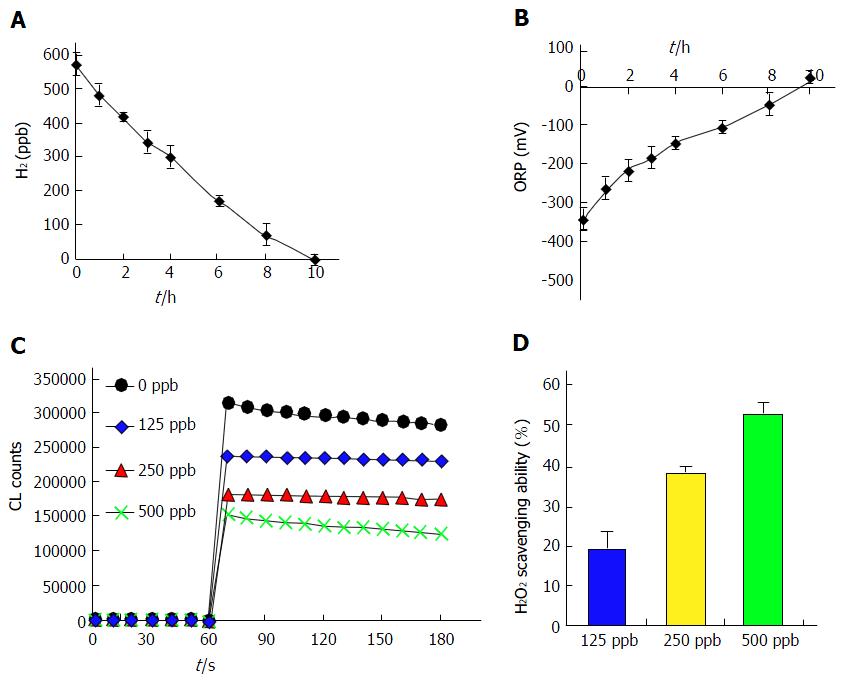
Figure 1 Scavenging of hydrogen peroxide by hydrogen-rich water in vitro.
A: The hydrogen content in HRW displayed a time-dependent decline and reach zero at 10 h when exposed to air; B: Accordingly, the values of ORP also rapidly returned to baseline at 10 h; C: Scavenging ROS ability measured with chemiluminescence emission by luminol. Values for chemiluminescence intensity were showed as counts for every 10 s in 180 s; D: ROS scavenging ability was calculated as averages from 60 to 180 s using the area under the curve. Values are expressed as means ± SD of three independent experiments. HRW: Hydrogen-rich water; ORP: Oxidation-reduction potential; ROS: Reactive oxygen species.
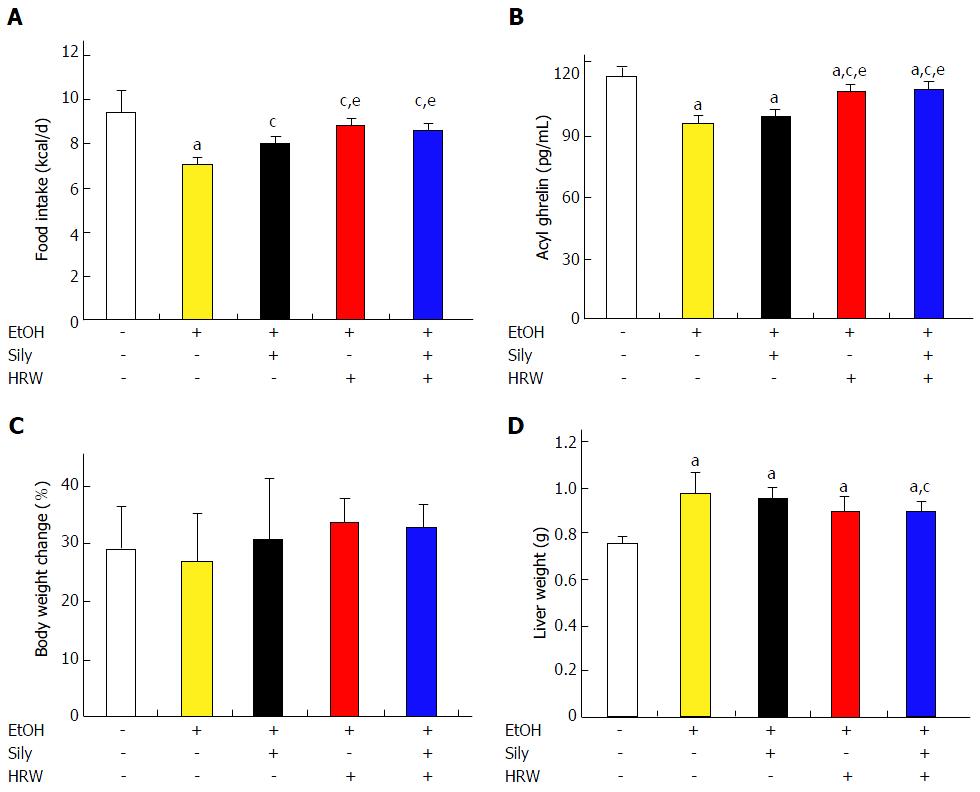
Figure 2 Effect of hydrogen-rich water on food intake, acyl ghrelin, body weight and liver weight in chronic-binge ethanol-fed C57BL/6J mice.
The levels of acyl ghrelin in serum were measured. The values are the mean ± SD from 8-10 mice for each group and at least three independent measurements. aP < 0.05 vs control group, cP < 0.05 vs EtOH group, and eP < 0.05 vs silymarin group. EtOH: Ethanol; HRW: Hydrogen-rich water; Sily: Silymarin.
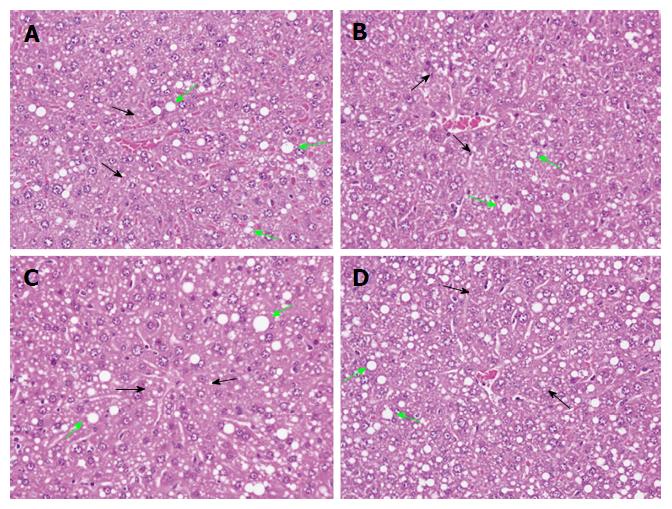
Figure 3 Histopathological alterations of livers treated with chronic-binge ethanol-fed C57BL/6J mice.
Livers showed fatty change with micro- mixed macro-vesicles and were graded as mild in the EtOH (A), slight in the EtOH + silymarin (B), mild in the EtOH + HRW (C) and EtOH + silymarin + HRW (D) groups. H and E stain, 400 ×. Black arrow indicates the micro-vesicles and green arrow indicates the macro-vesicles. EtOH: Ethanol; HRW: Hydrogen-rich water.
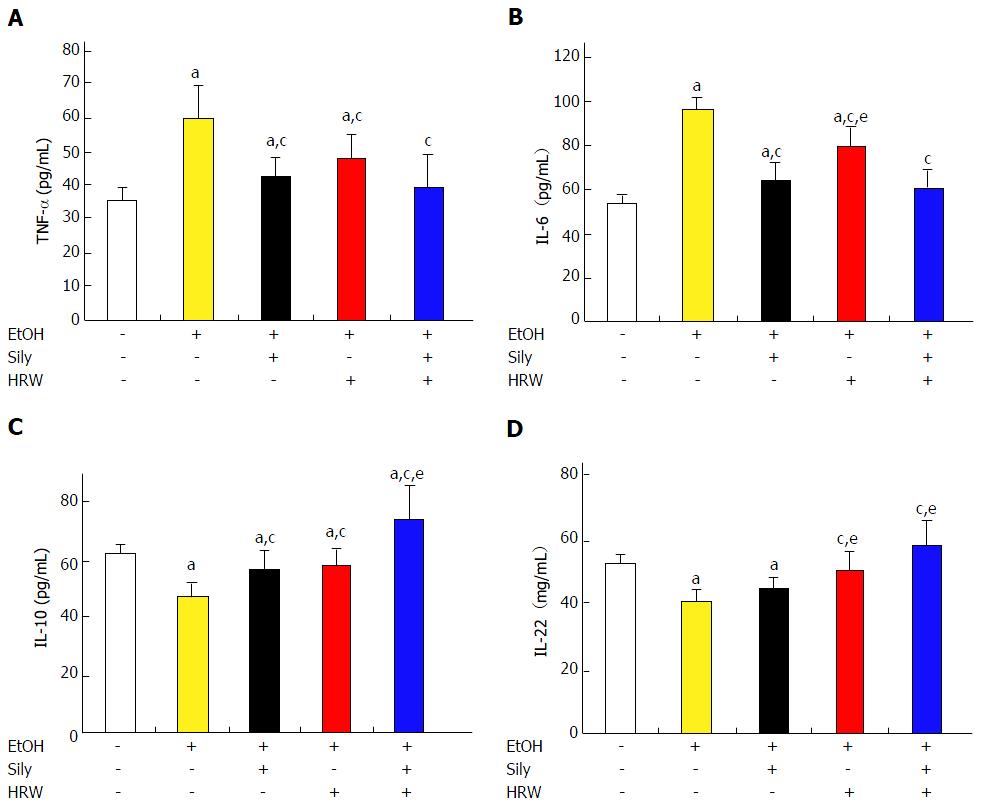
Figure 4 Anti-inflammatory effect of hydrogen-rich water on cytokines in chronic-binge ethanol-fed C57BL/6J mice.
A and B: The levels of (A) TNF-α and (B) IL-6 in serum were measured as pro-inflammatory markers; C and D: In relative terms, (C) IL-10 and (D) IL-22 in serum were measured as anti-inflammatory markers. The values representare the mean ± SD from 8-10 mice for each group and at least three independent measurements. aP < 0.05 vs control group, cP < 0.05 vs EtOH group, and eP < 0.05 vs silymarin group. EtOH: Ethanol; HRW: Hydrogen-rich water; IL: Interleukin; Sily: Silymarin; TNF-α: Tumor necrosis factor-alpha.
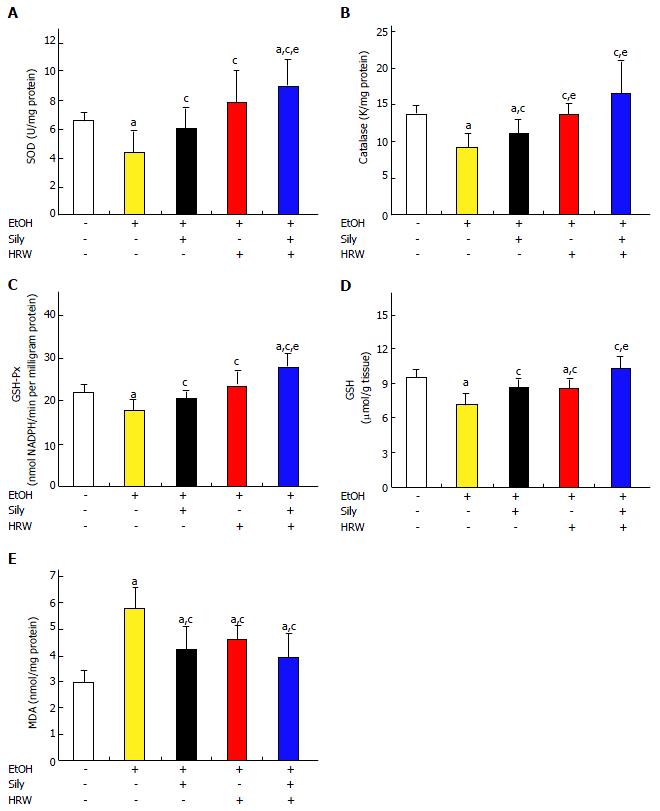
Figure 5 Antioxidative effect of hydrogen-rich water on activities of related antioxidant enzymes and lipid oxidation product in chronic-binge ethanol-fed C57BL/6J mice.
A-D: Hepatic activities of antioxidant enzyme levels (A-C) and (D) GSH content were measured; E: Hepatic levels of MDA were shown as markers of oxidative stress. The values are the mean ± SD from 8-10 mice for each group and at least three independent measurements. aP < 0.05 vs control group, cP < 0.05 vs EtOH group, and eP < 0.05 vs silymarin group. EtOH: Ethanol; GSH: Glutathione; GSH-Px: Glutathione peroxidase; HRW: Hydrogen-rich water; MDA: Malondialdehyde; Sily: Silymarin; SOD: Superoxide dismutase.
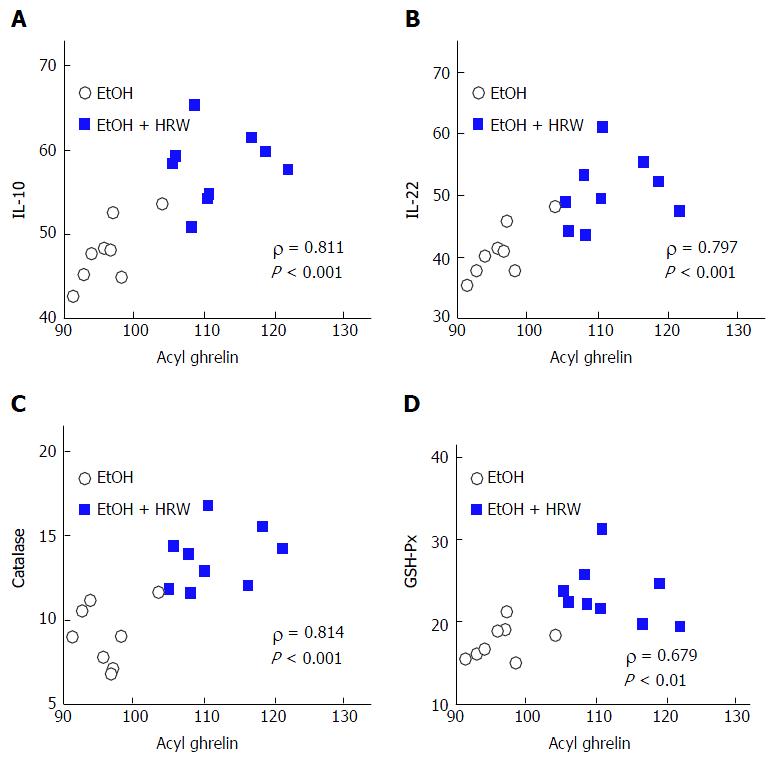
Figure 6 Relationship between acyl ghrelin with (A) interleukin-10, (B) interleukin-22, (C) Catalase, and (D) glutathione peroxidase.
EtOH: Ethanol; GSH-Px: Glutathione peroxidase; HRW: Hydrogen-rich water; IL: Interleukin.
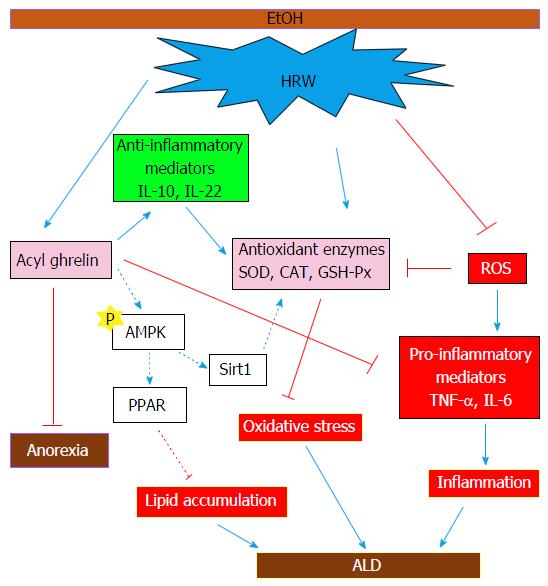
Figure 7 Schematic hypothesis of the mechanisms involved in the protective effects against ethanol-induced fatty liver of hydrogen-rich water.
ALD: Alcoholic liver disease; AMPK: AMP-activated protein kinase; CAT: Catalase; EtOH: Ethanol; GSH-Px: Glutathione peroxidase; HRW: Hydrogen-rich water; IL: Interleukin; PPAR: Peroxisome proliferator-activated receptor; ROS: Reactive oxygen species; Sirt 1: Sirtuin 1; SOD: Superoxide dismutase; TNF-α: Tumor necrosis factor-alpha.
- Citation: Lin CP, Chuang WC, Lu FJ, Chen CY. Anti-oxidant and anti-inflammatory effects of hydrogen-rich water alleviate ethanol-induced fatty liver in mice. World J Gastroenterol 2017; 23(27): 4920-4934
- URL: https://www.wjgnet.com/1007-9327/full/v23/i27/4920.htm
- DOI: https://dx.doi.org/10.3748/wjg.v23.i27.4920


