Copyright
©The Author(s) 2017.
World J Gastroenterol. Jun 21, 2017; 23(23): 4211-4221
Published online Jun 21, 2017. doi: 10.3748/wjg.v23.i23.4211
Published online Jun 21, 2017. doi: 10.3748/wjg.v23.i23.4211
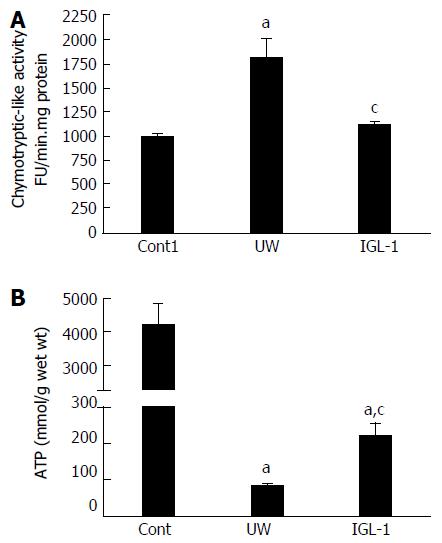
Figure 1 Chymotryptic-like proteasome activity (A) and ATP content (B) in steatotic livers after cold preservation.
aP < 0.05 vs Cont1, cP < 0.05 vs UW. Cont1: Liver flushed without cold preservation; UW: Liver preserved in UW solution; IGL-1: Liver preserved in IGL-1 solution; UW: University of Wisconsin; IGL-1: Institut Georges Lopez-1.
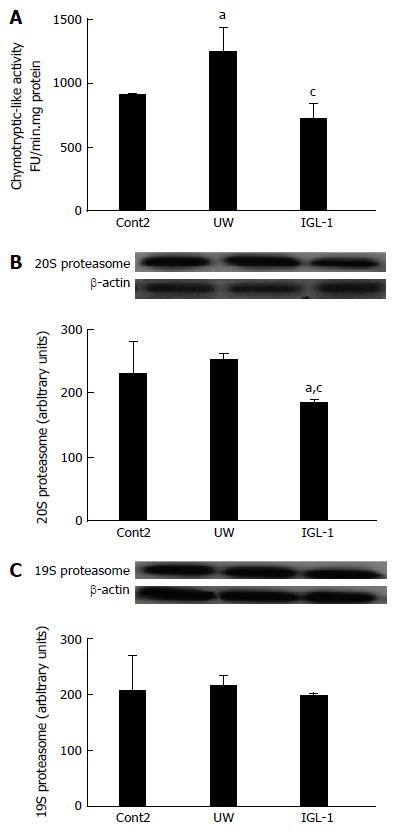
Figure 2 Chymotryptic-like activity (A) and 20S (B) and 19S (C) protein levels after reperfusion.
Representative Western blot at the top and densitometric analysis at the bottom of 20S (B) and 19S (C). aP < 0.05 vs Cont2, cP < 0.05 vs UW. Cont2: Liver flushed and perfused ex vivo without cold preservation; UW: Liver preserved in UW solution; IGL-1: Liver preserved in IGL-1 solution; UW: University of Wisconsin; IGL-1: Institut Georges Lopez-1.
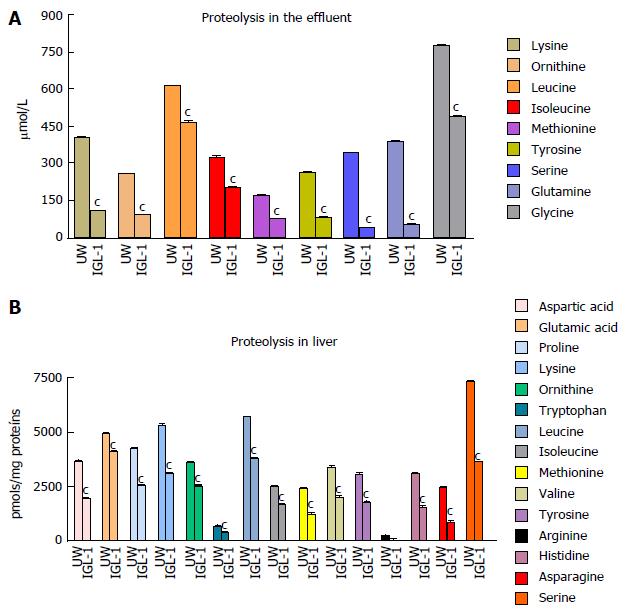
Figure 3 Proteolysis in effluent and liver grafts after reperfusion.
Amino acid levels in the effluent and tissue after reperfusion. cP < 0.05 vs UW. UW: Liver preserved in UW solution; IGL-1: Liver preserved in IGL-1 solution; UW: University of Wisconsin; IGL-1: Institut Georges Lopez-1.
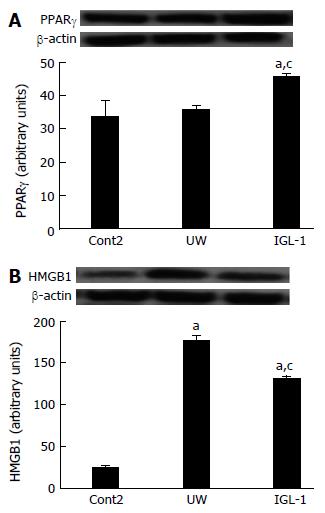
Figure 4 PPARγ and HMGB-1 protein levels after reperfusion.
Representative Western blot at the top and densitometric analysis at the bottom of protein levels of PPARγ (A) and HMGB-1 (B) in steatotic liver grafts. aP < 0.05 vs Cont2, cP < 0.05 vs UW. Cont2: Liver flushed and perfused ex vivo without cold preservation; UW: Liver preserved in UW solution; IGL-1: Liver preserved in IGL-1 solution; UW: University of Wisconsin; IGL-1: Institut Georges Lopez-1.
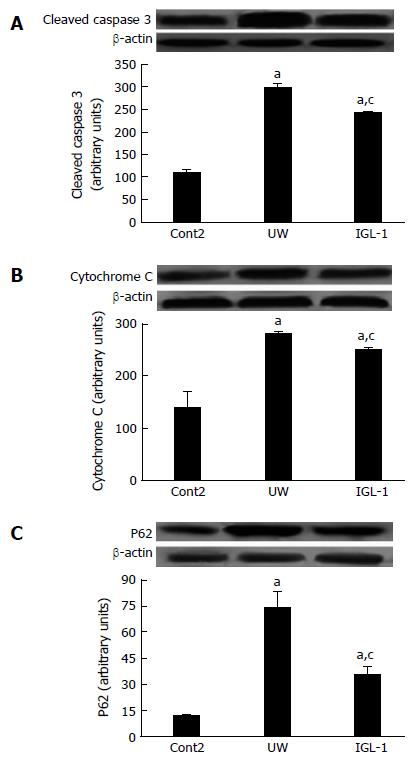
Figure 5 Liver graft apoptosis and autophagy after reperfusion.
Representative Western blot at the top and densitometric analysis at the bottom of protein levels of cleaved caspase 3 (A), cytochrome C (B) and P62 (C) in steatotic liver grafts. aP < 0.05 vs Cont2, cP < 0.05 vs UW. Cont2: Liver flushed and perfused ex vivo without cold preservation; UW: Liver preserved in UW solution; IGL-1: Liver preserved in IGL-1 solution; UW: University of Wisconsin; IGL-1: Institut Georges Lopez-1.
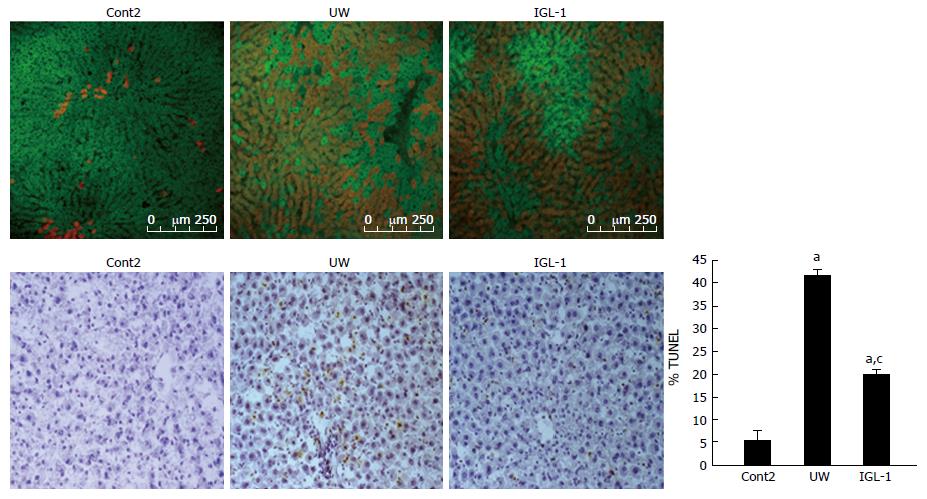
Figure 6 Confocal microscopy findings and Tunel assay after reperfusion.
Confocal microscopy images showing green fluorescence of rhodamine 123 cell viability marker and Evans blue dye (in red) used as a viability assay on the basis of its penetration into non-viable cells. Representative light photomicrographs of TUNEL-stained sections. Steatotic livers submitted to cold storage preservation with UW showed numerous positive cells (both hepatocytes and sinusoidal lining cells) compared with control non-preserved livers. The positivity decreased when the livers were submitted to cold storage preservation with IGL-1 solution. aP < 0.05 vs Cont2, cP < 0.05 vs UW. Scale bar 50 μm. Cont2: Liver flushed and perfused ex vivo without cold preservation; UW: Liver preserved in UW solution; IGL-1: Liver preserved in IGL-1 solution; UW: University of Wisconsin; IGL-1: Institut Georges Lopez-1.
- Citation: Zaouali MA, Panisello-Roselló A, Lopez A, Castro Benítez C, Folch-Puy E, García-Gil A, Carbonell T, Adam R, Roselló-Catafau J. Relevance of proteolysis and proteasome activation in fatty liver graft preservation: An Institut Georges Lopez-1 vs University of Wisconsin appraisal. World J Gastroenterol 2017; 23(23): 4211-4221
- URL: https://www.wjgnet.com/1007-9327/full/v23/i23/4211.htm
- DOI: https://dx.doi.org/10.3748/wjg.v23.i23.4211


