Copyright
©The Author(s) 2016.
World J Gastroenterol. Feb 14, 2016; 22(6): 2133-2141
Published online Feb 14, 2016. doi: 10.3748/wjg.v22.i6.2133
Published online Feb 14, 2016. doi: 10.3748/wjg.v22.i6.2133
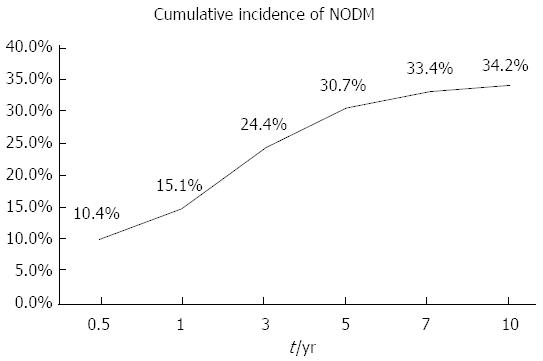
Figure 1 Cumulative incidence of new-onset diabetes mellitus over a 10-year period after liver transplantation.
NODM: New-onset diabetes mellitus.
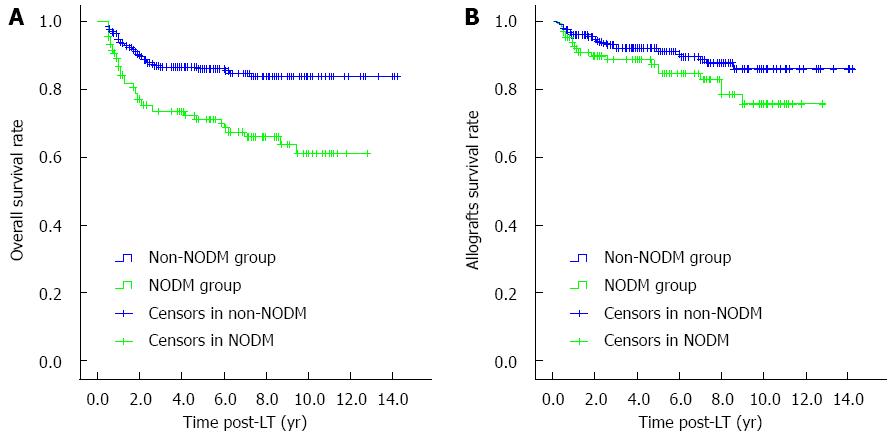
Figure 2 Survival rates of liver recipients in non-new-onset diabetes mellitus and new-onset diabetes mellitus groups.
A: Overall survival rates (P < 0.05); B: Allograft survival rates (P < 0.05). NODM: New-onset diabetes mellitus; LT: Liver transplantation.
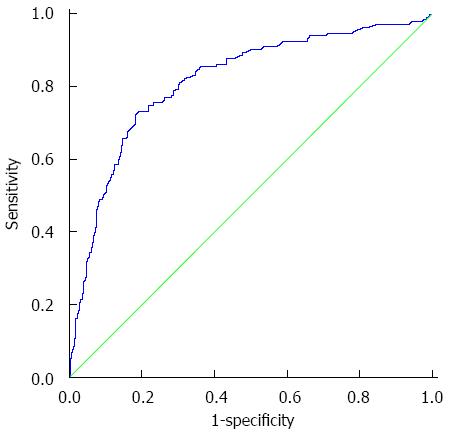
Figure 3 Receiver operating characteristic curve for mean cTAC after 6 mo to predict new-onset diabetes mellitus after transplantation.
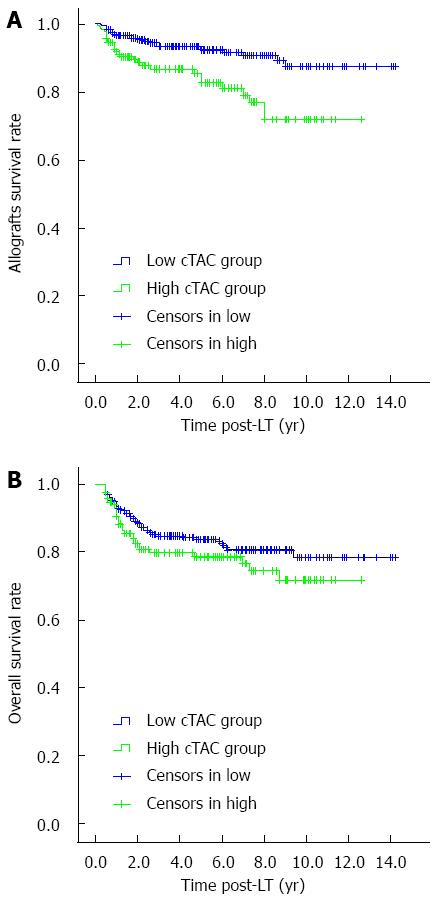
Figure 4 Survival rates of recipients in low and high mean tacrolimus trough concentration groups (P < 0.
05). A: Allograft survival rates; B: Overall survival rate (P = 0.129). Low mean cTAC group: mean cTAC < 5.89 ng/mL; High cTAC group: mean cTAC ≥ 5.89 ng/mL. cTAC: Tacrolimus trough concentration; LT: Liver transplantation.
- Citation: Song JL, Gao W, Zhong Y, Yan LN, Yang JY, Wen TF, Li B, Wang WT, Wu H, Xu MQ, Chen ZY, Wei YG, Jiang L, Yang J. Minimizing tacrolimus decreases the risk of new-onset diabetes mellitus after liver transplantation. World J Gastroenterol 2016; 22(6): 2133-2141
- URL: https://www.wjgnet.com/1007-9327/full/v22/i6/2133.htm
- DOI: https://dx.doi.org/10.3748/wjg.v22.i6.2133


