Copyright
©The Author(s) 2016.
World J Gastroenterol. Jun 28, 2016; 22(24): 5479-5494
Published online Jun 28, 2016. doi: 10.3748/wjg.v22.i24.5479
Published online Jun 28, 2016. doi: 10.3748/wjg.v22.i24.5479
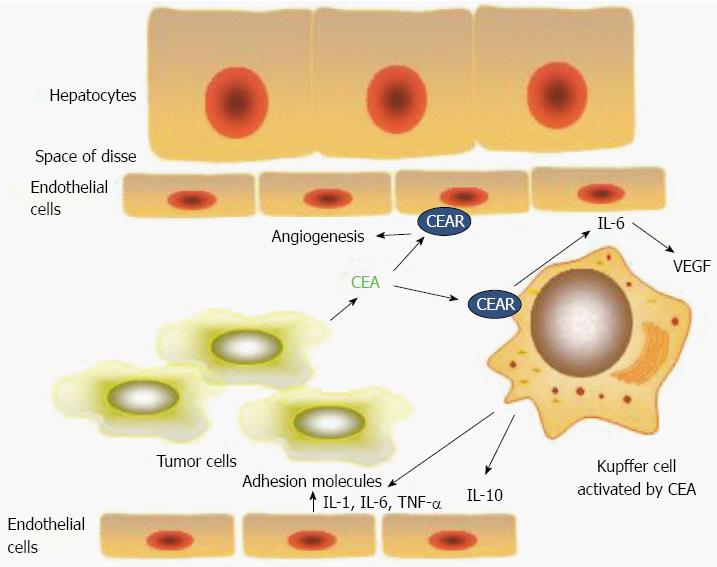
Figure 1 Schematic of the interactions of carcinoembryonic antigen in the hepatic sinusoid.
Interactions of carcinoembryonic antigen (CEA) in the hepatic sinusoid. CEA released by the tumor cell binds with hnRNP M (CEAR) on the Kupffer cell surface resulting in release of the cytokines interleukin (IL)-1, IL-6, IL-10 and TNF-α. Effect of CEA induced cytokines on tumor cell interactions in the hepatic sinusoid. Cytokines IL-1, IL-6, IL-10 and TNF-α produced by Kupffer cells have a number of effects on the tumor cell microenvironment. These include up-regulation of adhesion molecules on hepatic sinusoidal endothelial cells. The most important of these seem to be E-selectin and ICAM-1. Cytokines such as IL-6 and IL-8 are pro-angiogenesis and they may also effect growth at the distant site[14,42].
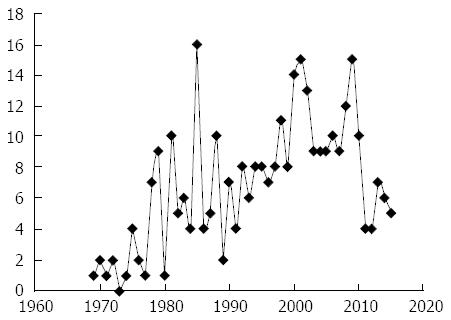
Figure 2 Graphic representation of published cotton top tamarin articles by year as estimated by a typical online search.
The line chart is not necessarily inclusive of all cotton top tamarin (CTT) articles but merely confined to the search terms used. It is therefore used mainly to demonstrate the overall trends in annual publications devoted to this animal “CTT supermodel”.
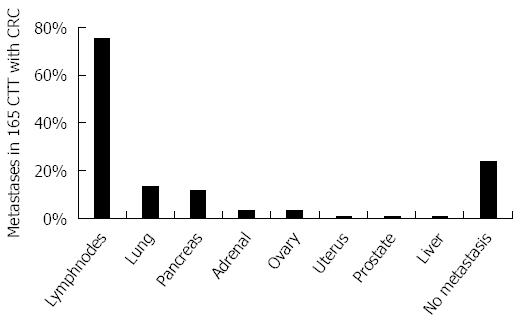
Figure 3 Schematic bar diagram depicting proportion of metastases in cotton top tamarin with colorectal cancer.
The bar diagram shows the distribution of metastasis based on the ORAU colony cancer statistics. The paucity of liver metastases is remarkable. CTT: Cotton top tamarin; CRC: Colorectal cancer.
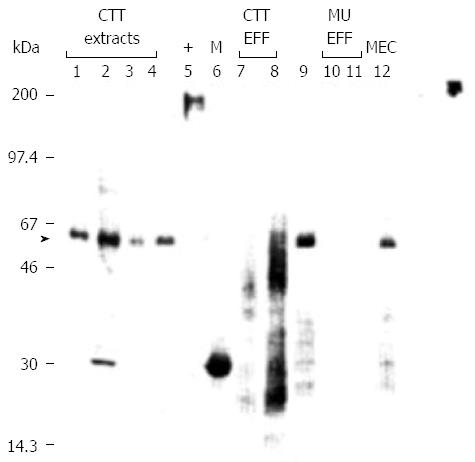
Figure 4 Specific carcinoembryonic antigen bands shared by cotton top tamarin and humans.
Western blot using solid phase anti-CEA monoclonal antibody. lmmunoblotting was performed using 5.6 pg protein/ml antibody after electrophoresis of a 12% SDS-polyacrylamide gel run under reducing conditions. Relative mobility (M) is shown on the left, and the type of samples loaded at 10 pg protein/lane are shown above the numbered lanes. Cotton-top tamarin extracts are in lanes 1 to 4 and effluent samples in 7 and 8. An extract from a patient with histologically proven rectal cancer and IBD is in lane 9, with human effluent samples in lanes I0 and 11 and human meconium in lane 12. Lane 5 contains the positive human CEA control, and the M, markers (M) are in lane 6. An arrow indicates the M, - 50000 band evident also in human extract (lane 5) likely a deglycosylated moiety. (Published with permission of Elsevier[67] and modified). CEA: Carcinoembryonic antigen.
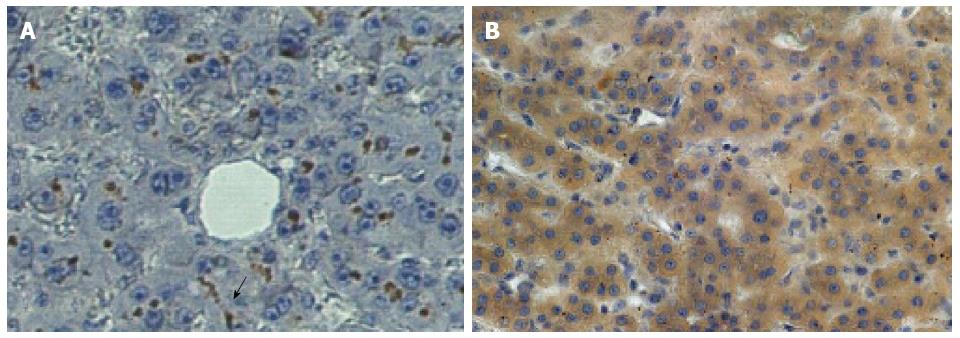
Figure 5 Distribution of CEACAM1 (BGP) in human liver.
Photomicrographs of CEACAM1 staining with monoclonal antibody 4D1/C2 showing very intense brown staining mainly in the distribution of the biliary canaliculus in normal human liver (A).In contrast, in the normal portion of a liver from a patient with hepatic metastasis (B), dark staining is seen in the cytoplasm of the hepatocytes with no canalicular staining evident. Published with permission of Springer[8]. The arrow points to the typical distribution of bound ant-BGP in the bile canaliculus in the normal liver (A) at center, bottom.
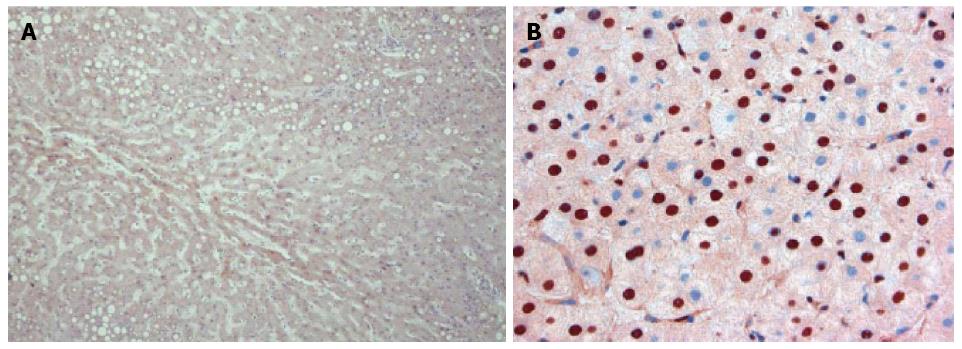
Figure 6 Distribution of carcinoembryonic antigen receptor in cotton top tamarin and human.
The distribution of CEAR in the CTT (A) at low power can be seen in the cytoplasm of the hepatocyte by the light brown stain. In humans (B) at a higher power the increased intensity of staining in hepatocyte nuclei can be clearly seen. Published with permission of Springer[8]. CEA: Carcinoembryonic antigen; CTT: Cotton top tamarin; CEAR: Carcinoembryonic antigen receptor.
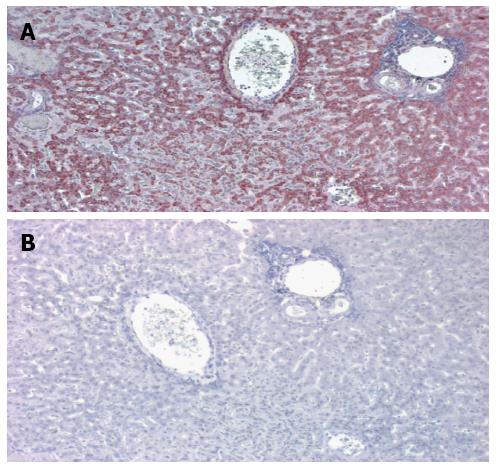
Figure 7 Immune labeling of CTT liver by anti fibulin-5 monoclonal antibody (A) and corresponding negative control (B).
A: A central vein is seen in the upper center and a portal triad to the right. The dark red staining denotes the distribution of the antibody which is particularly intense surround the central vein. This is a low power magnification; B: In the negative control no staining is evident.
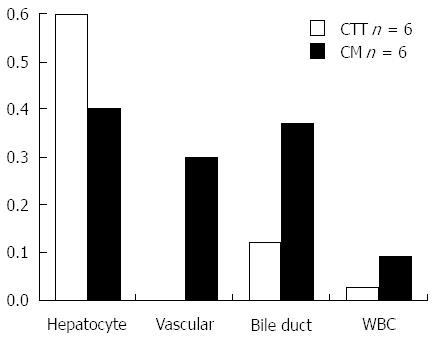
Figure 8 Summary of fibulin-5 immune labeling in cotton top tamarin, common marmoset and humans.
Intensity of labeling: CTT and CM of Hepatocyte, Bile Ducts, Vascular Cells and White Blood Cells with Anti-fibulin-5. CTT: Cotton top tamarin; CM: Common marmoset.
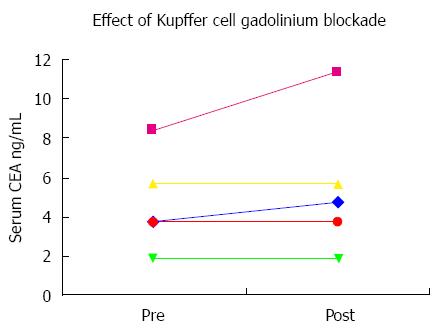
Figure 9 Carcinoembryonic antigen concentrations before and after gadolinium injection for magnetic resonance imaging.
Five human patients had serial CEA levels measured before and after MRI with gadolinium contrast administration. No significant changes are seen after gadolinium for patients with normal or near-normal baseline levels. However the patient with a baseline CEA elevation showed a sizeable increase in the CEA level designated by the pink line. CEA: Carcinoembryonic antigen.
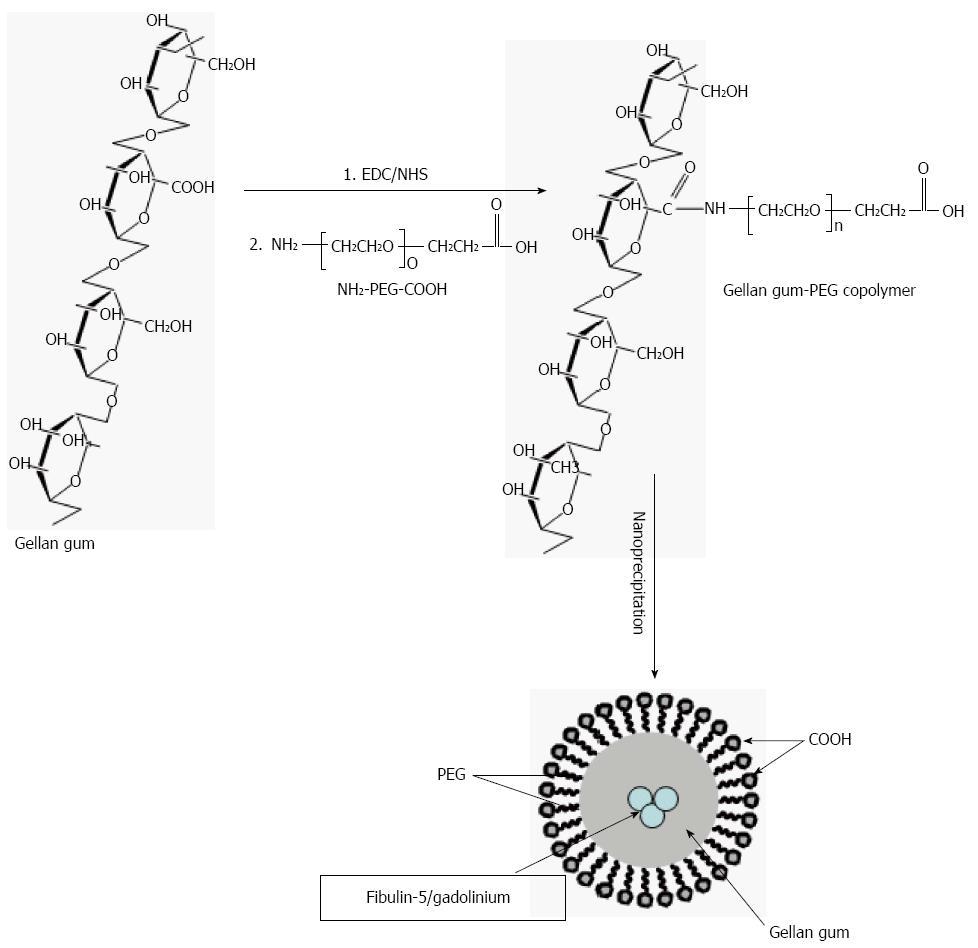
Figure 10 Schematic representation of the technique used for the synthesis of gadolinium encapsulated Gellan-gum-block-Polyethylene glycol co-polymeric nanoparticles.
The above figure is a representation of the technical steps to generate nanoparticles of gadolinium encapsulated by Gellan-gum-block-Polyethylene glycol copolymeric micelle nanoparticles. This should ensure delivery and advantageous dwell time in order to block Kupffer functions of uptake of CEA and reduce the pro-metastogenic role of these cells. CEA: Carcinoembryonic antigen.
- Citation: Tobi M, Thomas P, Ezekwudo D. Avoiding hepatic metastasis naturally: Lessons from the cotton top tamarin (Saguinus oedipus). World J Gastroenterol 2016; 22(24): 5479-5494
- URL: https://www.wjgnet.com/1007-9327/full/v22/i24/5479.htm
- DOI: https://dx.doi.org/10.3748/wjg.v22.i24.5479


