Copyright
©The Author(s) 2016.
World J Gastroenterol. Jun 7, 2016; 22(21): 5079-5087
Published online Jun 7, 2016. doi: 10.3748/wjg.v22.i21.5079
Published online Jun 7, 2016. doi: 10.3748/wjg.v22.i21.5079
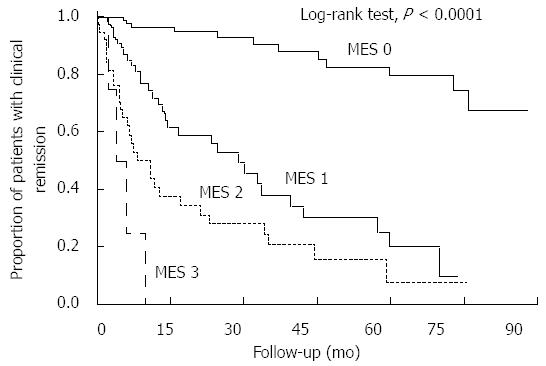
Figure 1 Kaplan-Meier curves depicting the rates of clinical remission maintenance with regard to the Mayo endoscopic subscores.
There were statistically significant differences in the cumulative remission maintenance rates between patients in each Mayo endoscopic subscore (MES) subgroup (P < 0.0001, log-rank test). The hazard ratio for risk of relapse of patients with an MES of 0 relative to those with an MESs of 1-3 was 0.10 (95%CI: 0.05-0.19).
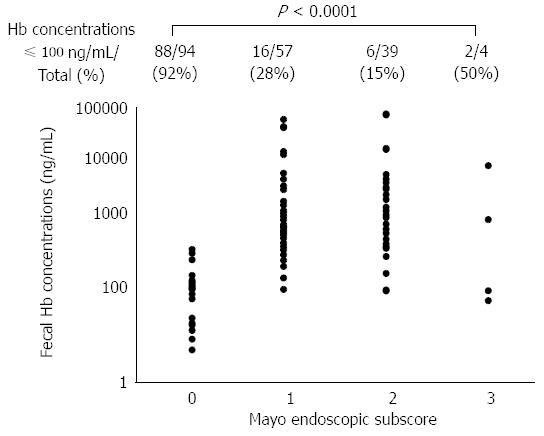
Figure 2 Correlation between fecal immunochemical test results and the Mayo endoscopic subscores.
There was a significant positive correlation between fecal hemoglobin concentrations and the MES (Spearman rank correlation coefficient = 0.6530, P < 0.0001). The proportion of cases with negative FIT results (fecal hemoglobin concentration ≤ 100 ng/mL) was greatest in cases with an MES of 0 (88/94, 92%). The proportion decreased gradually as the MES increased (MES 1: 16/57, 28%, MES 2: 6/39, 15%), and the trend of the decrease in relation to the MES was statistically significant (P < 0.0001, Cochran-Armitage trend test).
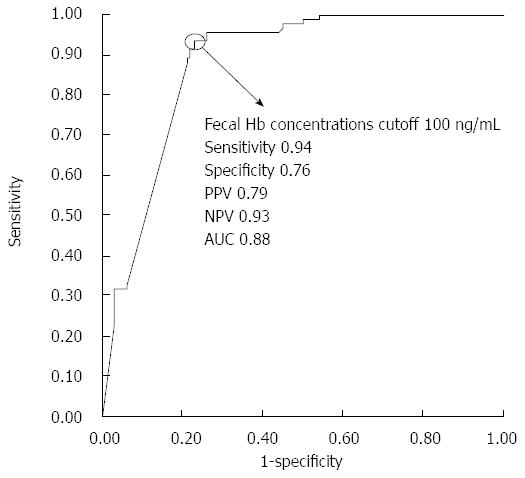
Figure 3 Receiver operating characteristic curve of fecal hemoglobin concentrations for predicting complete mucosal healing.
A cutoff value of 100 ng/mL differentiated between patients with or without complete mucosal healing with the following values: 0.94 sensitivity, 0.76 specificity, 0.79 PPV, 0.93 NPV, and 0.88 accuracy. The corresponding area under the curve was 0.88.
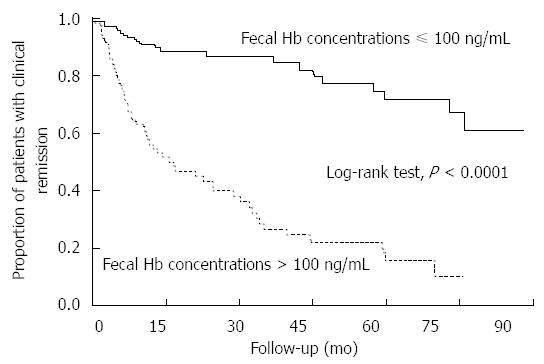
Figure 4 Kaplan-Meier curves depicting maintenance of clinical remission with regard to fecal immunochemical test results.
There was a statistically significant difference in cumulative remission maintenance rates between the patients with a negative FIT result and those with a positive FIT result (P < 0.0001, log-rank test). The hazard ratio relating the relapse risk in patients with a negative FIT to those with a positive FIT was 0.17 (95%CI: 0.10-0.28).
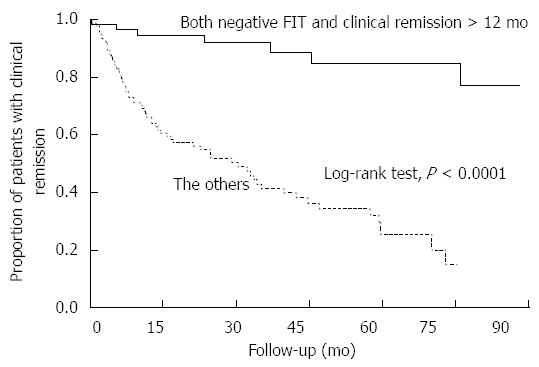
Figure 5 Kaplan-Meier curves depicting the maintenance of clinical remission in patients with both a negative fecal immunochemical test and clinical remission > 12 mo relative to all other patients.
There was a statistically significant difference in the cumulative remission maintenance rates between patients with both a negative FIT and clinical remission > 12 mo (n = 66) and all other patients (n = 128) (P < 0.0001, log-rank test). The hazard ratio relating relapse risk in patients with both a negative FIT and clinical remission > 12 mo to relapse risk in all other patients was 0.11 (95%CI: 0.04-0.23).
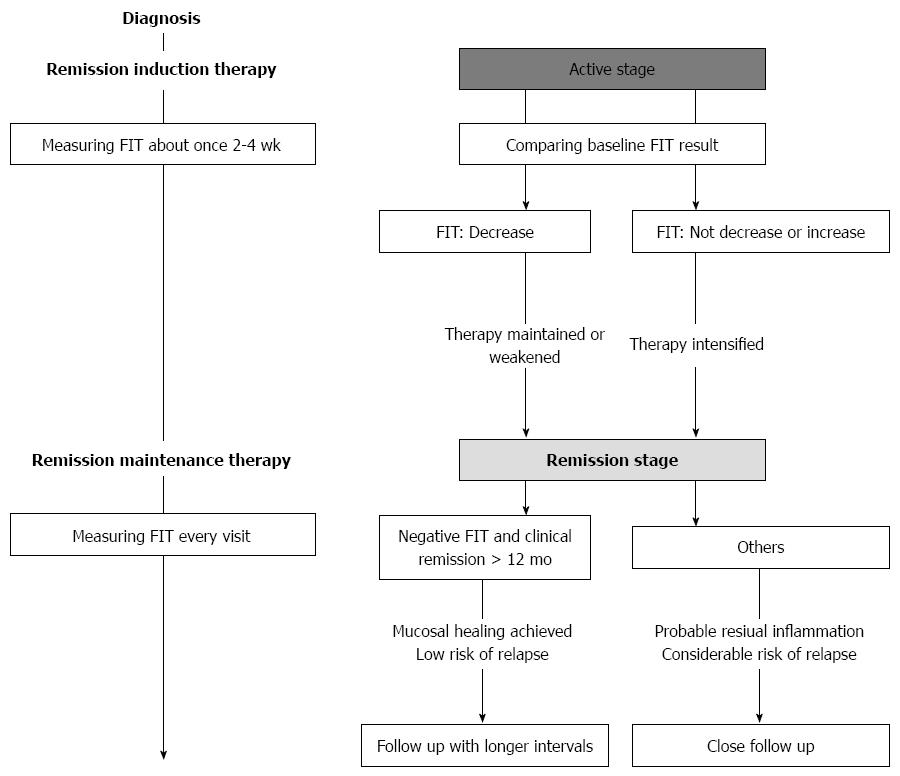
Figure 6 Proposed workflow of the follow-up of Ulcerative colitis patients using fecal immunochemical test.
FIT: Fecal immunochemical test.
- Citation: Nakarai A, Kato J, Hiraoka S, Takashima S, Takei D, Inokuchi T, Sugihara Y, Takahara M, Harada K, Okada H. Ulcerative colitis patients in clinical remission demonstrate correlations between fecal immunochemical test results, mucosal healing, and risk of relapse. World J Gastroenterol 2016; 22(21): 5079-5087
- URL: https://www.wjgnet.com/1007-9327/full/v22/i21/5079.htm
- DOI: https://dx.doi.org/10.3748/wjg.v22.i21.5079


