Copyright
©The Author(s) 2015.
World J Gastroenterol. May 21, 2015; 21(19): 5884-5892
Published online May 21, 2015. doi: 10.3748/wjg.v21.i19.5884
Published online May 21, 2015. doi: 10.3748/wjg.v21.i19.5884
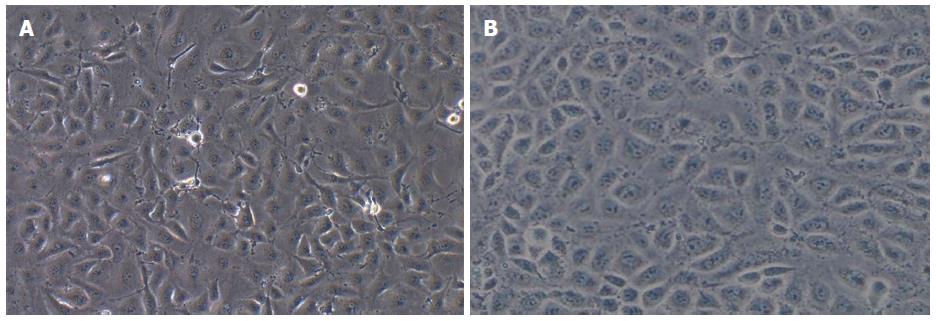
Figure 1 Comparison of the morphology of tumor endothelial cells and hepatic sinusoidal endothelial cells.
A: The morphology of tumor endothelial cells (magnification × 100); B: The morphology of hepatic sinusoidal endothelial cells (magnification × 100).
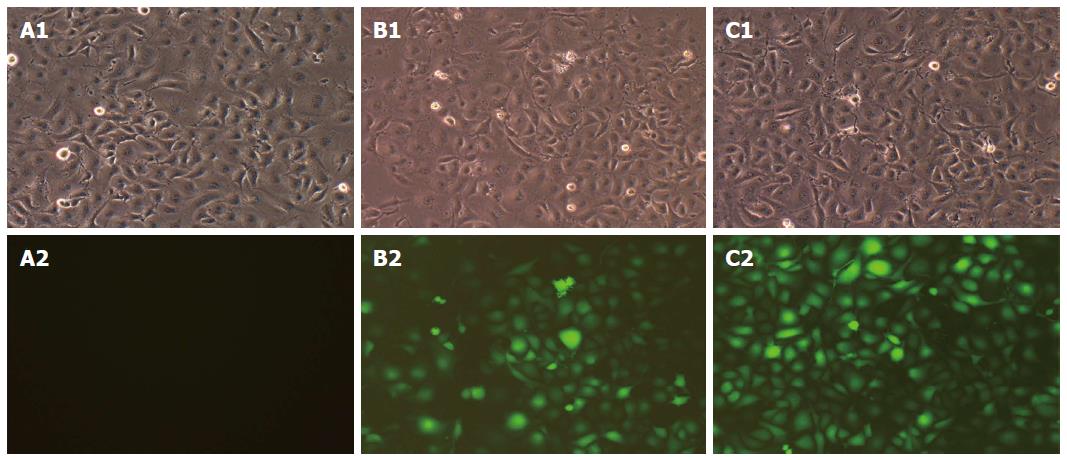
Figure 2 Determination of lentivirus titers after infection of tumor endothelial cells.
The morphology of cells in the three groups under bright field and green fluorescence field (A1: CON 100 × B; B1: NC 100 × B; C1: MD 100 × B; A2: CON 100 × G; B2: NC 100 × G; C2: MD 100 × G). B and G indicate the bright field and the green fluorescence field, respectively. MD: Micro-down; NC: Negative control; CON: Control.
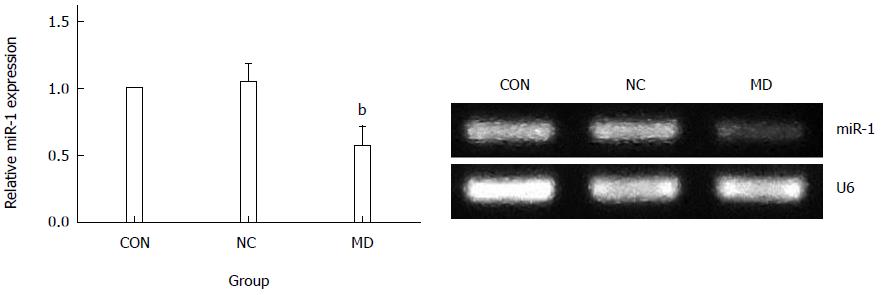
Figure 3 MiR-1 expression in cells of the three groups.
The expression of miR-1 was significantly decreased in the MD group compared with the NC and CON groups (P < 0.01). There was no significant difference between the NC group and CON group (P > 0.05). bP < 0.01 vs CON and NC group. MD: Micro-down; NC: Negative control; CON: Control.
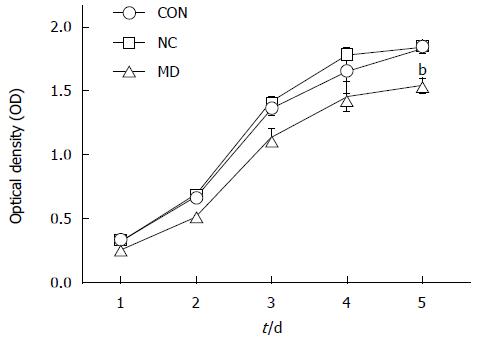
Figure 4 Detection of tumor endothelial cell proliferation by MTT assay.
Cell proliferation was significantly inhibited in the MD group compared with the CON and NC groups (P < 0.01), while there was no significant difference between the CON and NC groups (P > 0.05). bP < 0.01 vs CON and NC groups.
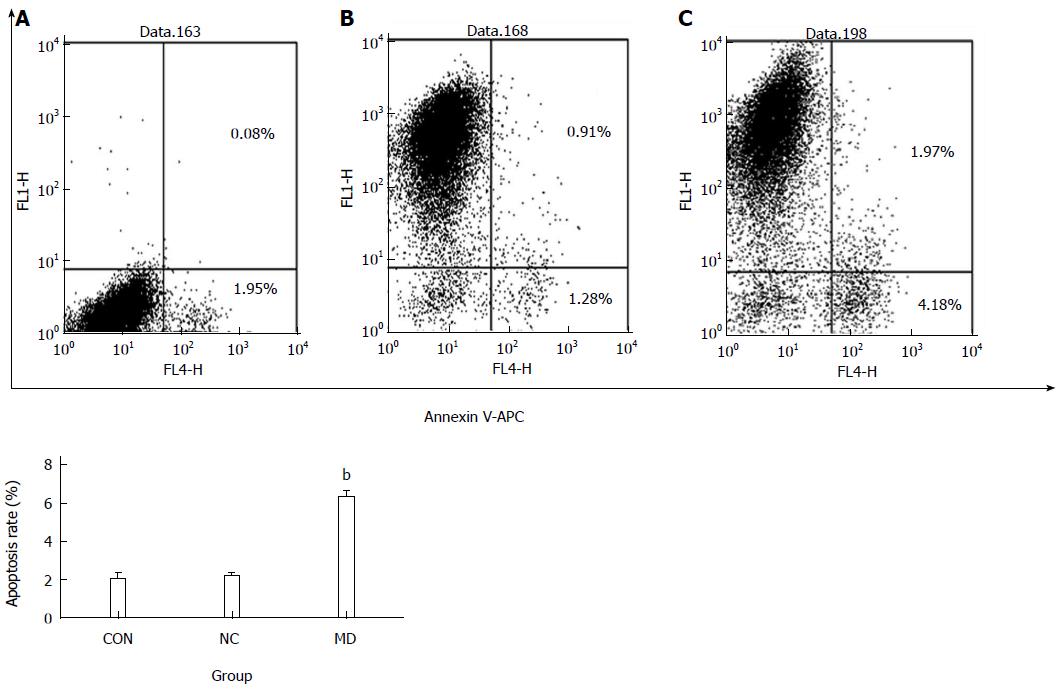
Figure 5 Flow cytometric detection of apoptosis in each group after transduction.
A: Flow cytometry results of the CON group; B: Flow cytometry results of the NC group; C: Flow cytometry results of the MD group. Cells staining positive for Annexin V-APC were considered apoptotic (the right upper quadrant and right lower quadrant). bP < 0.01 vs CON and NC groups. MD: Micro-down; NC: Negative control; CON: Control.
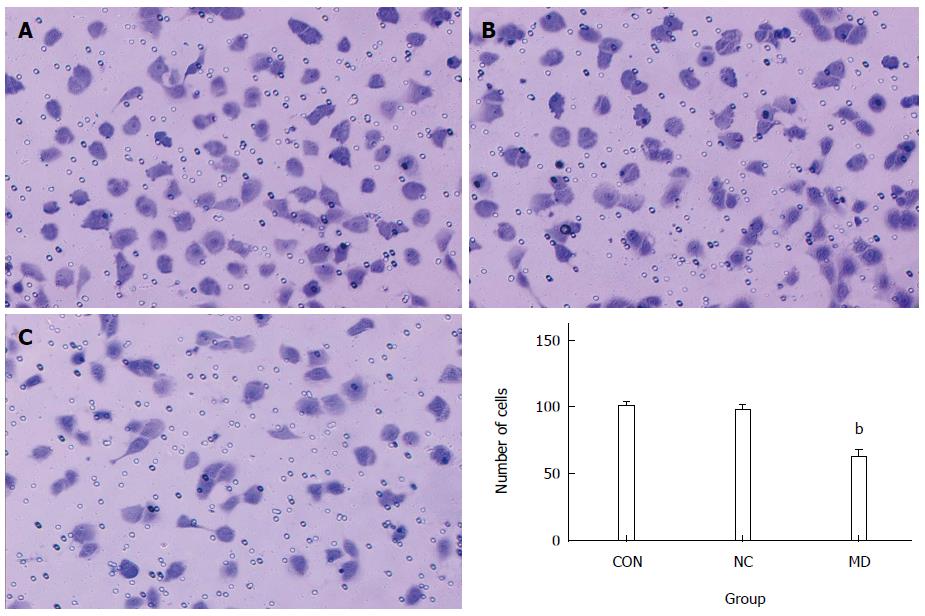
Figure 6 Transwell migration assay.
The number of cells migrated to the lower portion of the chamber was significantly decreased in the MD group compared with the CON and NC groups (P < 0.01). There was no significant difference between the CON and NC groups (P > 0.05). bP < 0.01 vs CON and NC groups. A: CON group; B: NC group; C: MD group. MD: Micro-down; NC: Negative control; CON: Control.
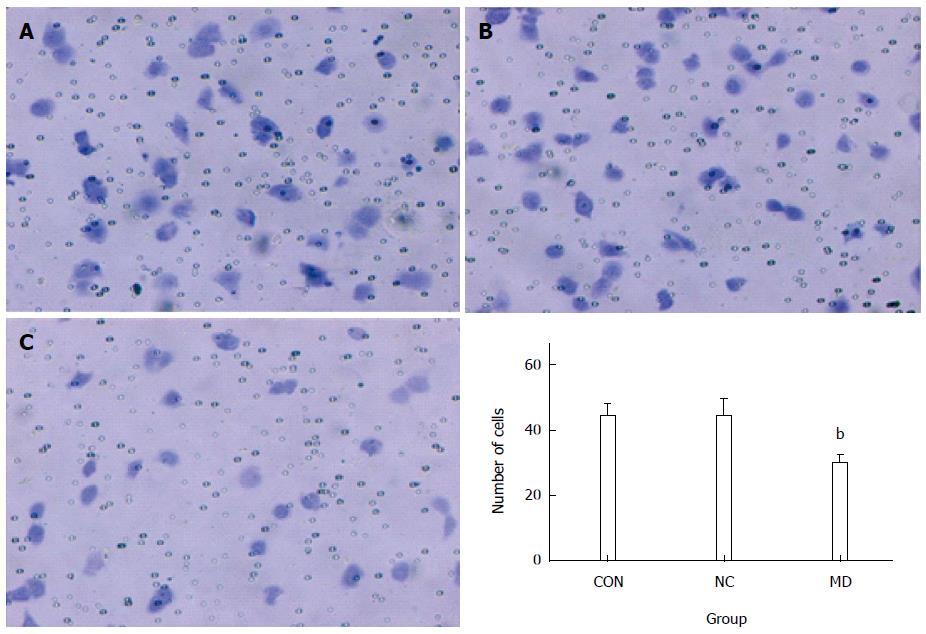
Figure 7 Transwell invasion assay.
The number of cells invading to the lower portion of the chamber was significantly decreased in the MD group compared with the CON and NC groups (P < 0.01). There was no significant difference between the CON and NC groups (P > 0.05), bP < 0.01 vs CON and NC groups. A: CON group; B: NC group; C: MD group. MD: Micro-down; NC: Negative control; CON: Control.
- Citation: Hu C, Shen SQ, Cui ZH, Chen ZB, Li W. Effect of microRNA-1 on hepatocellular carcinoma tumor endothelial cells. World J Gastroenterol 2015; 21(19): 5884-5892
- URL: https://www.wjgnet.com/1007-9327/full/v21/i19/5884.htm
- DOI: https://dx.doi.org/10.3748/wjg.v21.i19.5884


