Copyright
©The Author(s) 2015.
World J Gastroenterol. May 14, 2015; 21(18): 5454-5464
Published online May 14, 2015. doi: 10.3748/wjg.v21.i18.5454
Published online May 14, 2015. doi: 10.3748/wjg.v21.i18.5454
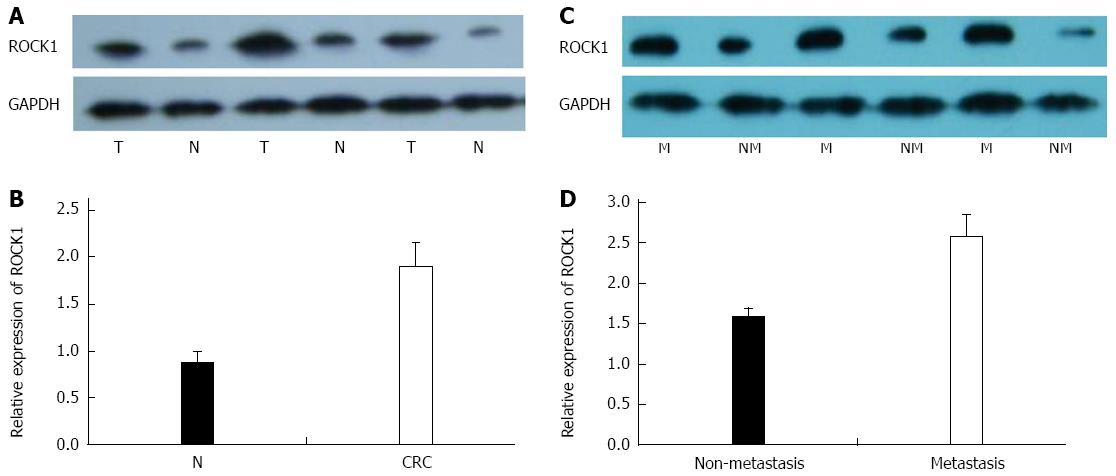
Figure 1 Expression of rho-associated protein kinase 1 protein in 68 colorectal cancer and noncancerous tissue specimens.
A: Representative Western blot of rho-associated protein kinase (ROCK)1 expression in colorectal cancer (CRC) (T) and normal (N) tissues; B: Densitometry analysis of ROCK1 expression in N and CRC tissues relative to GAPDH; C: Representative Western blot ROCK1 expression in metastatic (M) and non-metastatic (NM) CRC specimens; D: Densitometry analysis of ROCK1 expression in metastatic and non-metastatic CRC tissues relative to GAPDH. All experiments were repeated three times.
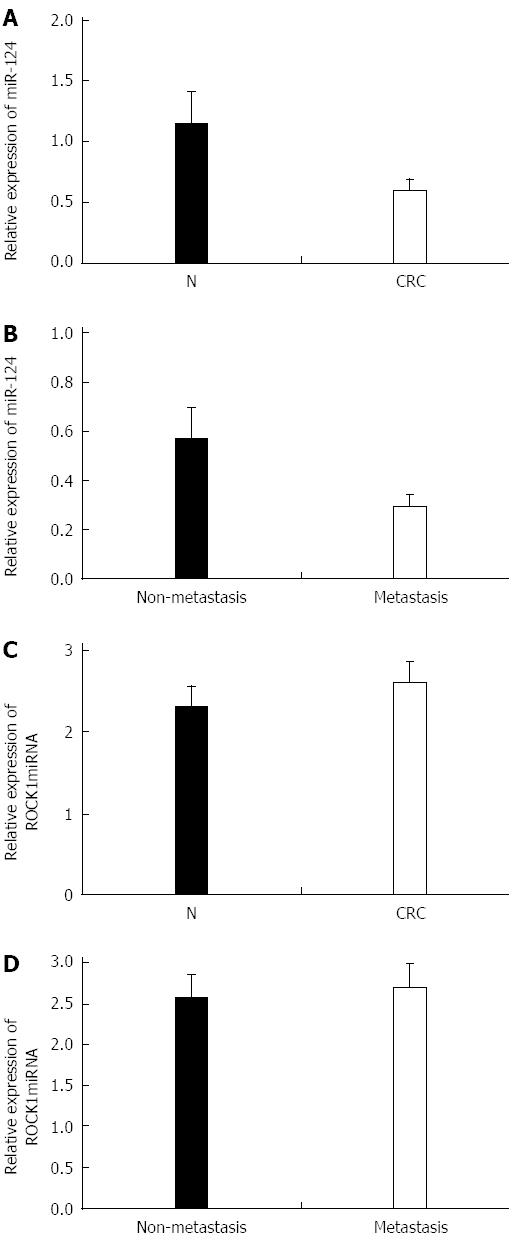
Figure 2 Expression of miR-124 and rho-associated protein kinase 1 mRNA in 68 colorectal cancer and noncancerous tissue specimens.
Quantitative real time-PCR data for miR-124 in A: Colorectal cancer (CRC) tissues relative to normal (N) tissues; and B: 30 metastatic and 38 non-metastatic CRC tissues; Quantitative real time-PCR data for rho-associated protein kinase 1 (ROCK1) in C: CRC and N tissues; and D: Metastatic and non-metastatic CRC tissues. All experiments were repeated three times.
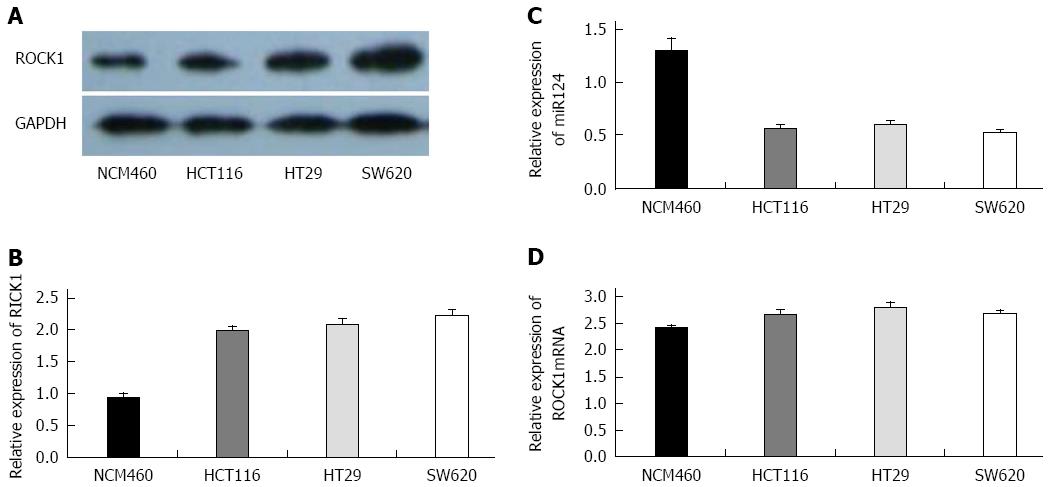
Figure 3 Expression of miR-124 and rho-associated protein kinase 1 in colorectal cancer cell lines.
A: Representative Western blot of rho-associated protein kinase 1 (ROCK1) expression in the human colonic mucosa epithelial cell line (NCM460) and colorectal cancer (CRC) cell lines (HCT116, HT29 and SW620); B: Densitometry analysis of ROCK1 expression relative to GAPDH; Quantitative real time-PCR data for C: miR-124; and D: ROCK1 mRNA. All experiments were repeated three times.
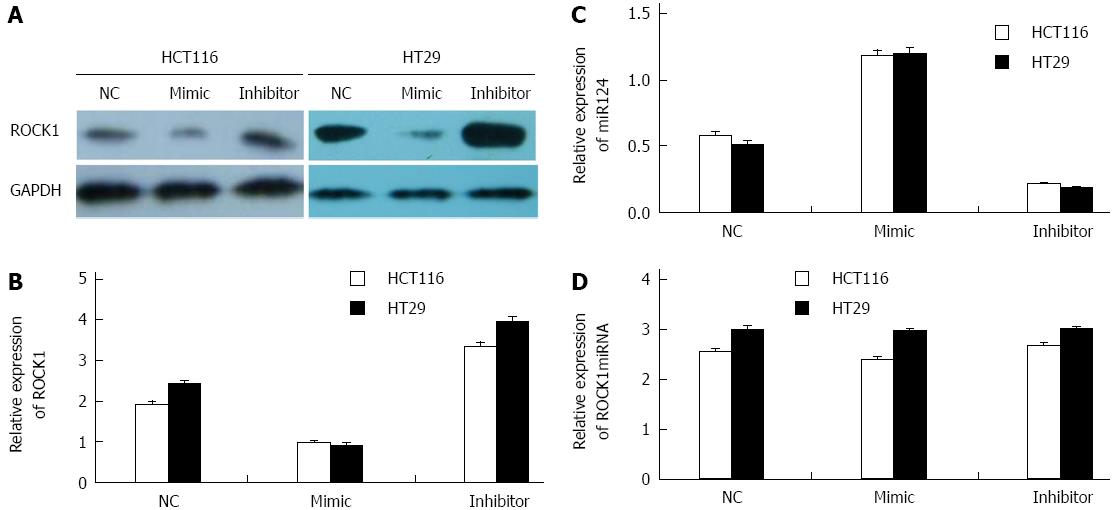
Figure 4 In vitro effects of miR-124 regulation.
A: Representative Western blot of rho-associated protein kinase 1 (ROCK1) expression in HCT116 and HT29 cells transfected with negative control (NC), miR-124 mimic and miR-124 inhibitor; B: Relative densitometry analysis of ROCK1 expression relative to GAPDH; Quantitative real time-PCR data for C: miR-124; and D: ROCK1 mRNA.
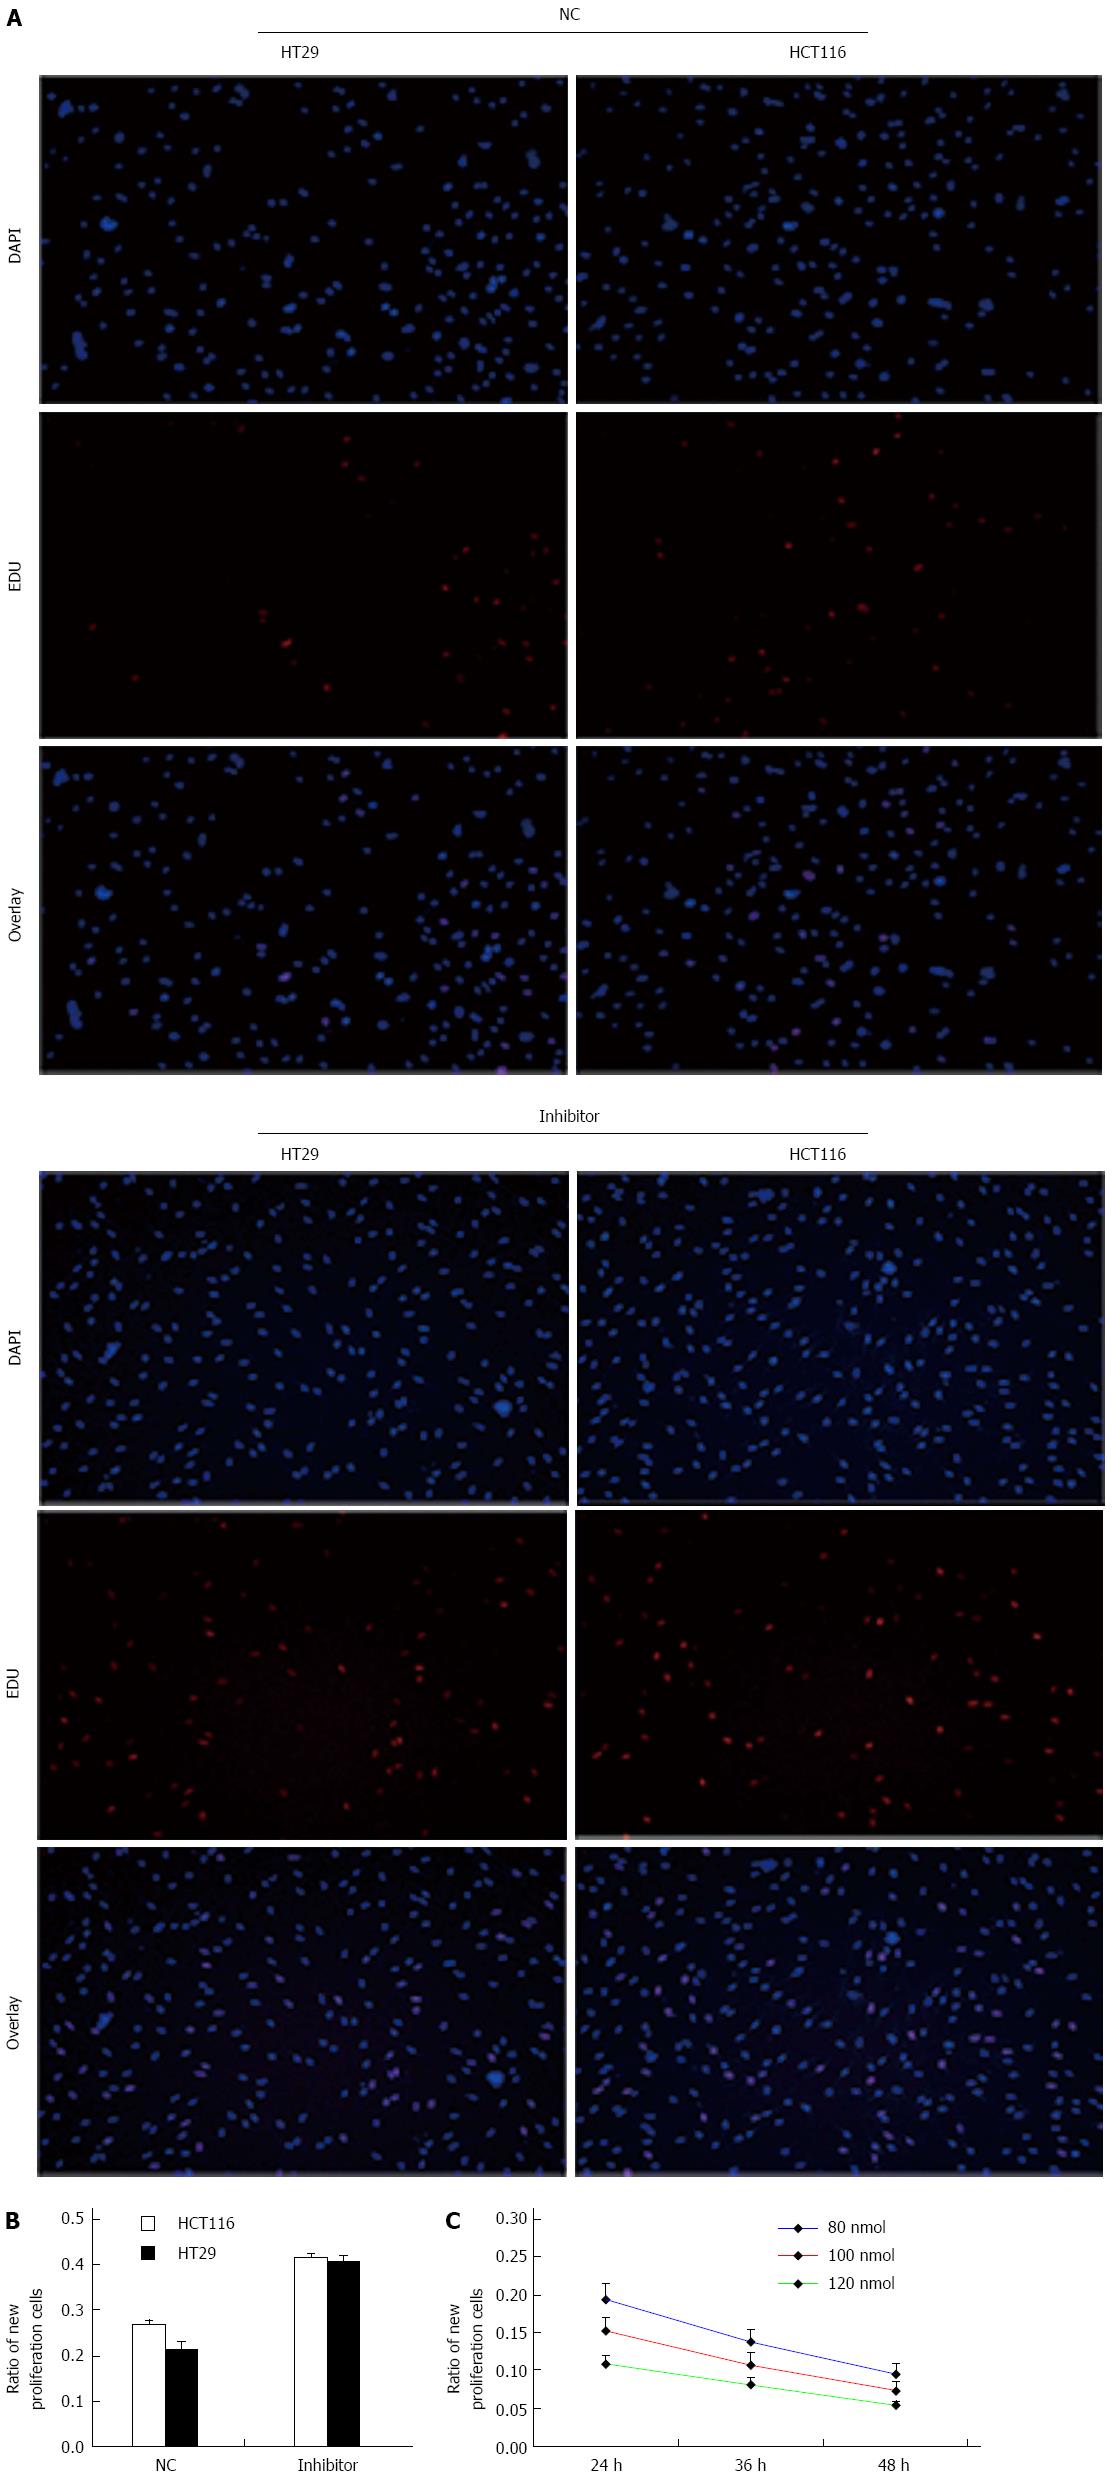
Figure 5 miR-124 knockdown promotes cell proliferation.
A: New generation of cells were detected by 5-ethynyl-2’ deoxyuridine (EDU; red), nuclei are stained blue (DAPI); B: Proliferative activity of HCT116 and HT29 cells transfected with negative control (NC) and the miR-124 inhibitor; C: Proliferative ability of HCT16 cells over time when transfected with various doses of miR-124 mimic. All experiments were repeated three times.
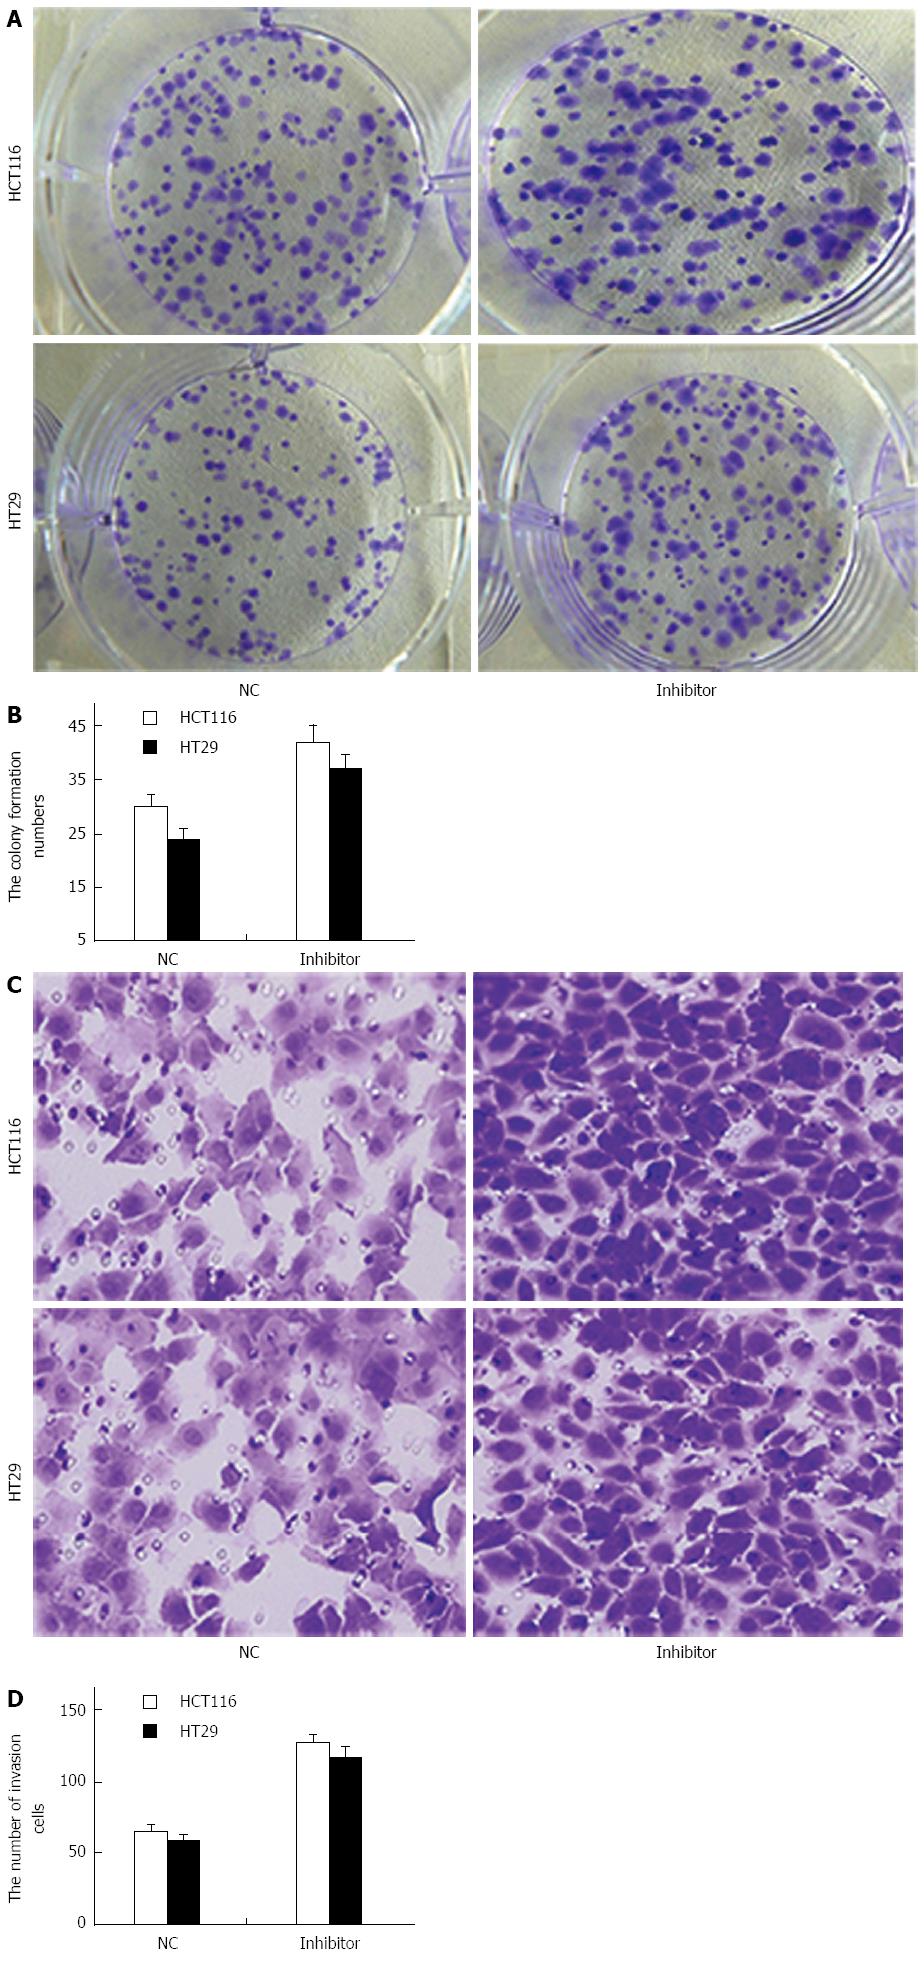
Figure 6 miR-124 inhibits growth and invasion of HCT116 and HT29 cells.
A: Colony-formation assay for HCT116 and HT29 cells transfected with negative control (NC) and miR-124 inhibitor was performed on day 14; B: Quantification of colony formation with miR-124 inhibitor; C: Cell migration and invasion assays were performed for HCT116 and HT29 cells transfected with NC and miR-124 inhibitor; D: Quantification of the number of invasive cells with NC and miR-124 inhibitor. All experiments were repeated three times.
- Citation: Xi ZW, Xin SY, Zhou LQ, Yuan HX, Wang Q, Chen KX. Downregulation of rho-associated protein kinase 1 by miR-124 in colorectal cancer. World J Gastroenterol 2015; 21(18): 5454-5464
- URL: https://www.wjgnet.com/1007-9327/full/v21/i18/5454.htm
- DOI: https://dx.doi.org/10.3748/wjg.v21.i18.5454


