Copyright
©2014 Baishideng Publishing Group Co.
World J Gastroenterol. Apr 28, 2014; 20(16): 4787-4796
Published online Apr 28, 2014. doi: 10.3748/wjg.v20.i16.4787
Published online Apr 28, 2014. doi: 10.3748/wjg.v20.i16.4787
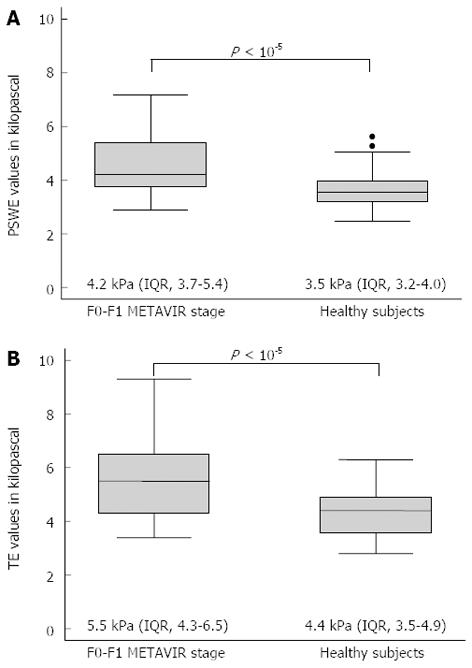
Figure 1 Box and whisker plots of stiffness values in patients at METAVIR stage F0-F1 and in healthy subjects.
Box plots show interquartile range (box), median (line within box), range (whisker) and outliers (circle). Median values (IQR) and P values of differences are given. A: Point shear wave elastography (PSWE) values; B: Transient elastography (TE) values.
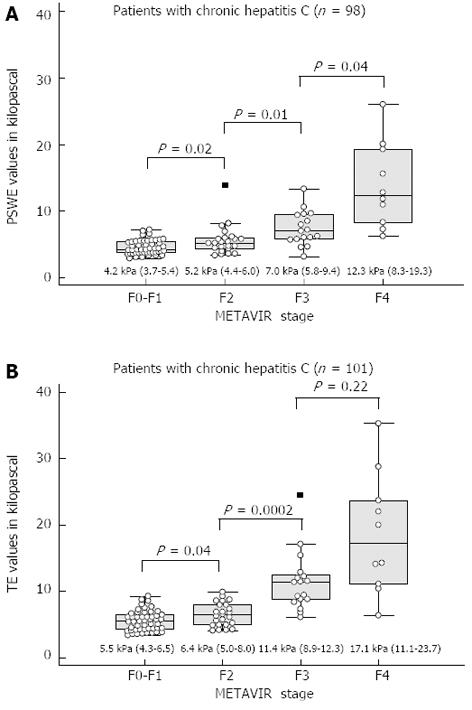
Figure 2 Distribution of stiffness values according to METAVIR fibrosis stage.
Median values, interquartile ranges, ranges, numbers of outliers and P values are given for each fibrosis stage. A: Point shear wave elastography (PSWE); B: Transient elastography (TE).
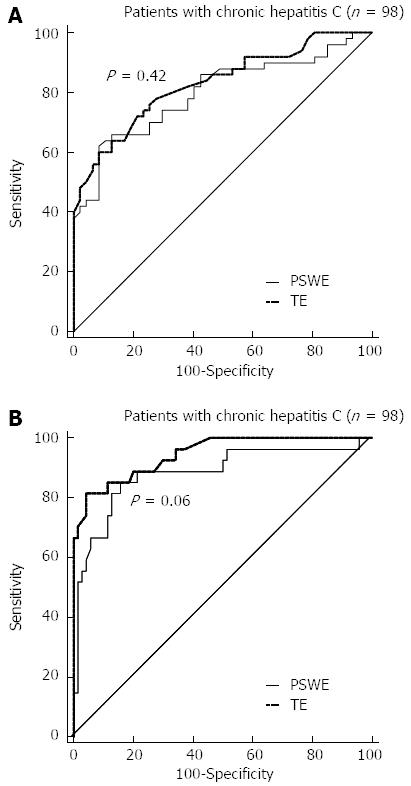
Figure 3 Receiver-operating characteristic curves for different fibrosis thresholds.
The performance of point shear wave elastography (PSWE) was compared to that of transient elastography (TE). P values for differences between areas under the curve are given. A: F0-F1 vs F2- F4 (F≥ 2); B: F0-F2 vs F3-F4 (F≥ 3); C: F0-F3 vs F4 (F = 4).
- Citation: Ferraioli G, Tinelli C, Lissandrin R, Zicchetti M, Bello BD, Filice G, Filice C. Point shear wave elastography method for assessing liver stiffness. World J Gastroenterol 2014; 20(16): 4787-4796
- URL: https://www.wjgnet.com/1007-9327/full/v20/i16/4787.htm
- DOI: https://dx.doi.org/10.3748/wjg.v20.i16.4787


