Copyright
©2014 Baishideng Publishing Group Co.
World J Gastroenterol. Apr 28, 2014; 20(16): 4778-4786
Published online Apr 28, 2014. doi: 10.3748/wjg.v20.i16.4778
Published online Apr 28, 2014. doi: 10.3748/wjg.v20.i16.4778
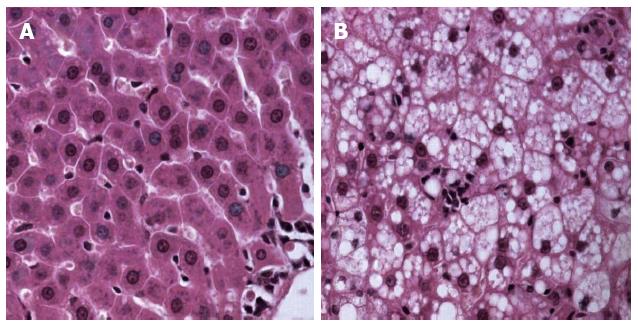
Figure 1 Pathology of nonalcoholic steatohepatitis and control group liver after hematoxylin and eosin staining.
A: Control group; B: Nonalcoholic steatohepatitis group.
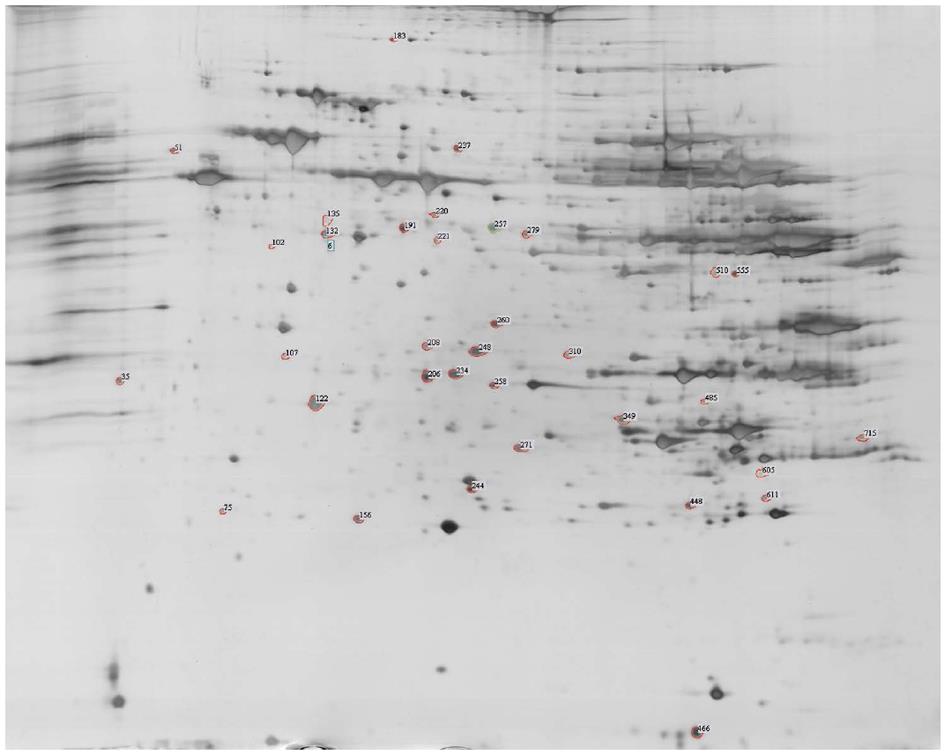
Figure 2 Representative two-dimensional electrophoresis image of proteins from the control and nonalcoholic steatohepatitis rat livers.
The numbered spots denote proteins that exhibited modified expression levels in nonalcoholic steatohepatitis (NASH) liver.
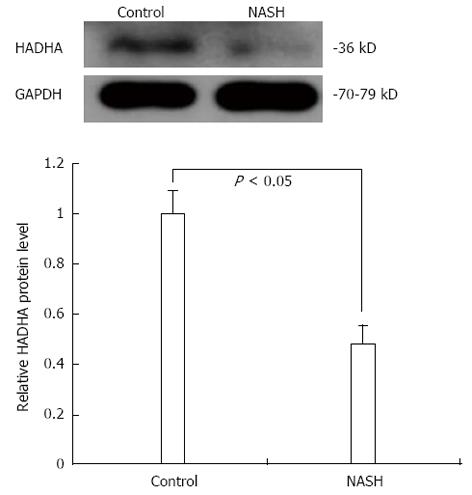
Figure 3 Significantly decreased hadha levels in nonalcoholic steatohepatitis rat mitochondria using Western blotting.
NASH: Nonalcoholic steatohepatitis.
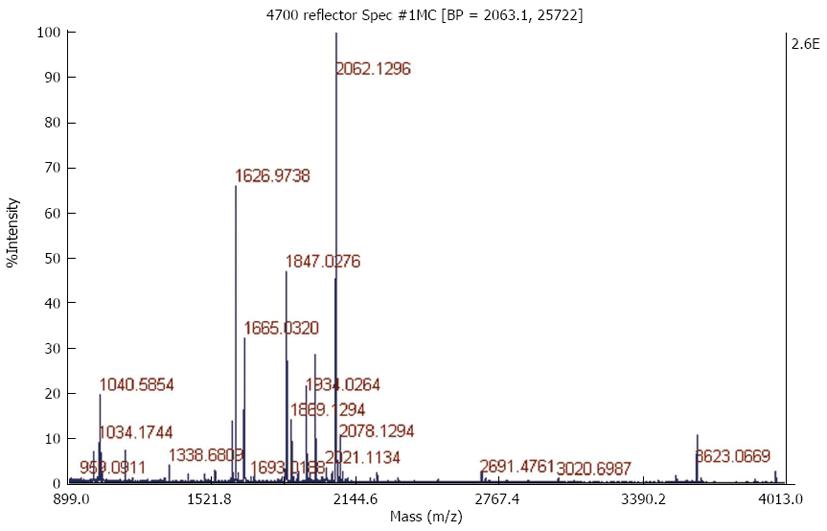
Figure 4 Peptide mass fingerprinting of an in-gel tryptic digest of the Hadha protein.
- Citation: Li L, Lu DZ, Li YM, Zhang XQ, Zhou XX, Jin X. Proteomic analysis of liver mitochondria from rats with nonalcoholic steatohepatitis. World J Gastroenterol 2014; 20(16): 4778-4786
- URL: https://www.wjgnet.com/1007-9327/full/v20/i16/4778.htm
- DOI: https://dx.doi.org/10.3748/wjg.v20.i16.4778


