Copyright
©2014 Baishideng Publishing Group Co.
World J Gastroenterol. Apr 28, 2014; 20(16): 4692-4701
Published online Apr 28, 2014. doi: 10.3748/wjg.v20.i16.4692
Published online Apr 28, 2014. doi: 10.3748/wjg.v20.i16.4692
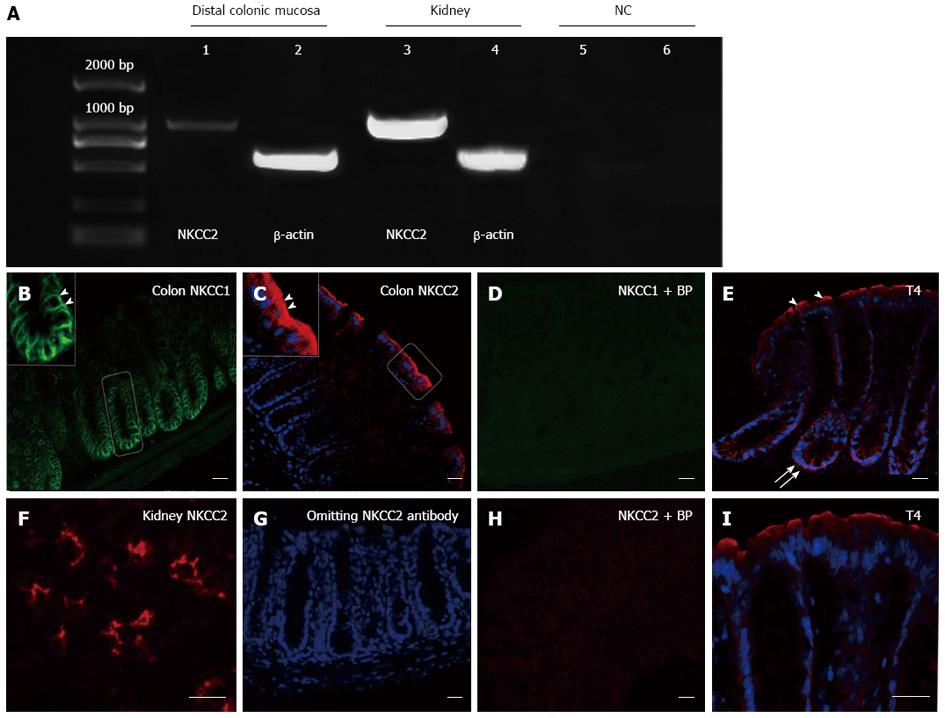
Figure 1 Expression and spatial distribution of Na+-K+-2Cl- cotransporter in the mouse colon and kidney.
RT-PCR identified mRNA transcripts for NKCC2 (1161 bp) in the mouse distal colon mucosa (lane 1) and kidney (lane 3) (A). In control experiments, no band was detected using non reverse transcribed RNA (lane 5) or by omitting cDNA (lane 6). The expression of β-actin is also shown as an internal control (lanes 2 and 4). Localization of the NKCC1 protein in the basolateral membrane along lower crypt epithelium (B) (arrowhead, the left inset is enlarged image of white rectangle) and NKCC2 in the apical membrane along the surface epithelium (C) (arrowhead, the left inset is enlarged image of white rectangle n = 3 mice) were clearly observed. Preadsorption of NKCC1 and NKCC2 antibodies with their corresponding blocking peptides (+ BP) resulted in no immunoreactivity (D, H). NKCC2 expression in the apical membrane of TAL cells in the kidney served as a positive control (F). Primary NKCC2 antibody was omitted also as a negative control (G). NKCC labeling with T4 antibody at the surface and crypt of the colonic epithelium (arrowhead: apical arrow: basolateral) (E) Higher magnification of surface epithelium (I). Scale bar = 20 μm; NC: Negative control; NKCC2: Na+-K+-2Cl- cotransporter.
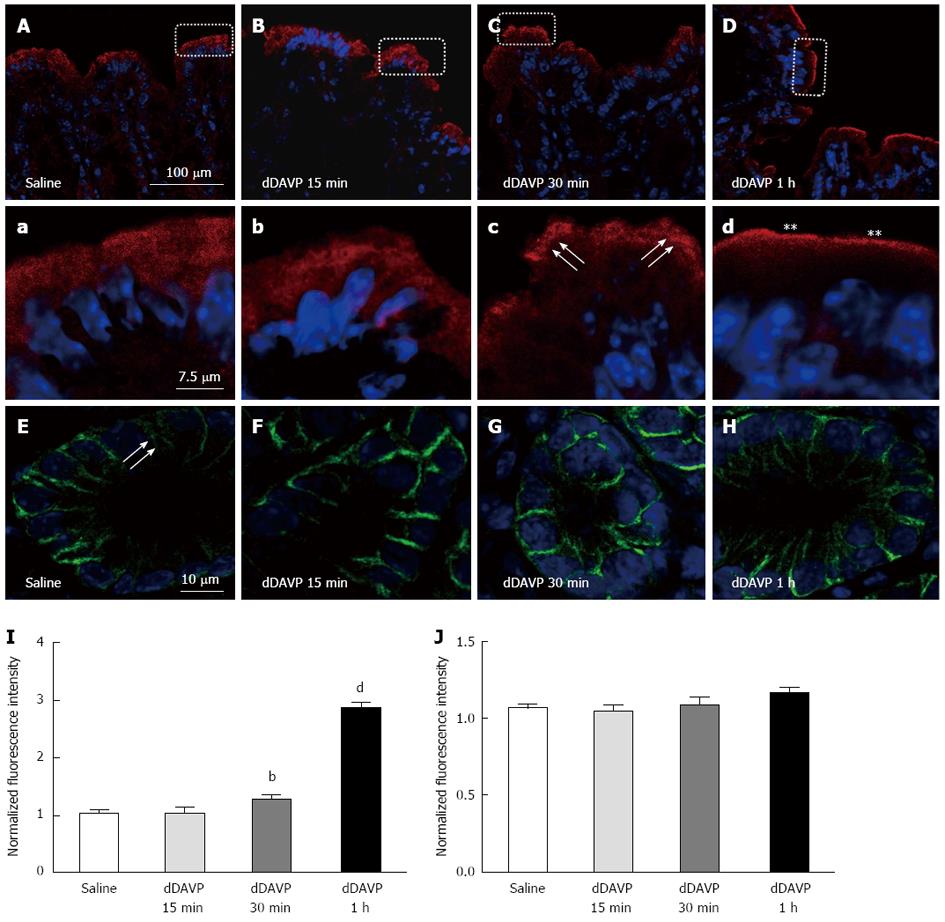
Figure 2 Effect of vasopressin on the cellular and subcellular location of Na+-K+-2Cl-1 cotransporter and Na+-K+-2Cl- cotransporter 2.
Vasopressin-induced redistribution of Na+-K+-2Cl- cotransporter (NKCC2) in the mouse distal colon (A-C). Mice were treated with saline (A) or dDAVP (10 ng) (B: 15 min; C: 30 min; D: 1h), and NKCC2 and NKCC1 immunolabeling was performed. A-D: Lower magnification images. Higher magnification images of the white rectangles in the corresponding A-D images. The arrow and asterisk indicate increased apical NKCC2; arrowheads indicate NKCC2 localization. Most of the NKCC2 labeling appears to be intracellular in the control mice. NKCC2 recruitment to the apical membranes of enterocytes at 30 min and 1 h post-stimulation is shown (C and D arrow and asterisk). However, vasopressin seemed to have no obvious effects on the redistribution of NKCC1 (I, J). Apical membrane NKCC2 and basolateral NKCC1 fluorescence intensity in saline- or dDAVP-treated distal surface epithelia was normalized to the apical or basolateral membrane in the saline-treated mouse. A significant difference in NKCC2 and NKCC1 intensity was observed at 15 min, 30 min and 1 h compared with that in the unstimulated state (E-H). N = 3 mouse, n = 6 images, n’ = 4-12 selected area; bP < 0.01; dP < 0.01.
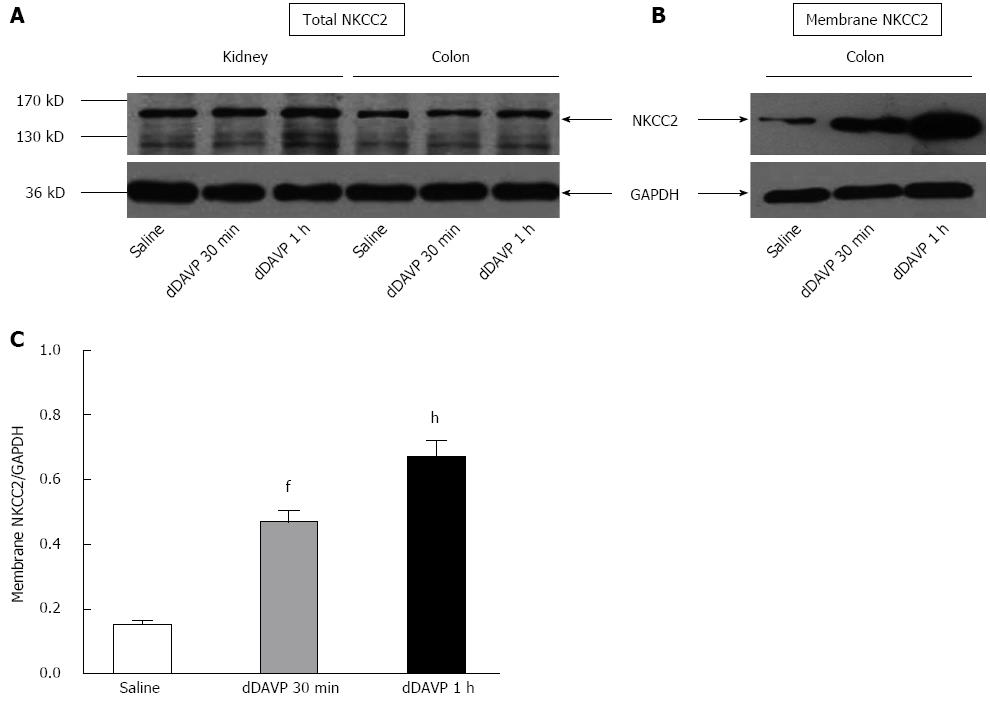
Figure 3 Western blotting analysis of total and plasma membrane Na+-K+-2Cl- cotransporter protein after saline or 1-D-Amino(8-D-arginine)-vasopressin injection.
A: Each lane was loaded with 20 μg of protein from the mouse distal colon and kidney homogenates (control and dDAVP-treated n = 3 mice); B: Each lane was loaded with 40 μg of protein from the plasma membrane of the colonic mucosa (n = 4 mice); C: Summary of the densitometric analysis of the membrane NKCC2, normalized to GAPDH. Densitometric analysis revealed that the expression of NKCC2 was significantly higher in the treated mice than in the control mice (fP < 0.01; hP < 0.01, n = 3).
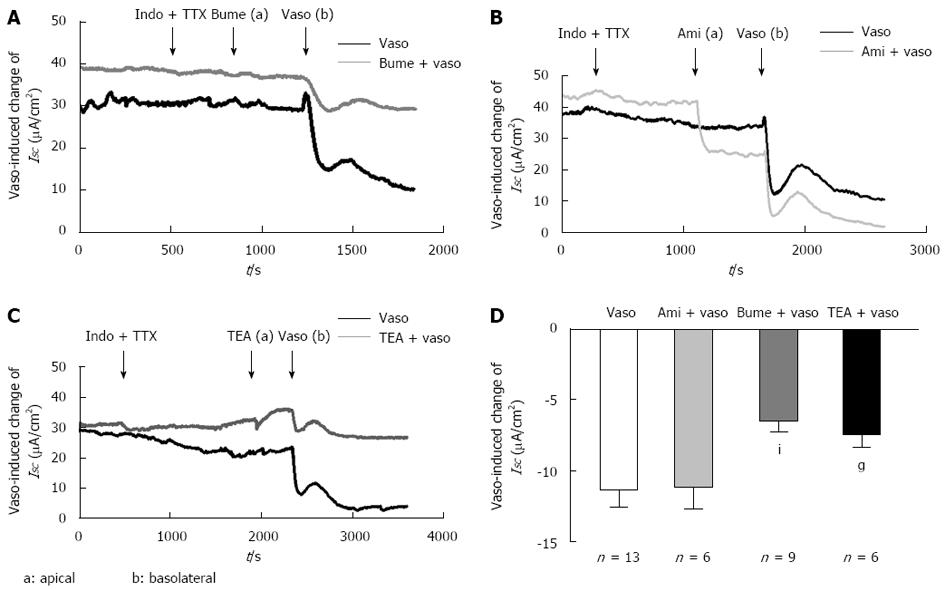
Figure 4 Apical Na+-K+-2Cl- cotransporter involvement in the serosal vasopressin-induced ISC response.
A: Representative ISC recordings in response to indomethacin (10 μmol, basolateral), TTX (tetrodotoxin, 1 μmol/L, basolateral), bumetanide (10 μmol/L, apical), and vasopressin (5 × 10⁻⁸ mol/L, basolateral); B: Representative ISC recordings in response to indomethacin (10 μmol/L, basolateral), TTX (tetrodotoxin, 1 μmol/L basolateral), amiloride (10 μmol/L, apical), and vasopressin (5 × 10⁻⁸ mol/L, basolateral). Arrows indicate the time of drug addiction; C: Representative ISC recordings in response to indomethacin (10 μmol/L, basolateral), TTX (tetrodotoxin, 1 μmol/L, basolateral), TEA (5 mmol/L, apical), and vasopressin (5 × 10⁻⁸ mol/L, basolateral); D: Comparison of the effects of serosal vasopressin on the ISC with or without apical pretreatment with bumetanide (n = 9), amiloride (n = 6) and TEA (n = 6). Values are mean ± SE; iP < 0.05; gP < 0.01.
- Citation: Xue H, Zhang ZJ, Li XS, Sun HM, Kang Q, Wu B, Wang YX, Zou WJ, Zhou DS. Localization and vasopressin regulation of the Na+-K+-2Cl- cotransporter in the distal colonic epithelium. World J Gastroenterol 2014; 20(16): 4692-4701
- URL: https://www.wjgnet.com/1007-9327/full/v20/i16/4692.htm
- DOI: https://dx.doi.org/10.3748/wjg.v20.i16.4692


