Copyright
©2013 Baishideng Publishing Group Co.
World J Gastroenterol. Jul 28, 2013; 19(28): 4607-4615
Published online Jul 28, 2013. doi: 10.3748/wjg.v19.i28.4607
Published online Jul 28, 2013. doi: 10.3748/wjg.v19.i28.4607
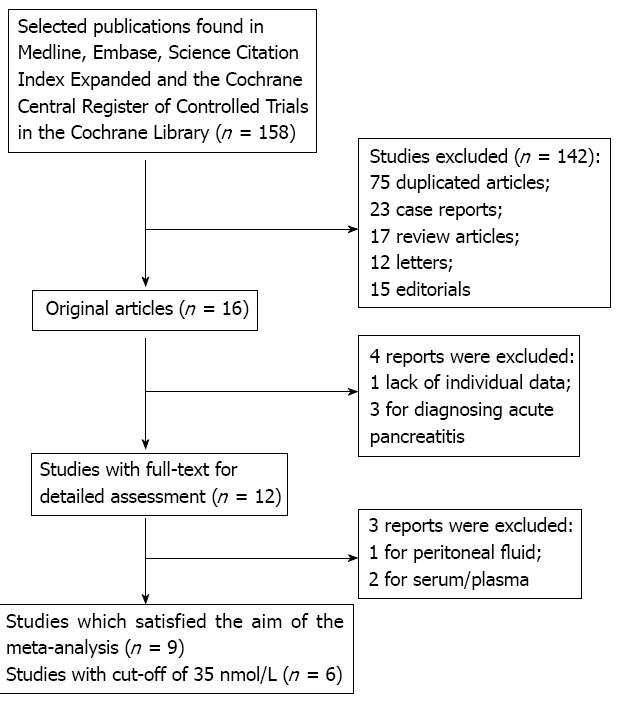
Figure 1 Flow diagram illustrating the process of identification of relevant studies.
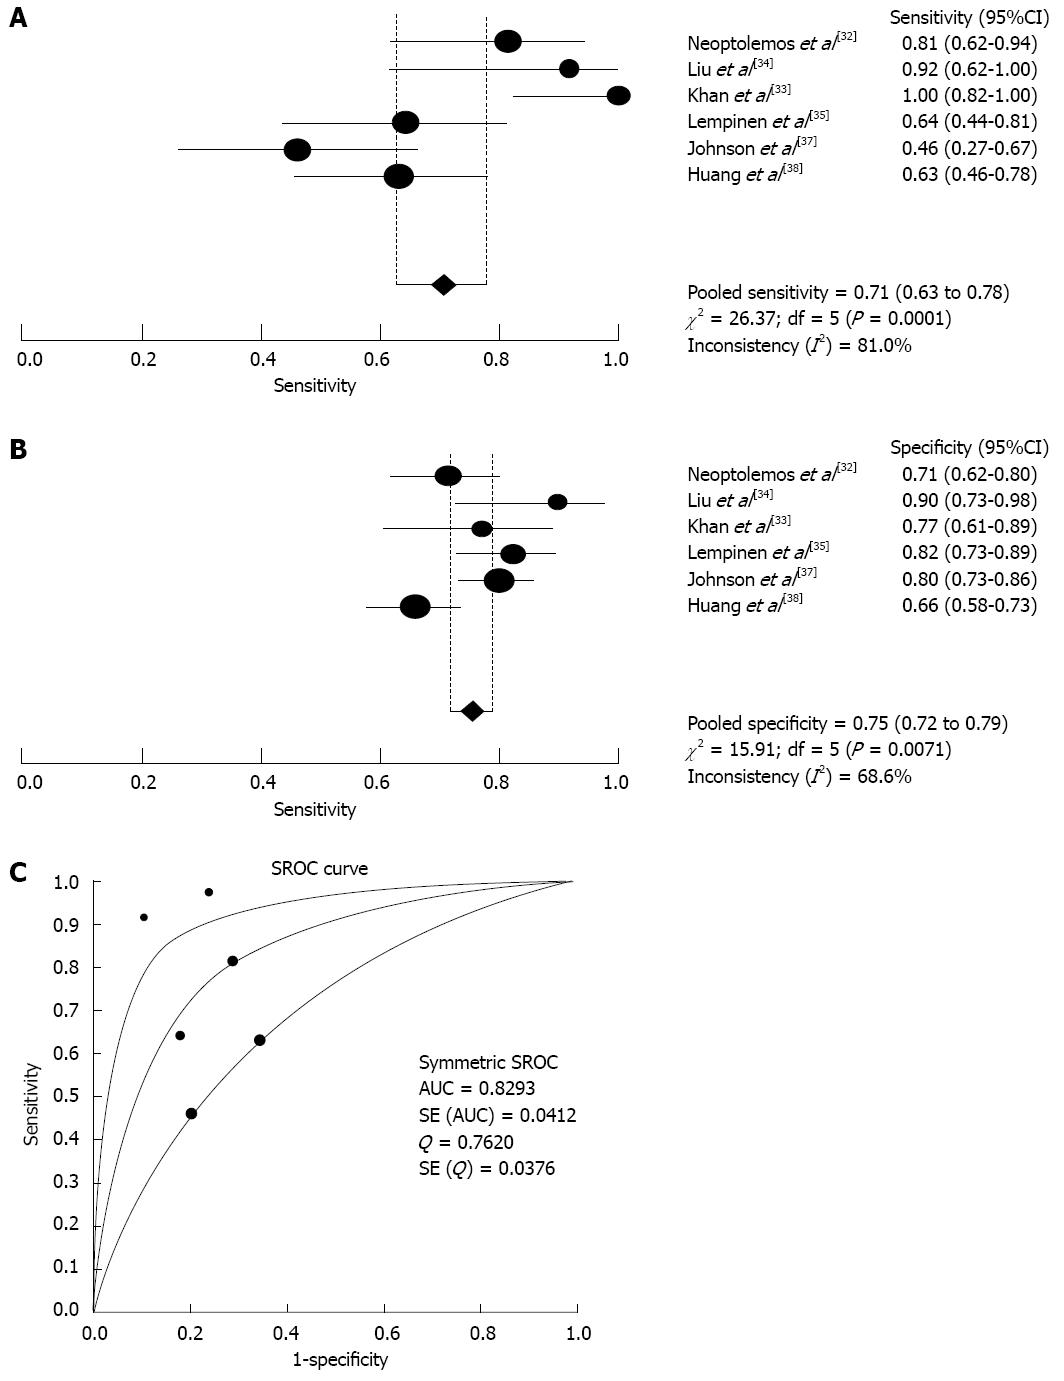
Figure 2 Forest plots of sensitivity (A), specificity (B), and summary receiver operating characteristic curve (C) for on admission urinary trypsinogen activation peptide in predicting severe acute pancreatitis.
SROC: Summary receiver operating characteristic; AUC: Area under the curve.
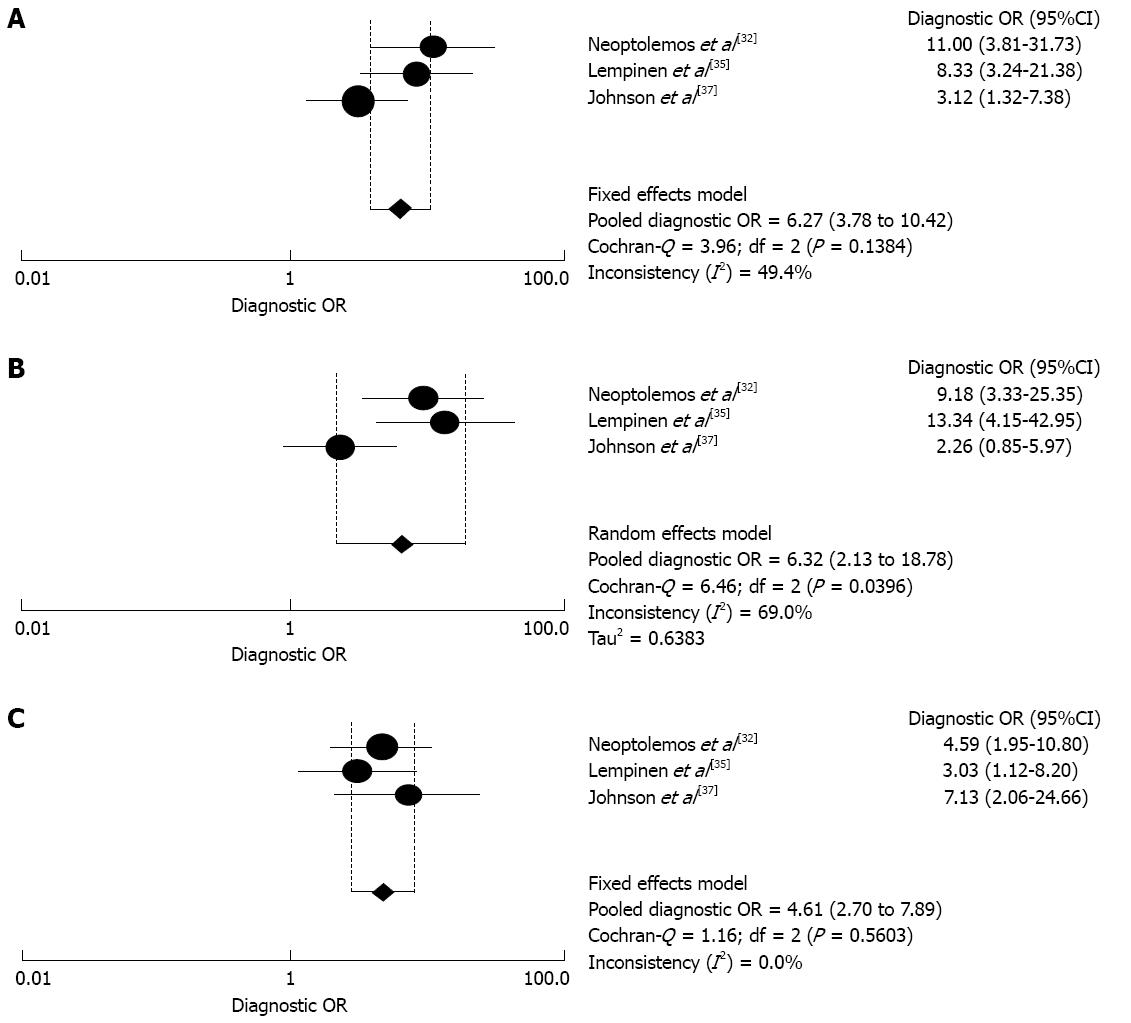
Figure 3 Forest plots of diagnostic OR for urinary trypsinogen activation peptide vs serum C-reactive protein and urinary trypsinogen activation peptide vs Acute Physiology and Chronic Health Evaluation II score in predicting severe acute pancreatitis.
The pooled diagnostic odds ratios of on-admission urinary trypsinogen activation peptide (A), plasma C-reactive protein at 48 h (B) and Acute Physiology and Chronic Health Evaluation II score at 48 h (C).
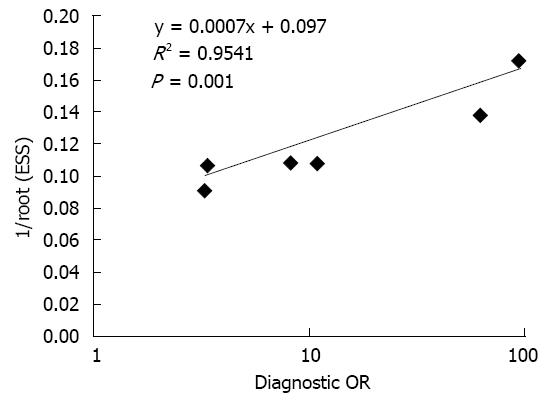
Figure 4 Funnel plot of the effect of effective sample size weighted regression tests of asymmetry for included studies.
ESS: Effective sample size.
- Citation: Huang W, Altaf K, Jin T, Xiong JJ, Wen L, Javed MA, Johnstone M, Xue P, Halloran CM, Xia Q. Prediction of the severity of acute pancreatitis on admission by urinary trypsinogen activation peptide: A meta-analysis. World J Gastroenterol 2013; 19(28): 4607-4615
- URL: https://www.wjgnet.com/1007-9327/full/v19/i28/4607.htm
- DOI: https://dx.doi.org/10.3748/wjg.v19.i28.4607


