Copyright
©2011 Baishideng Publishing Group Co.
World J Gastroenterol. Apr 14, 2011; 17(14): 1895-1902
Published online Apr 14, 2011. doi: 10.3748/wjg.v17.i14.1895
Published online Apr 14, 2011. doi: 10.3748/wjg.v17.i14.1895
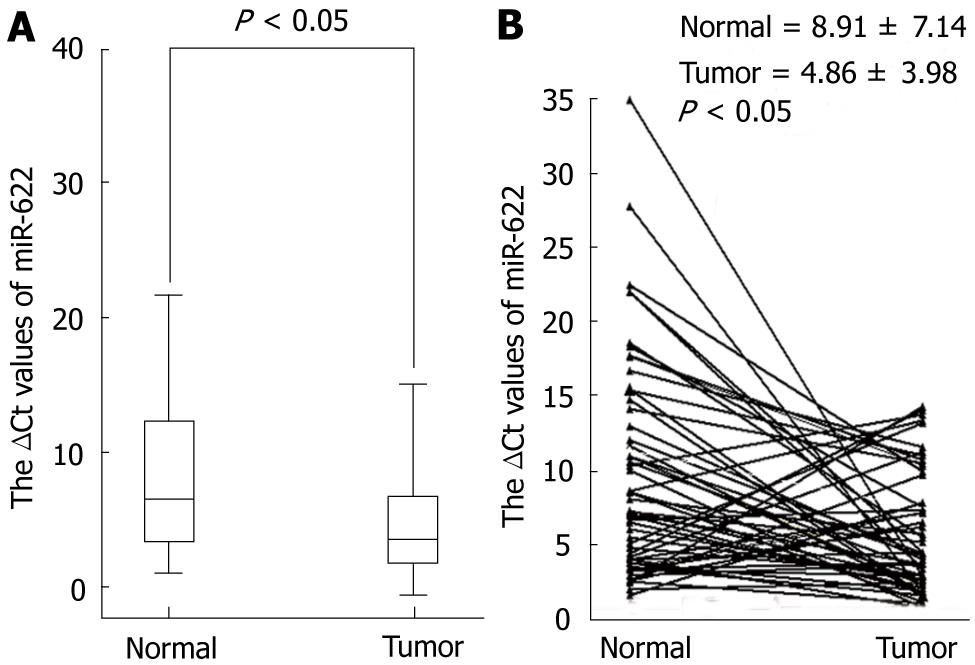
Figure 1 Expression of miR-622 was down-regulated in gastric cancer.
A: Level of miR-622 expression in gastric cancer tissues (n = 57) was lower than that in non-tumor tissues (n = 57). B: The values (ΔCt) are relative to those of U6 small RNA.
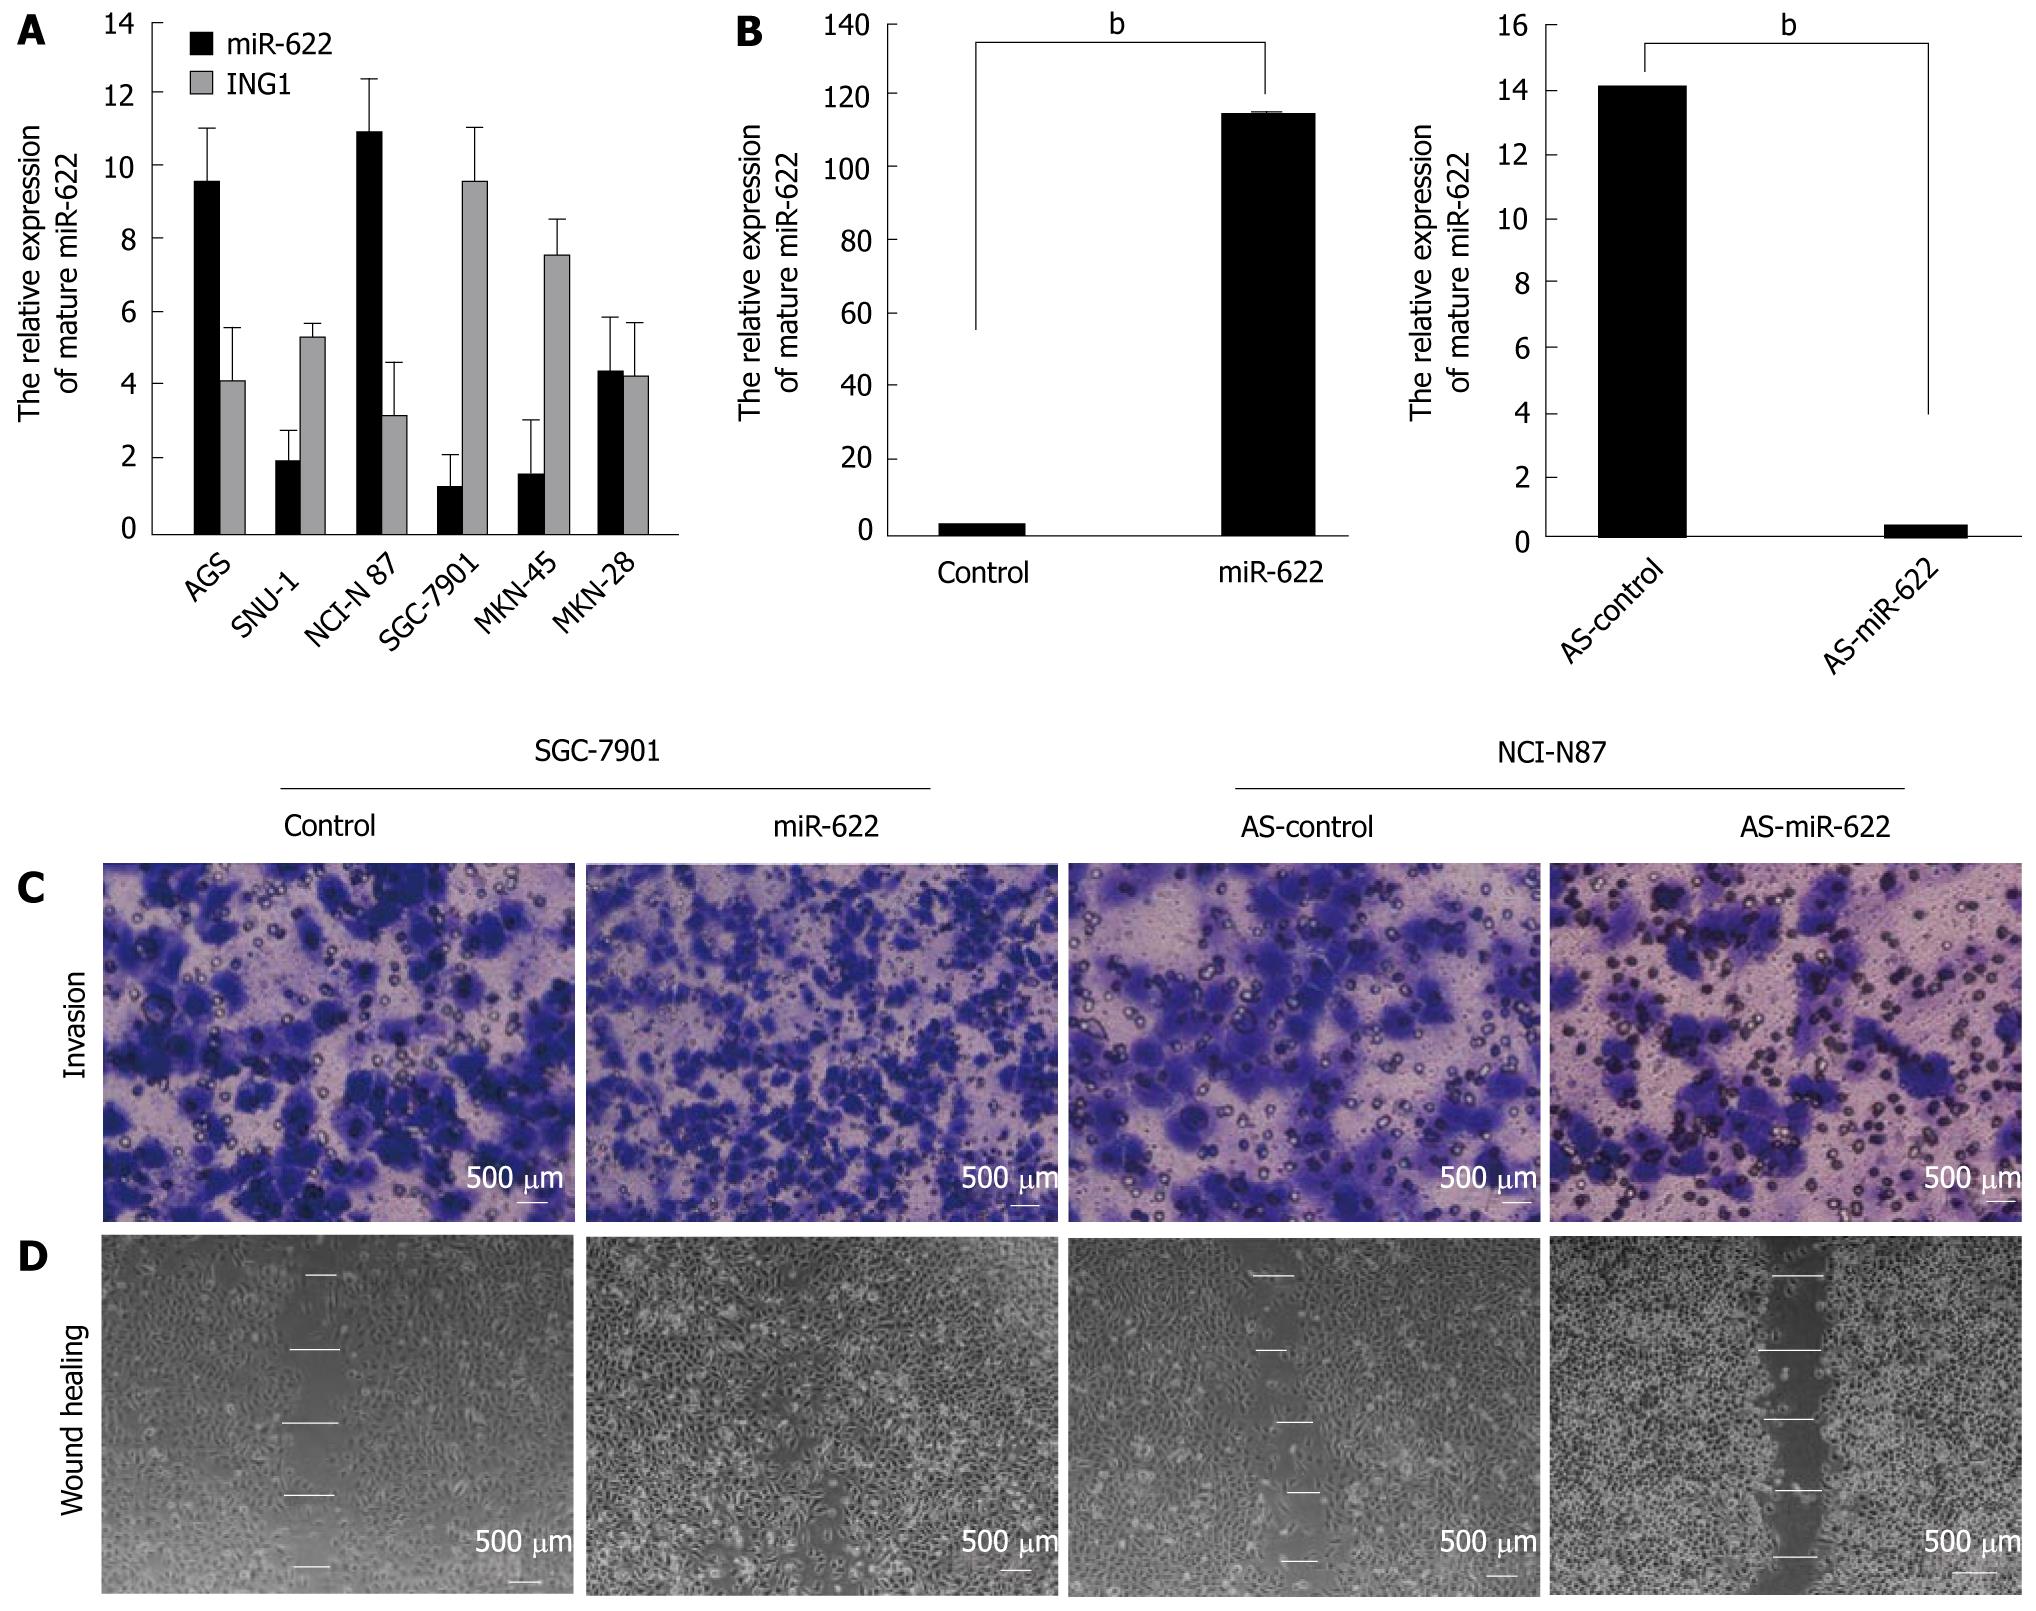
Figure 2 Restoration of miR-622 promotes gastric cancer cell invasion and migration.
A: q-real time polymerase chain reaction for the expression of miR-622 and ING1 was performed using six gastric cancer cell lines. The lowest and highest levels of miR-622 expression among the six gastric cancer cell lines were found in SGC-7901 and NCI-N87 cells, respectively, and the expression of miR-622 was inversely correlated with the expression of ING1; B: Expression of miR-622 was restored or suppressed in gastric cancer cells after miR-622 precursor or miR-622 inhibitor transfection, compared with the controls (P < 0.01); C and D: Over-expression of miR-622 promotes increased cell invasion and migration compared with the miR-control transfectants. However, down-regulation of miR-622 inhibited cell invasion and migration compared with AS-control transfectants. bP < 0.01, compared with miR-control transfectants. Scale bars: 500 μm. AS-miR-622: An ambion miRNA inhibitor for miR-622.
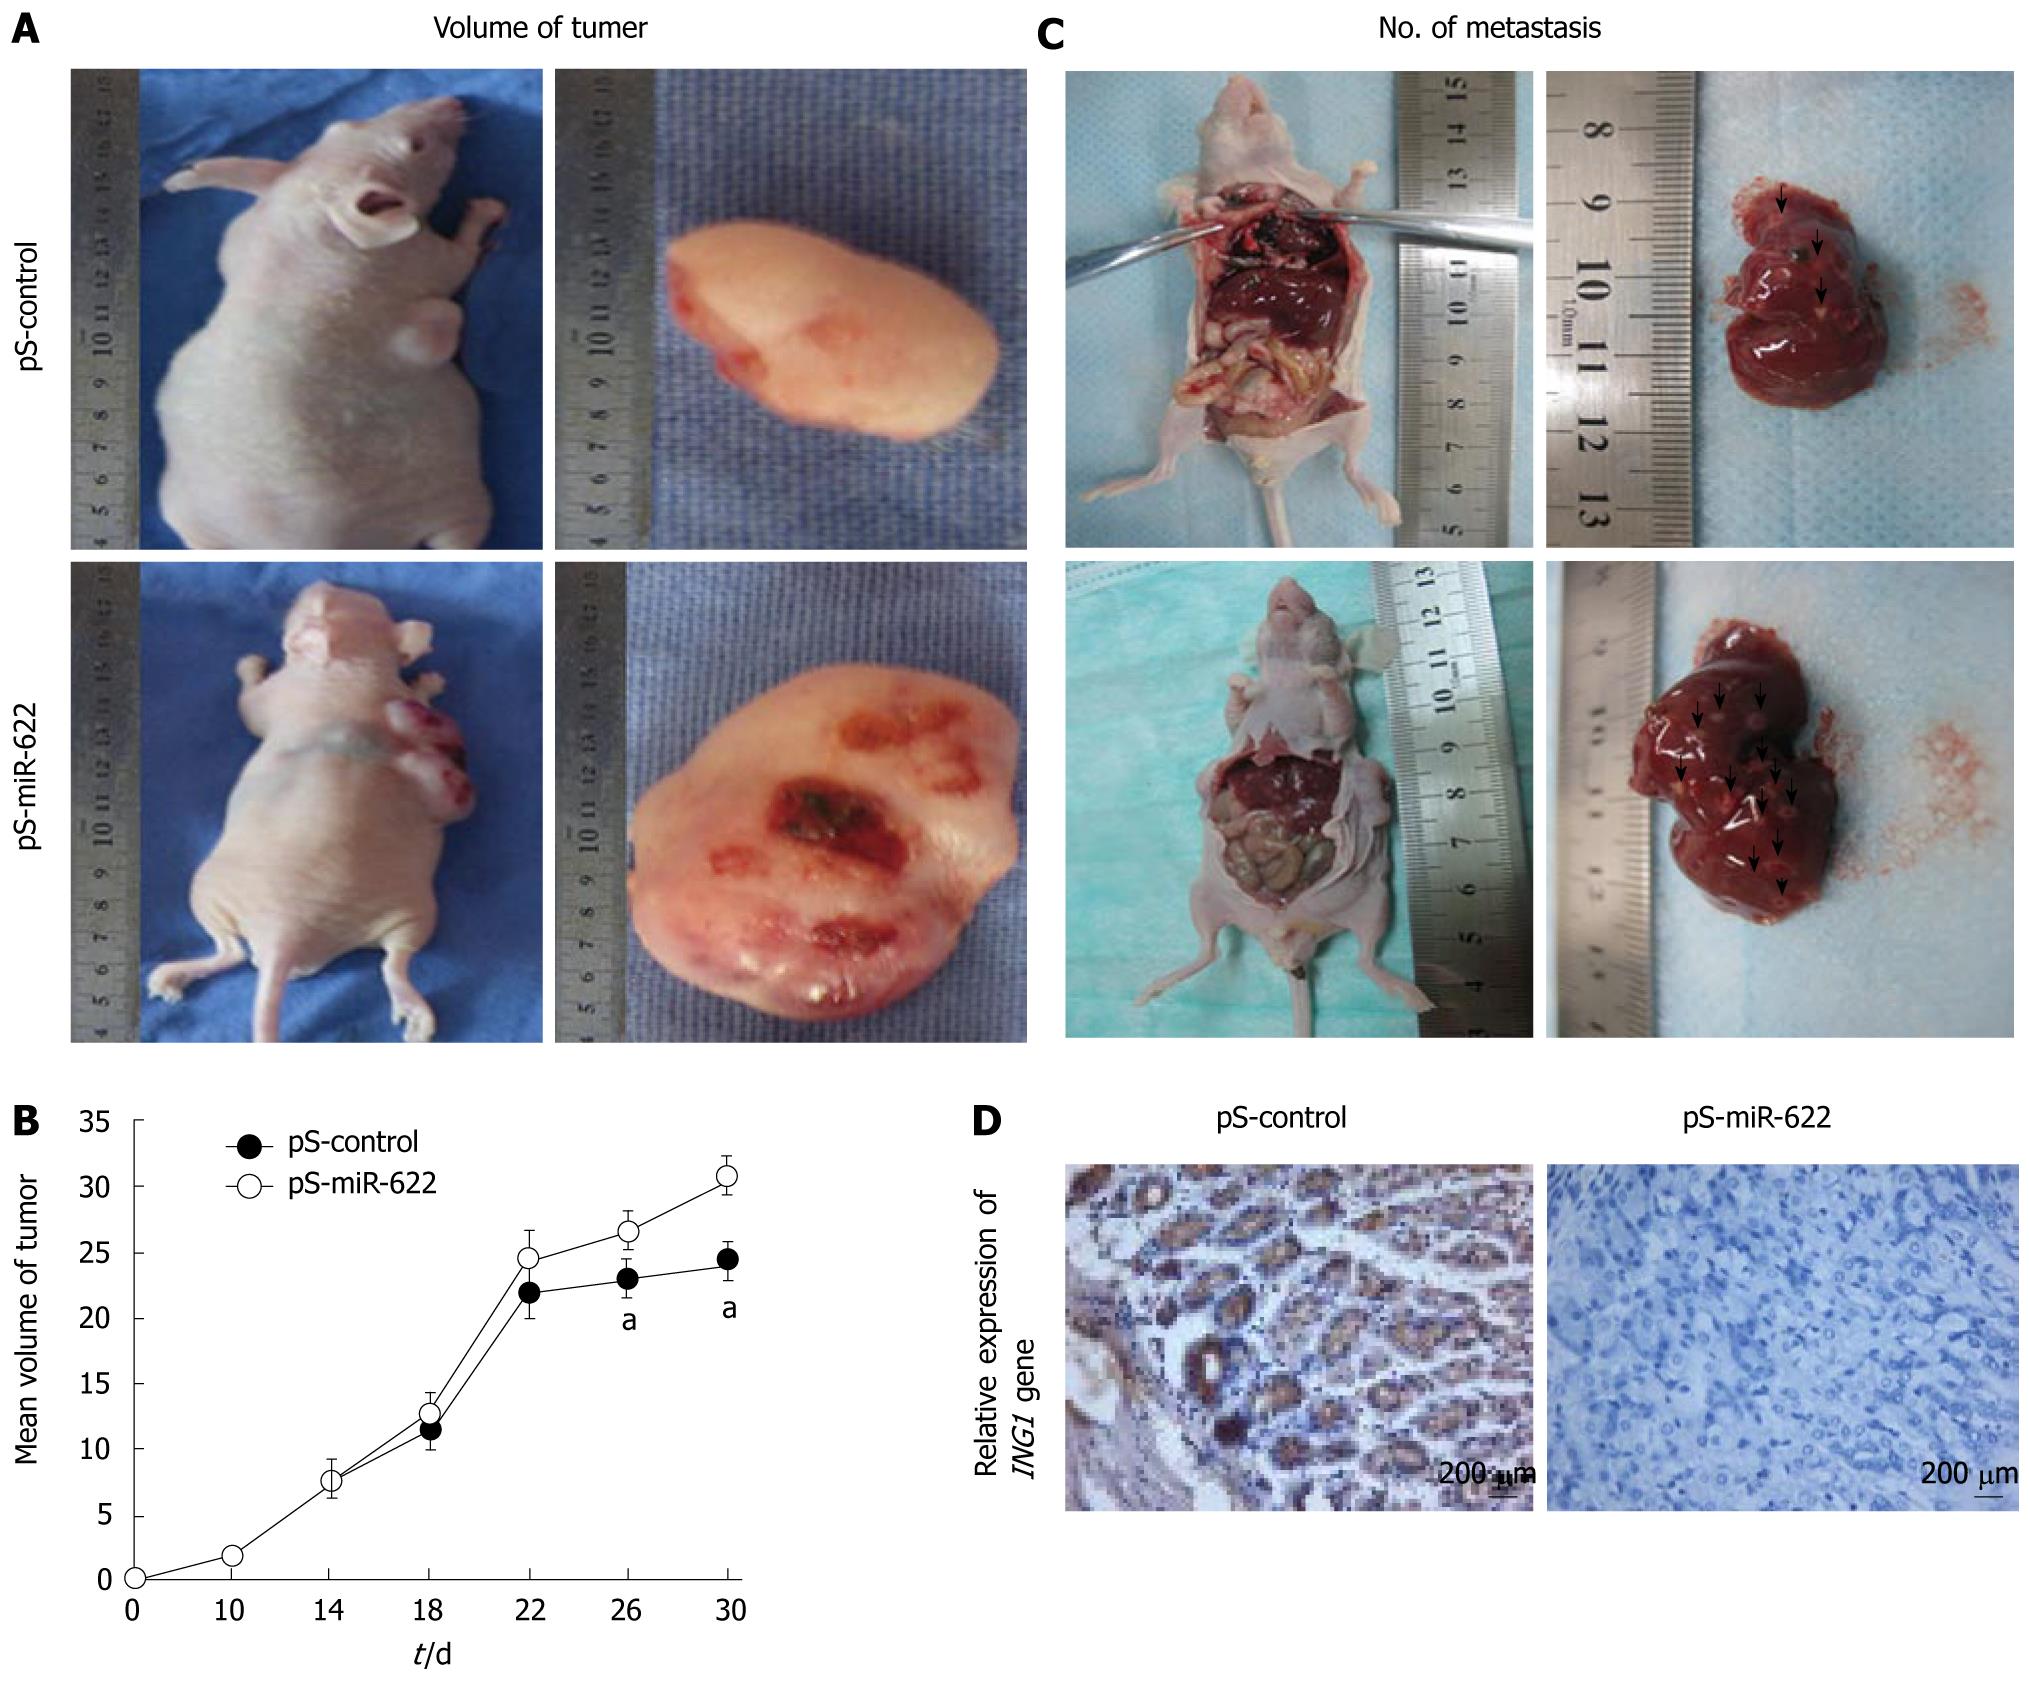
Figure 3 MiR-622 promotes tumorigenesis and metastasis in vivo.
A: Photographs of tumors in nude mice resulting from injection of miR-622 expression vector (pS-miR-622) or control plasmid (pS-control) stably transfected SGC-7901 cells; B: Tumorigenesis curves. Rapid tumor growth was observed in the pS-miR-622 group (data expressed as mean ± SD; P < 0.05); C: Photographs of the number of liver metastatic nodes in nude mice injected with pS-miR-622 or pS-control vector stably transfected SGC-7901 cells. The arrows indicate liver metastatic nodes; D: Histological examination found that the expression of ING1 was markedly reduced in the pS-miR-622-transfection group compared with the control groups. aP < 0.05, compared with miR-control transfectants. Scale bars: 200 μm. pS-control: Control plasmid; pS-miR-622: miR-622 expression vector.
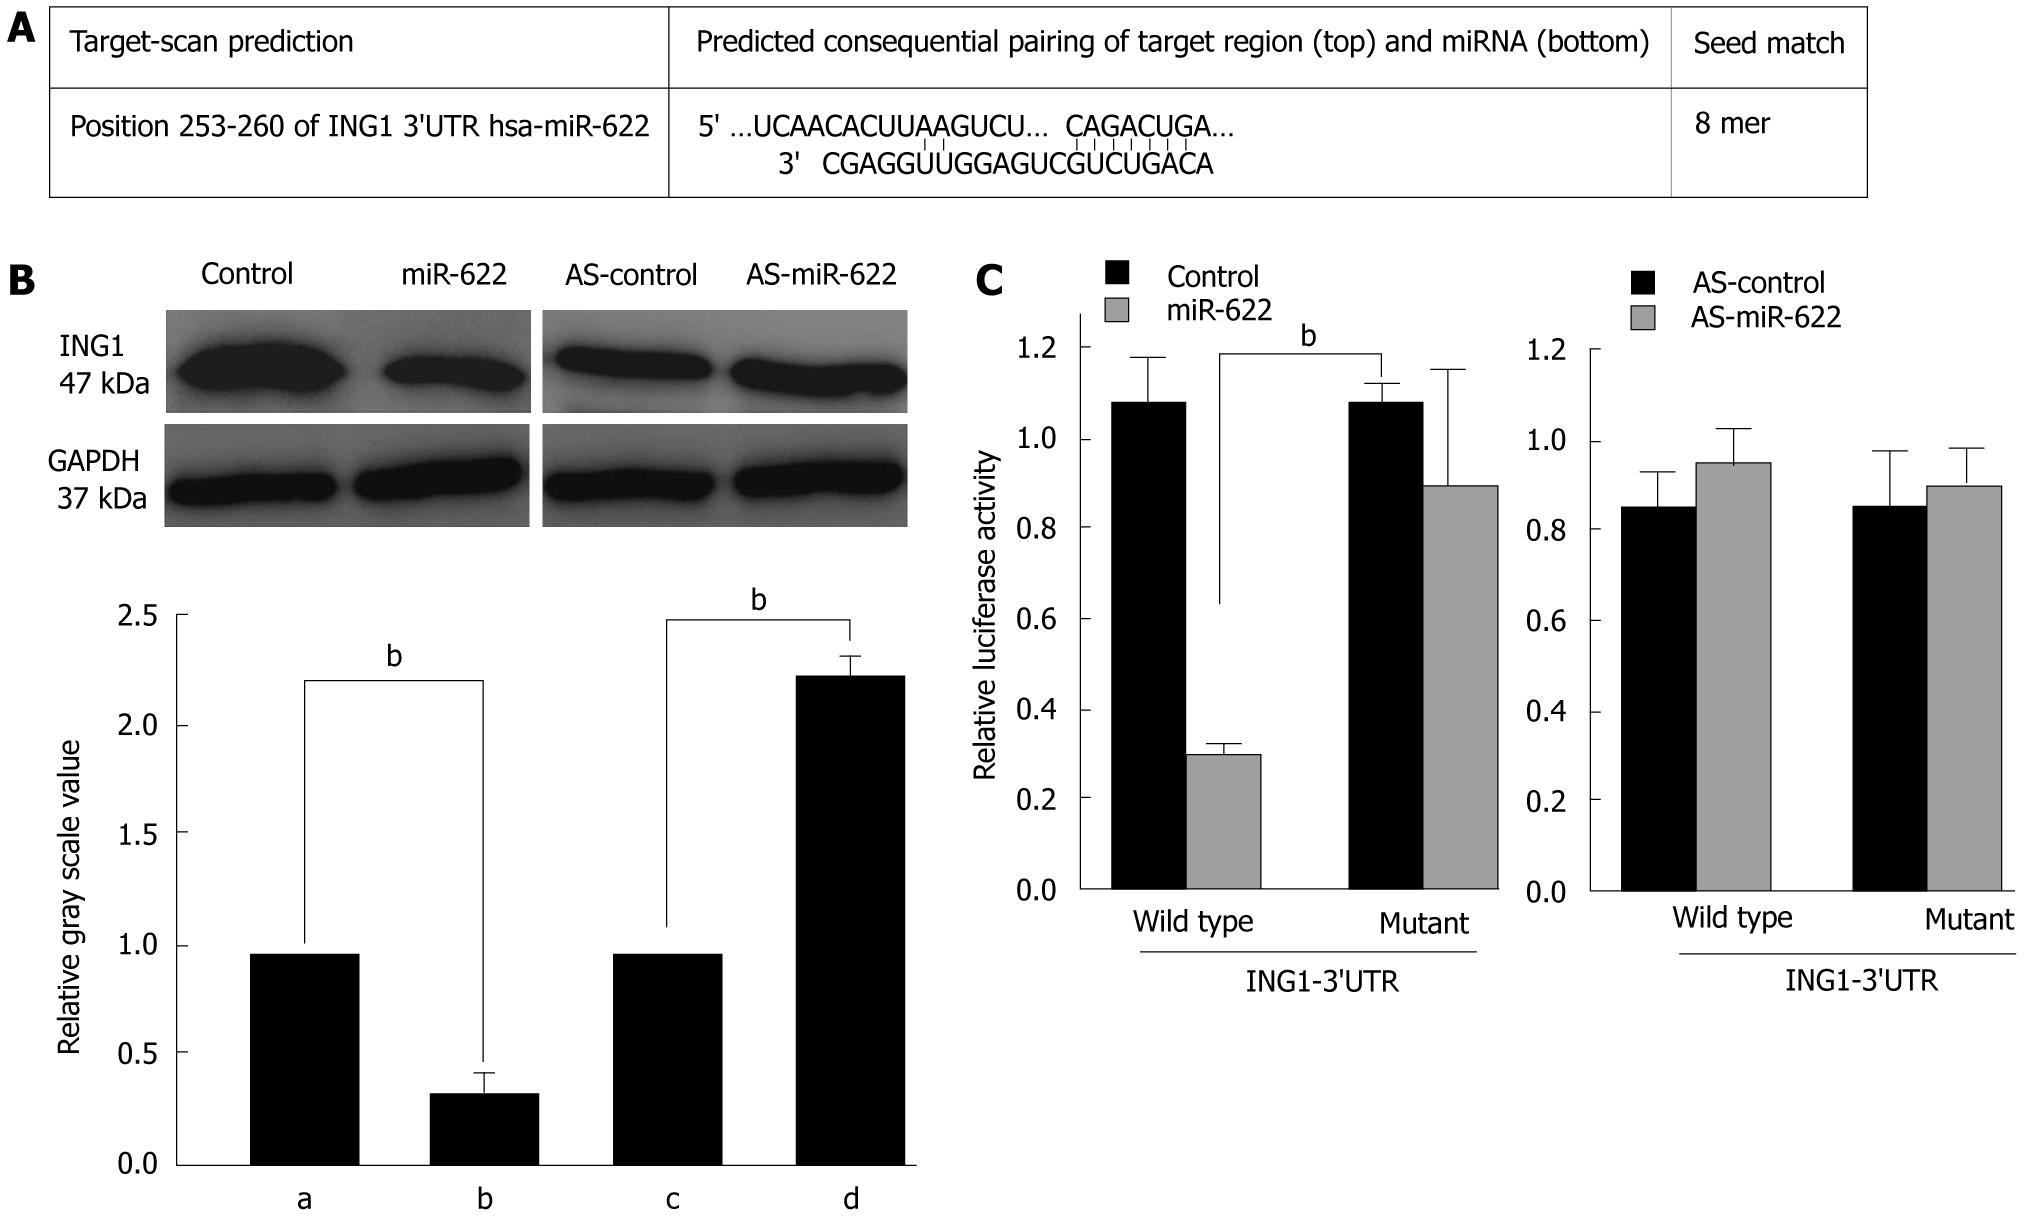
Figure 4 MiR-622 binds to the 3’UTR of Inhibitor of growth family, member 1 to post-transcriptionally repress the protein levels.
A: Representative nucleotide sequence matches between possible target genes and miRNAs. Putative binding site of miR-622 in the ING1 3’UTR region (detected by TargetScan). Only matched nucleotides with miRNA seed sequences are indicated with vertical lines; B: Effects of miR-622 on ING1 protein levels. HEK 293T cells were transfected with 100 nmol/L of miR-622 precursor or miR-622 inhibitor. Whole-cell lysates were prepared 72 h after transfection and subjected to immunoblot analysis using antibodies against ING1 and glyceraldehyde-3-phosphate dehydrogenase (GAPDH). Relative gray scale values were compared with GAPDH; C: Luciferase reporter assay. A total of 1 × 10⁵ HEK 293T cells were transfected with 100 ng wild-type-UTR-reporter or mutant-UTR-reporter constructs together with 100 nmol/L of miR-622 precursor or miR-622 inhibitor as indicated. bP < 0.01. Each bar represents mean values ± SE from three independent experiments. ING1: Inhibitor of growth family, member 1; AS-miR-622: An ambion miRNA inhibitor for miR-622.
- Citation: Guo XB, Jing CQ, Li LP, Zhang L, Shi YL, Wang JS, Liu JL, Li CS. Down-regulation of miR-622 in gastric cancer promotes cellular invasion and tumor metastasis by targeting ING1 gene. World J Gastroenterol 2011; 17(14): 1895-1902
- URL: https://www.wjgnet.com/1007-9327/full/v17/i14/1895.htm
- DOI: https://dx.doi.org/10.3748/wjg.v17.i14.1895


