Copyright
©2010 Baishideng.
World J Gastroenterol. Apr 28, 2010; 16(16): 2010-2016
Published online Apr 28, 2010. doi: 10.3748/wjg.v16.i16.2010
Published online Apr 28, 2010. doi: 10.3748/wjg.v16.i16.2010
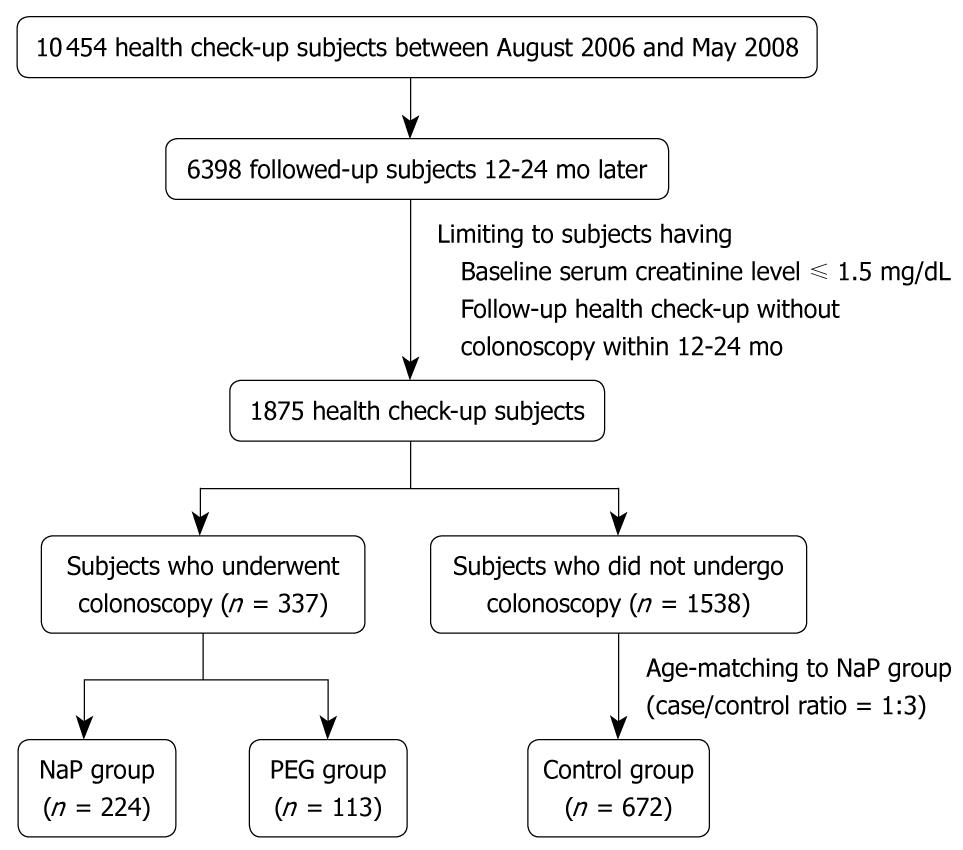
Figure 1 Flow diagram for selection of case and control subjects.
NaP: Sodium phosphate; PEG: Polyethylene glycol.
Figure 2 Comparison of changes of creatinine level and glomerular filtration rates (GFR) among NaP, PEG and control groups.
- Citation: Seol DC, Hong SN, Kim JH, Sung IK, Park HS, Lee JH, Shim CS. Change in renal function after sodium phosphate preparation for screening colonoscopy. World J Gastroenterol 2010; 16(16): 2010-2016
- URL: https://www.wjgnet.com/1007-9327/full/v16/i16/2010.htm
- DOI: https://dx.doi.org/10.3748/wjg.v16.i16.2010


