Copyright
©2005 Baishideng Publishing Group Inc.
World J Gastroenterol. Nov 7, 2005; 11(41): 6459-6465
Published online Nov 7, 2005. doi: 10.3748/wjg.v11.i41.6459
Published online Nov 7, 2005. doi: 10.3748/wjg.v11.i41.6459
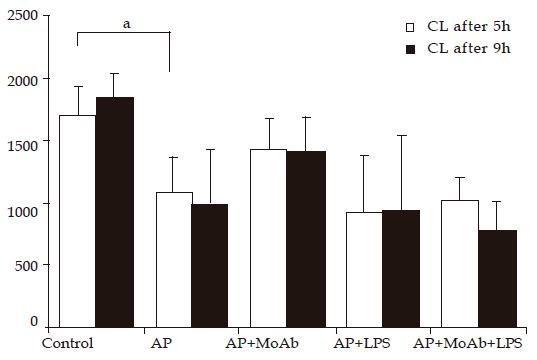
Figure 1 Whole blood CL.
aP<0.05 vs control group.
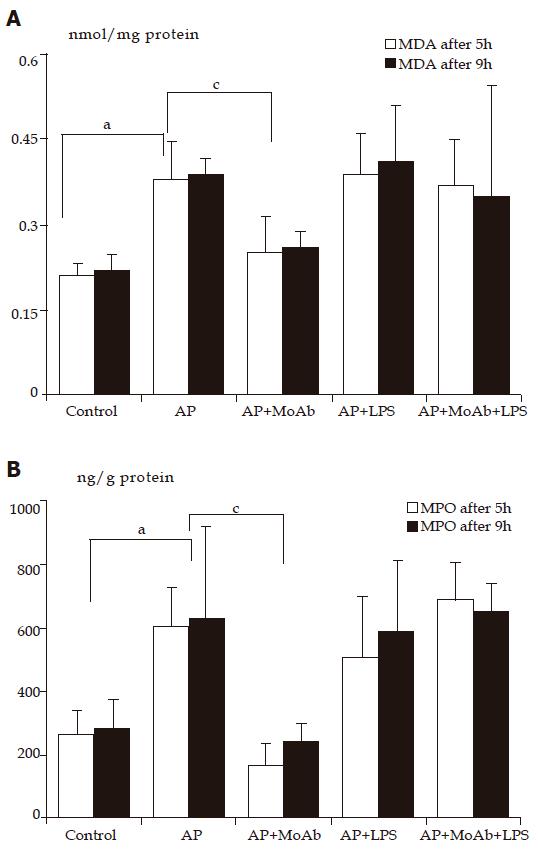
Figure 2 MDA (A) and MPO (B) level in pancreatic homogenate.
aP<0.05 vs control group; cP<0.05 vs AP group. MDA: malonyldialdehyde; MPO: myeloperoxidase.
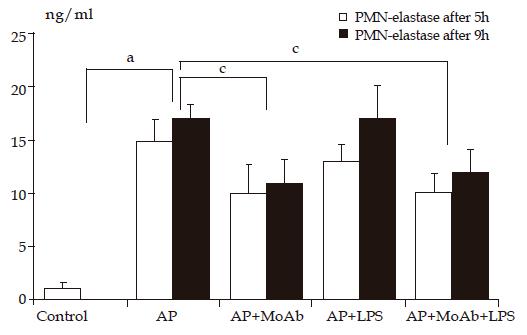
Figure 3 Plasma PMN-E concentration.
aP<0.05 vs control group; cP<0.05 vs AP group.
- Citation: Hać S, Dobosz M, Kaczor JJ, Rzepko R, Aleksandrowicz-Wrona E, Wajda Z, Śledziński Z, Krajewski J. Neutrophil engagement and septic challenge in acute experimental pancreatitis in rats. World J Gastroenterol 2005; 11(41): 6459-6465
- URL: https://www.wjgnet.com/1007-9327/full/v11/i41/6459.htm
- DOI: https://dx.doi.org/10.3748/wjg.v11.i41.6459


