Copyright
©2005 Baishideng Publishing Group Inc.
World J Gastroenterol. May 21, 2005; 11(19): 2869-2873
Published online May 21, 2005. doi: 10.3748/wjg.v11.i19.2869
Published online May 21, 2005. doi: 10.3748/wjg.v11.i19.2869
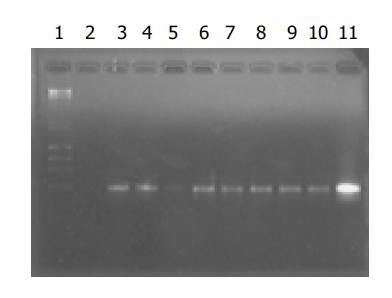
Figure 1 Electrophoresis of amplification products of DNA from mouse oocytes.
Lane 1: markers; lane 2: negative control; lane 11: positive control; lanes 3-10: amplification products of DNA from group A oocytes in eight experiments.
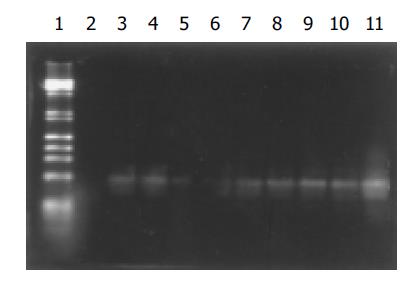
Figure 2 Southern blot results of amplification products of DNA from mouse oocytes.
Lane 1: Markers; lane 2: negative control; lane 11: positive control; lanes 3-10: amplification products of DNA from group A oocytes in eight experiments.
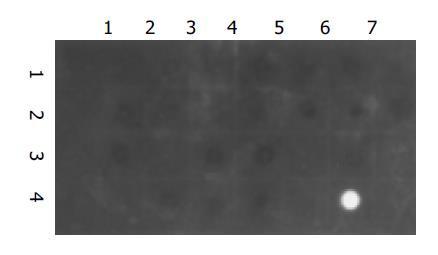
Figure 3 Dot hybridization for the washing solution.
Dots (1,1): negative control; Dots (4,6): positive control; Dots (1,2) to (1,7), (2,1) to (2,7), (3,1) to (3,7), (4,1) to (4,4): the washing solution samples from group A in eight experiments.
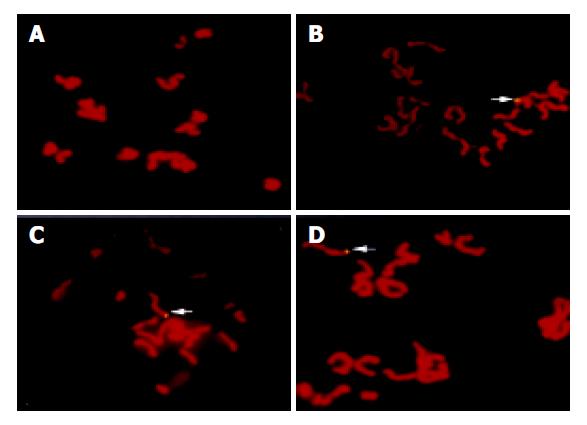
Figure 4 FISH results.
A: No signal of HBV DNA integration in the metaphase from group B oocytes. B-D: Clear signals of HBV DNA integration in the metaphases from group A oocytes (arrow).
- Citation: Huang TH, Zhang QJ, Xie QD, Zeng LP, Zeng XF. Presence and integration of HBV DNA in mouse oocytes. World J Gastroenterol 2005; 11(19): 2869-2873
- URL: https://www.wjgnet.com/1007-9327/full/v11/i19/2869.htm
- DOI: https://dx.doi.org/10.3748/wjg.v11.i19.2869


