Copyright
©2012 Baishideng.
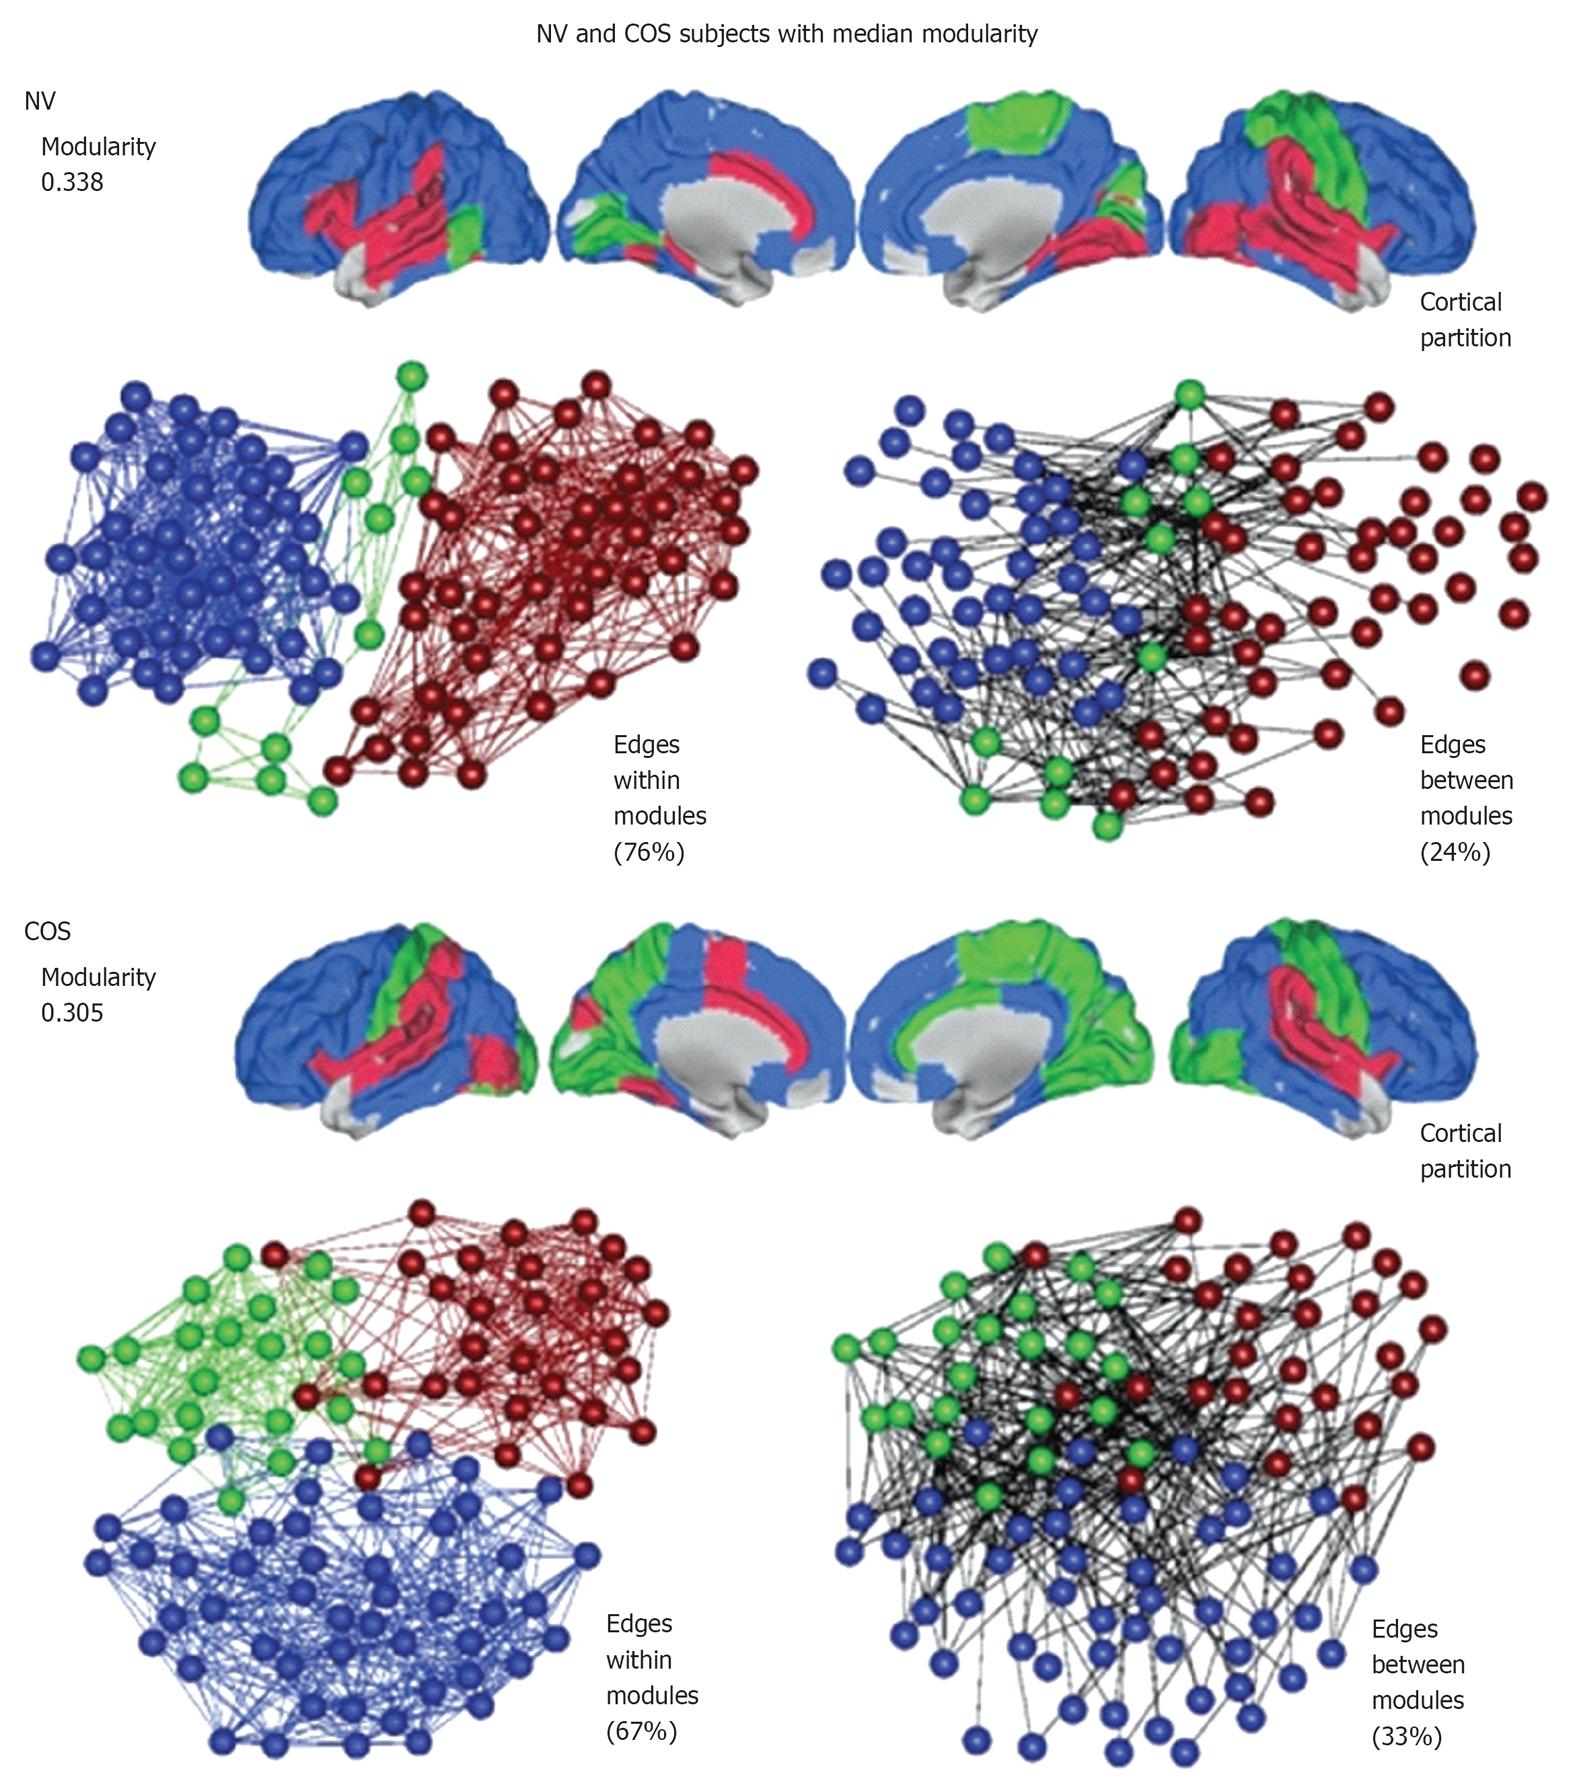
Figure 4 An illustration of modularity using representative brain networks from a childhood-onset schizophrenia population and a control (NV) population.
At a local threshold of 0.22 topological cost, the modular partition is shown for the median NV subject (above) and the median childhood-onset schizophrenia (COS) subject (below). Each module is assigned a specific color and the modular structure of each subject is illustrated in three different ways. The cortical partition shows the anatomical location of modules, while the left-hand topological plot shows the density of intra-modular edges between nodes in different modules[69].
- Citation: Micheloyannis S. Graph-based network analysis in schizophrenia. World J Psychiatr 2012; 2(1): 1-12
- URL: https://www.wjgnet.com/2220-3206/full/v2/i1/1.htm
- DOI: https://dx.doi.org/10.5498/wjp.v2.i1.1


