Copyright
©2012 Baishideng.
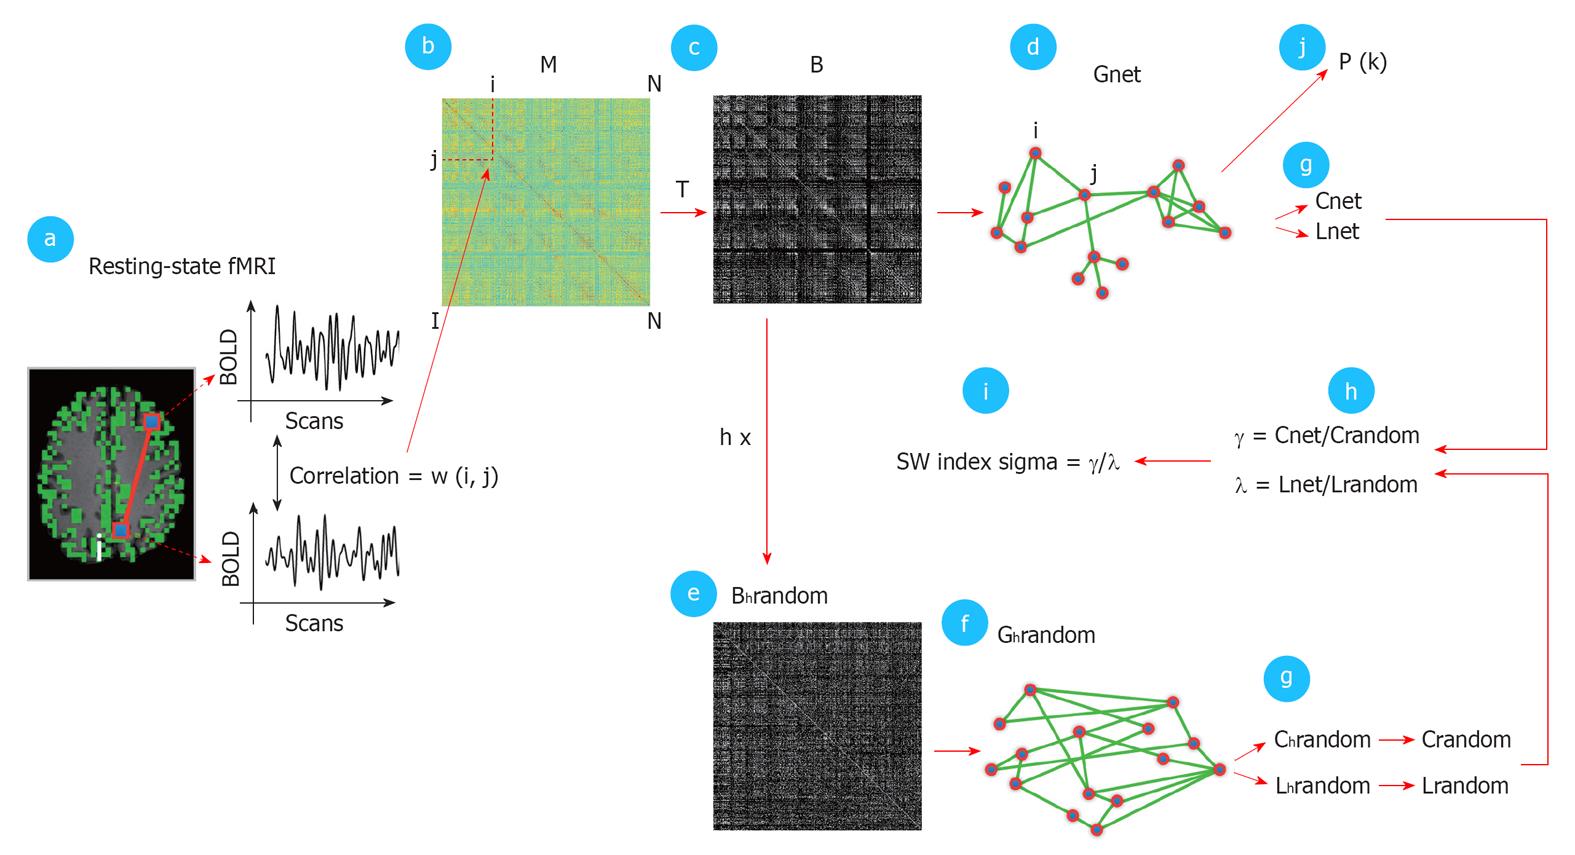
Figure 3 Detailed schematic illustration of the graph analysis.
The first step (panel a) consisted of calculating the temporal zero-lag correlations between the filtered functional magnetic resonance imaging BOLD time-series of all voxels, which was believed to reflect inter-voxel functional connectivity. The computed correlations were represented as a correlation matrix M, with cell M (i, j) holding the level of functional connectivity between voxel i and voxel j (panel b). M was thresholded with a threshold T (panel c), resulting in a binary connectivity matrix B, representing an unweighted graph Gnet (panel d). T varied between 0 and 0.7 (with steps of 0.05) and a range of fixed k between 4000 and 20. For each fixed k, M was thresholded with a computed T that corresponded exactly to a connectivity degree of k for that particular individual dataset. Next, B was randomized (panel e) to create a random graph Grandom with a similar connectivity distribution P (k) as Gnet but a random organization of connections. Also, h random graphs were formed per Gnet. From Grandom and Gnet, the graph characteristics Cnet, Lnet, Crandom, Lrandom were computed (panel g). Crandom and Lrandom were created by averaging the clustering-coefficient and path length of the h random graphs. Next, γ and λ were computed, as defined as Cnet/Crandom and Lnet/Lrandom (panel h). The small-world index sigma was computed as the ratio between γ and λ (SW index, panel i) expressing the small-worldness of Gnet. In addition, the connectivity distribution P (k) of Gnet was computed (panel j). Finally, the individually computed graph characteristics were averaged over the group of subjects and the group averaged connectivity distribution P (k) was fitted with a power-law function to examine a possible scale-free organization of the functionally connected human brain[36].
- Citation: Micheloyannis S. Graph-based network analysis in schizophrenia. World J Psychiatr 2012; 2(1): 1-12
- URL: https://www.wjgnet.com/2220-3206/full/v2/i1/1.htm
- DOI: https://dx.doi.org/10.5498/wjp.v2.i1.1


