Copyright
©2012 Baishideng.
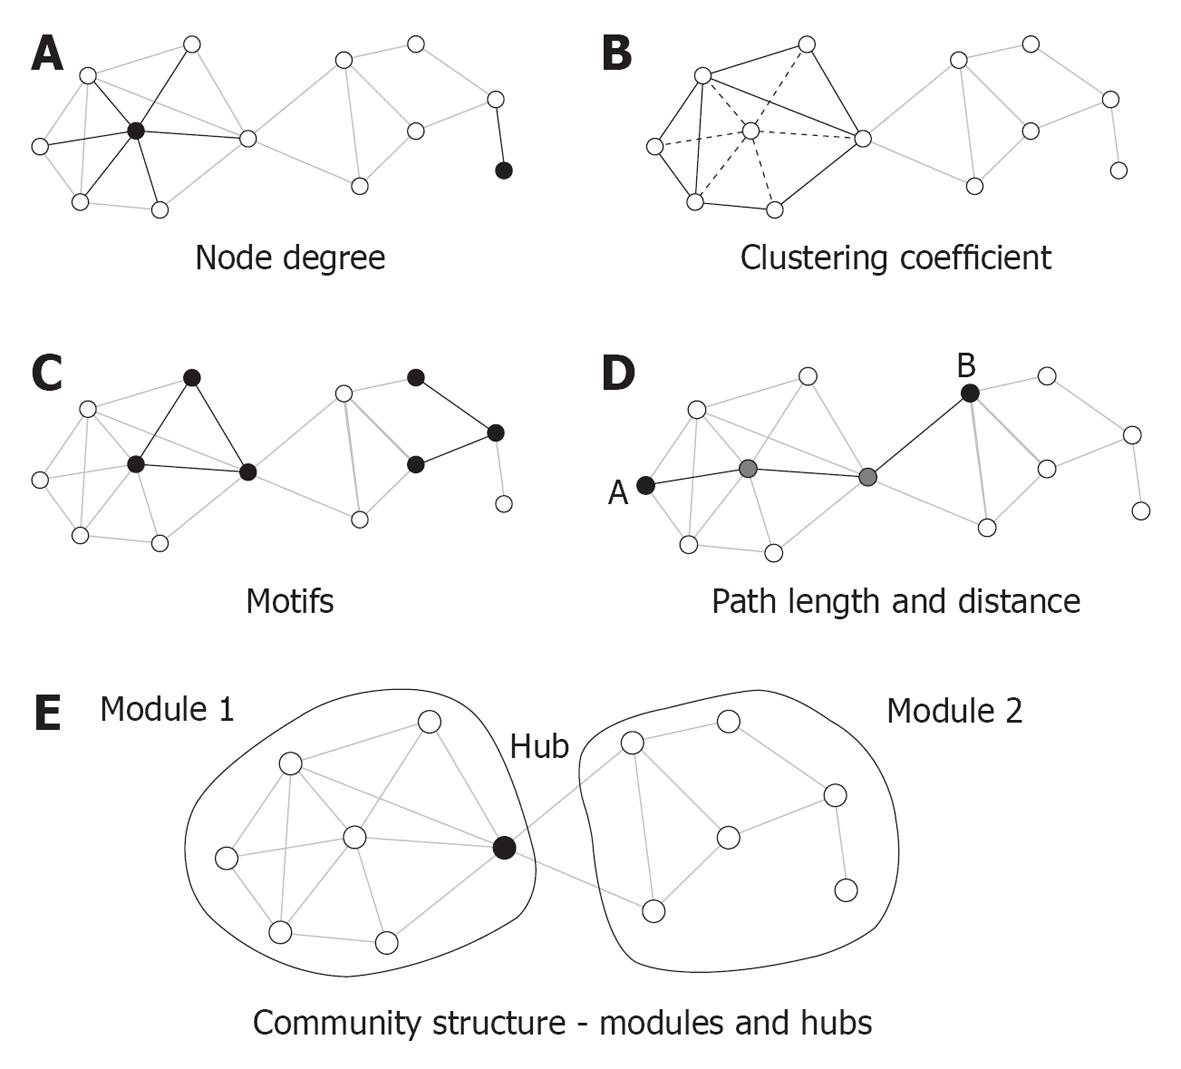
Figure 2 Key graph measures and their definitions.
The measures are illustrated in a rendering of a simple undirected graph with 12 nodes and 23 edges. A: Node degree corresponds to the number of edges attached to a given node, which are shown here for a highly connected node (left) and a peripheral node (right); B: The clustering coefficient is shown here for a central node and its six neighbors. These neighbors maintain eight out of 15 possible edges for a clustering coefficient of 0.53; C: Each network can be decomposed into subgraphs of motifs. The plot shows two examples of two different classes of three-node motifs; D: The distance between two nodes is the length of the shortest path. Nodes A and B connect in three steps through two intermediate nodes (shown in gray). The average of the finite distances for all node pairs is the graph’s path length; E: The network forms two modules interconnected by a single hub node[85].
- Citation: Micheloyannis S. Graph-based network analysis in schizophrenia. World J Psychiatr 2012; 2(1): 1-12
- URL: https://www.wjgnet.com/2220-3206/full/v2/i1/1.htm
- DOI: https://dx.doi.org/10.5498/wjp.v2.i1.1


