Copyright
©The Author(s) 2017.
World J Cardiol. Apr 26, 2017; 9(4): 320-331
Published online Apr 26, 2017. doi: 10.4330/wjc.v9.i4.320
Published online Apr 26, 2017. doi: 10.4330/wjc.v9.i4.320
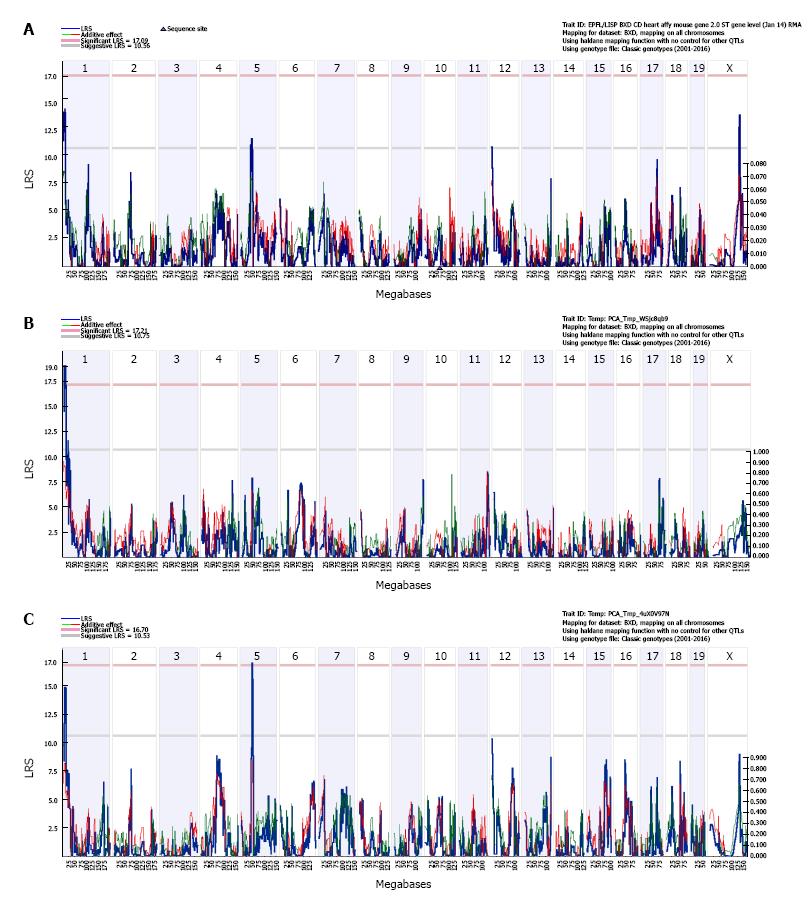
Figure 2 Genetic mapping of Mypn expression in the heart of BXD mice.
The interval mapping at the transcript level identified 4 suggestive eQTLs at chromosome 1, 5, 12, and X respectively (A). The interval mapping for the first principal component of exon 6, 12, and 17 showed a significant eQTL (genome-wide P < 0.05) at Chr 1 (B). The interval mapping for the first principal component of exons 7, 14, 18, and 19 showed a suggestive eQTL at Chr 1 and a significant eQTL (genome-wide P < 0.05) at Chr 5 (Figure 2C). The left Y-axis provides LRS score in blue and right Y-axis provides the additive effect in green. The red and green lines show the effect of the D or B allele on trait values, respectively. The upper X-axis shows location by chromosome and the lower X-axis shows location in megabases. The two horizontal lines across the plot make the threshold for genome-wide significant (P < 0.05, red or upper line) and suggestive (P < 0.63, grey or lower line) thresholds. eQTL: Expression quantitative trait locus; LRS: Likelihood ratio statistic.
- Citation: Gu Q, Mendsaikhan U, Khuchua Z, Jones BC, Lu L, Towbin JA, Xu B, Purevjav E. Dissection of Z-disc myopalladin gene network involved in the development of restrictive cardiomyopathy using system genetics approach. World J Cardiol 2017; 9(4): 320-331
- URL: https://www.wjgnet.com/1949-8462/full/v9/i4/320.htm
- DOI: https://dx.doi.org/10.4330/wjc.v9.i4.320


