Copyright
©The Author(s) 2023.
World J Diabetes. Aug 15, 2023; 14(8): 1280-1288
Published online Aug 15, 2023. doi: 10.4239/wjd.v14.i8.1280
Published online Aug 15, 2023. doi: 10.4239/wjd.v14.i8.1280
Figure 1 Changes in blood glucose levels before and after treatment in patients.
A: Fasting blood glucose (FBG); B: 2-h postprandial blood glucose (2hPBG); C: Glycated hemoglobin (HbA1c). aP < 0.05; bP < 0.01; cP < 0.001.
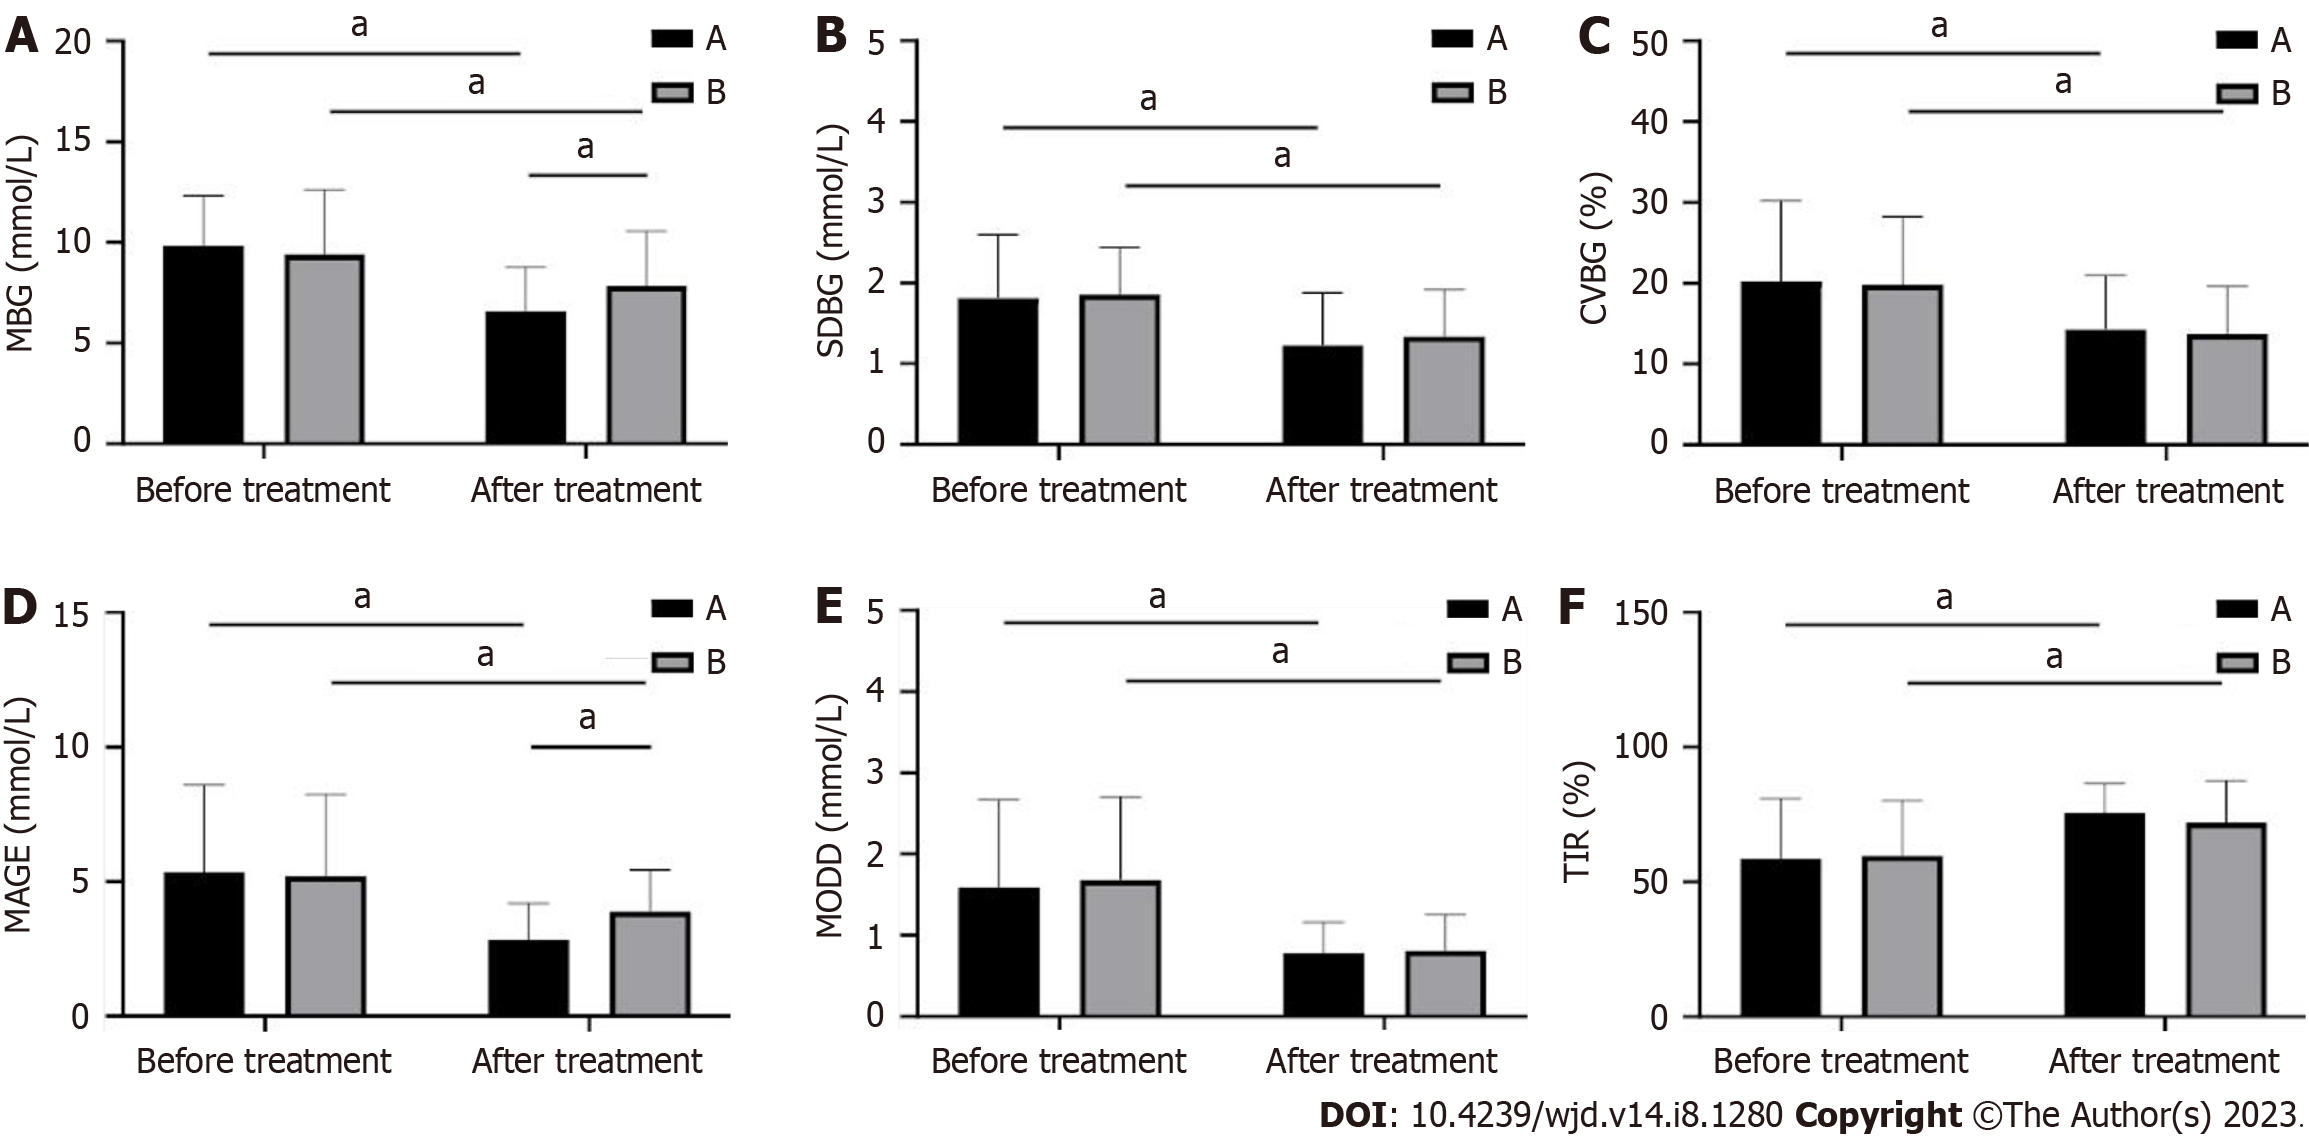
Figure 2 Changes in blood glucose level and islet cell function of patients before and after treatment.
A: 24-h mean blood glucose (MBG); B: 24-h standard deviation of blood glucose (SDBG); C: Coefficient of variation (CV%); D: Mean amplitude of glycemic excursions (MAGEs); E: Absolute mean of daily differences (MODD); F: Percentage of time (TIR) with 3.9 mmol/L < glucose < 10 mmol/L before and after treatment in the two groups. aP < 0.001.
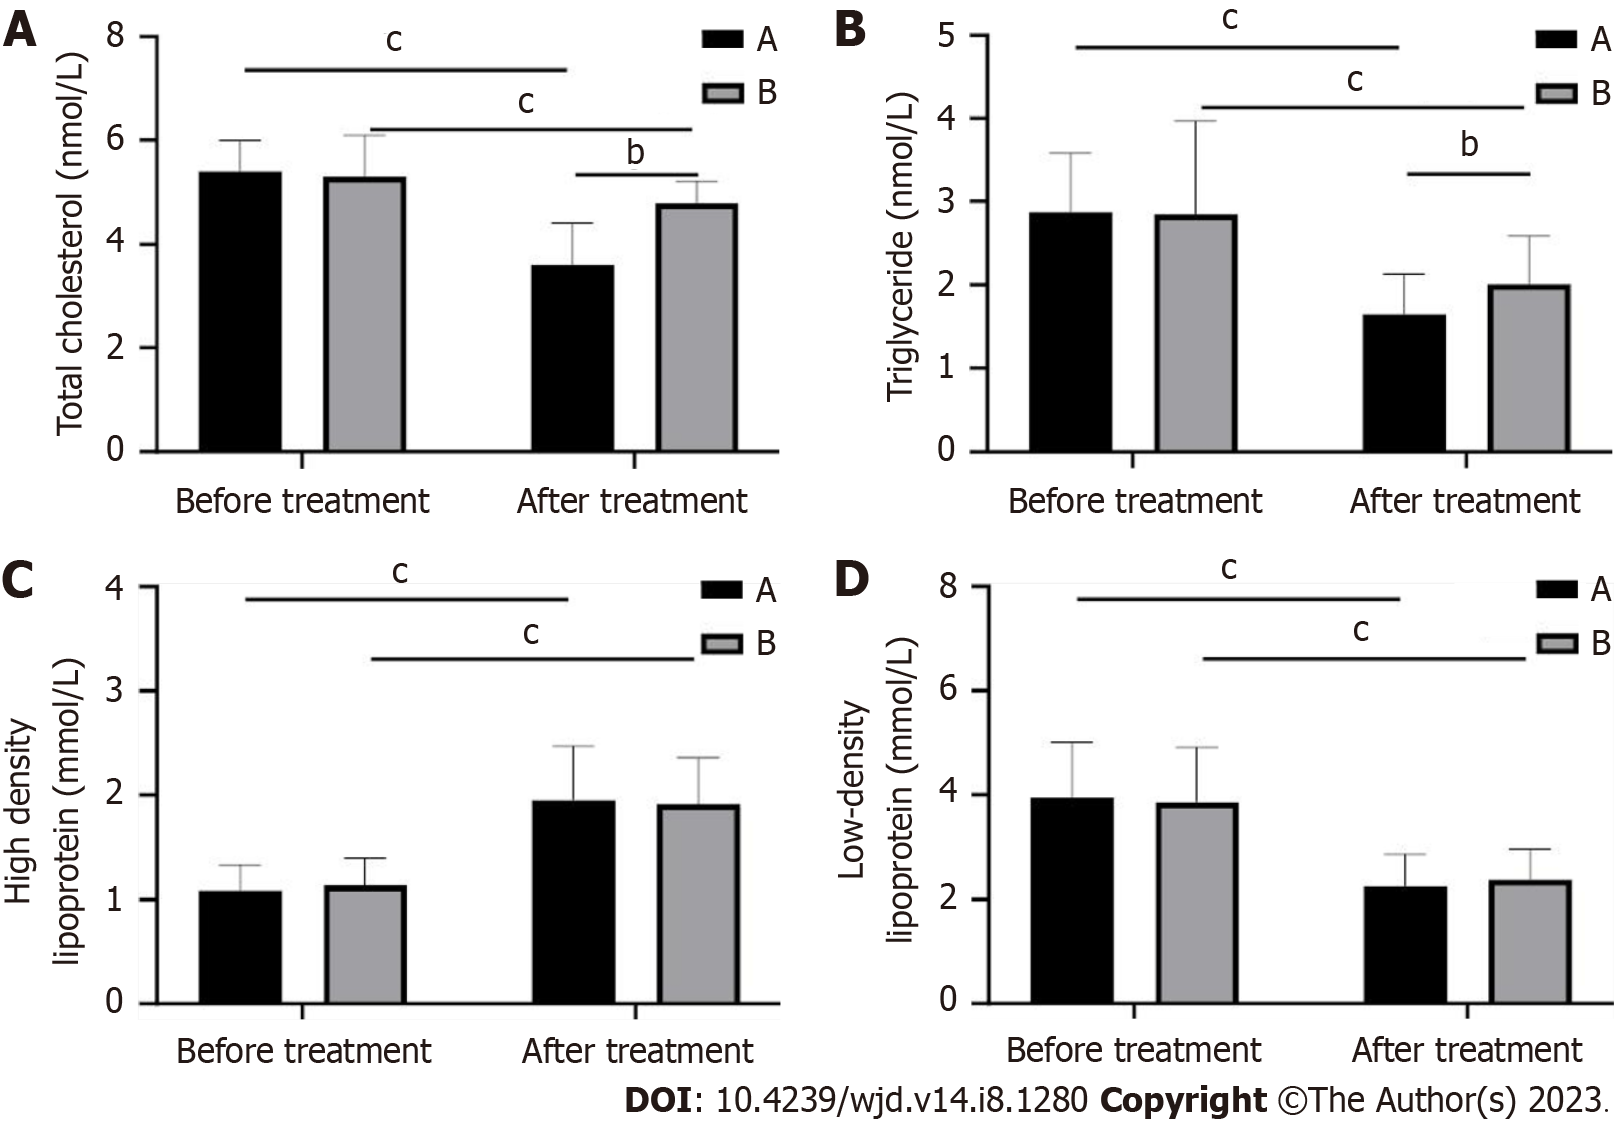
Figure 3 Changes in patients’ blood lipid indexes before and after treatment in both groups.
A: Total cholesterol; B: Triglycerides; C: High-density lipoprotein; D: Low-density lipoprotein. bP < 0.01; cP < 0.001.
Figure 4 Changes in inflammatory factor levels in patients before and after treatment in the two groups.
A: Tumor necrosis factor-alpha (TNF-α); B: Interleukin-6 (IL-6); C: High-sensitivity C-reactive protein (hs-CRP). aP < 0.05; cP < 0.001.
- Citation: Huang XM, Zhong X, Du YJ, Guo YY, Pan TR. Effects of glucagon-like peptide-1 receptor agonists on glucose excursion and inflammation in overweight or obese type 2 diabetic patients. World J Diabetes 2023; 14(8): 1280-1288
- URL: https://www.wjgnet.com/1948-9358/full/v14/i8/1280.htm
- DOI: https://dx.doi.org/10.4239/wjd.v14.i8.1280


