Copyright
©The Author(s) 2016.
World J Meta-Anal. Apr 26, 2016; 4(2): 55-62
Published online Apr 26, 2016. doi: 10.13105/wjma.v4.i2.55
Published online Apr 26, 2016. doi: 10.13105/wjma.v4.i2.55
Figure 1 Search strategy for PubMed.
GGO: Ground-glass opacity.
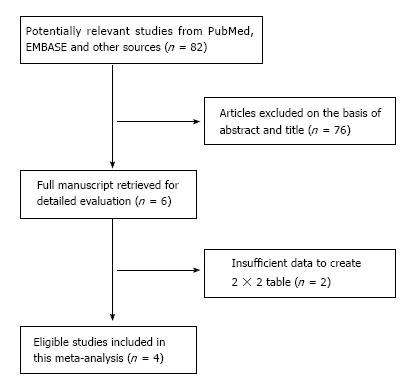
Figure 2 Flow chart of study selection.
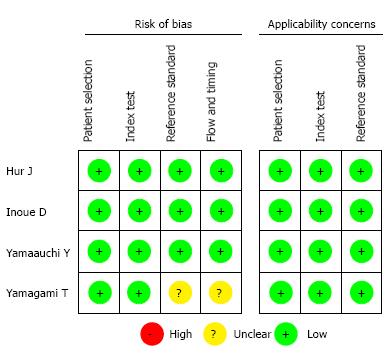
Figure 3 Quality assessment of diagnostic accuracy studies and criteria for included studies.
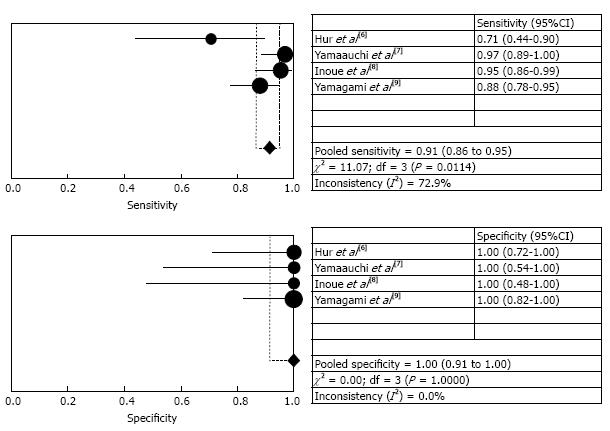
Figure 4 Forest plot shows sensitivity and specificity from individual studies and pooled estimates.
Summary sensitivity and specificity were 0.91 (95%CI: 0.86-0.95) and 1.0 (95%CI: 0.91-1.00), respectively.
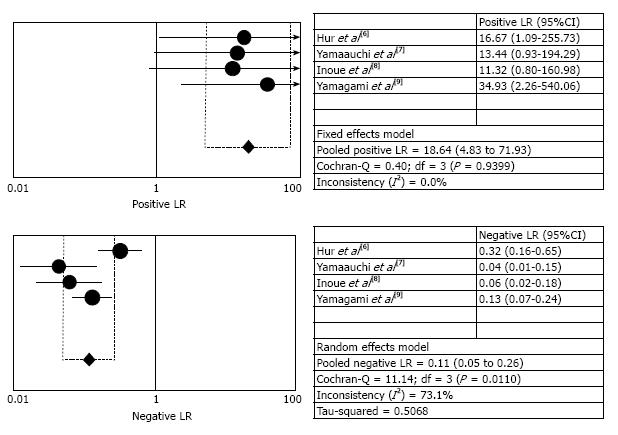
Figure 5 Forest plot shows positive likelihood ratio and negative likelihood ratio from individual studies and pooled estimates.
Summary positive likelihood ratio (LR) and negative LR were 18.64 (95%CI: 4.83-71.93) and 0.11 (95%CI: 0.05-0.26), respectively.
Figure 6 Forest plot shows diagnostic odds ratio from individual studies and pooled estimates.
Diagnostic odds ratio (OR) was 153.17 (95%CI: 30.78-762.33).
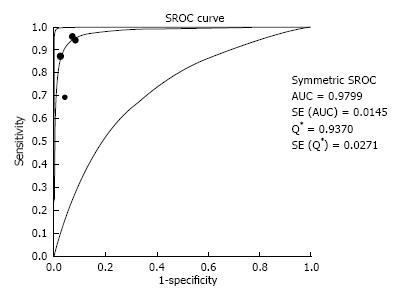
Figure 7 Summary receiver operating characteristic curve.
SROC: Summary receiver operating characteristic.
- Citation: Yan GW, Yan GW, Sun QQ, Niu XK, Li B, Bhetuwal A, Xu XX, Du Y, Yang HF. Computed tomography fluoroscopy guided percutaneous lung biopsy for ground-glass opacity pulmonary lesions: A meta-analysis. World J Meta-Anal 2016; 4(2): 55-62
- URL: https://www.wjgnet.com/2308-3840/full/v4/i2/55.htm
- DOI: https://dx.doi.org/10.13105/wjma.v4.i2.55


