Copyright
©2014 Baishideng Publishing Group Inc.
World J Meta-Anal. Nov 26, 2014; 2(4): 204-211
Published online Nov 26, 2014. doi: 10.13105/wjma.v2.i4.204
Published online Nov 26, 2014. doi: 10.13105/wjma.v2.i4.204
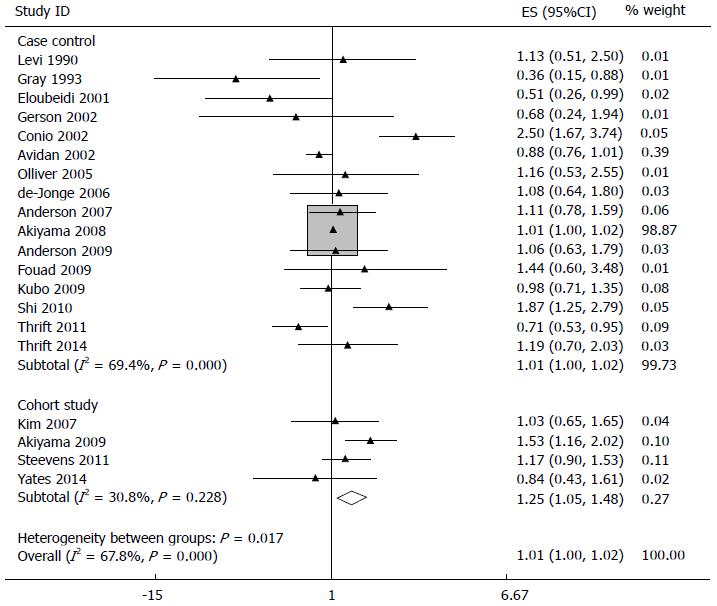
Figure 1 Forest plot of the prevalence of Barrett’s esophagus in alcohol consumption groups vs control groups and subgroup analysis by study type (case-control and cohort study).
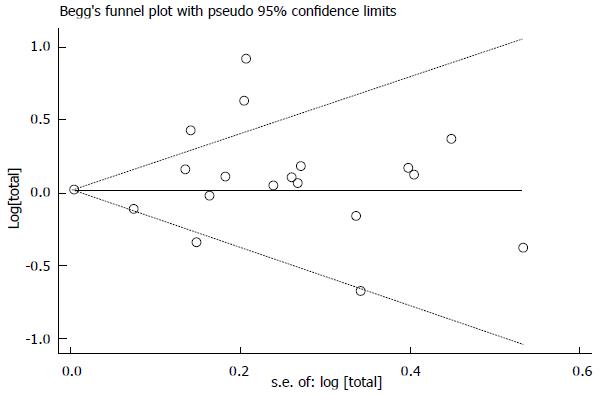
Figure 2 Begg’s funnel plot analysis of each study.
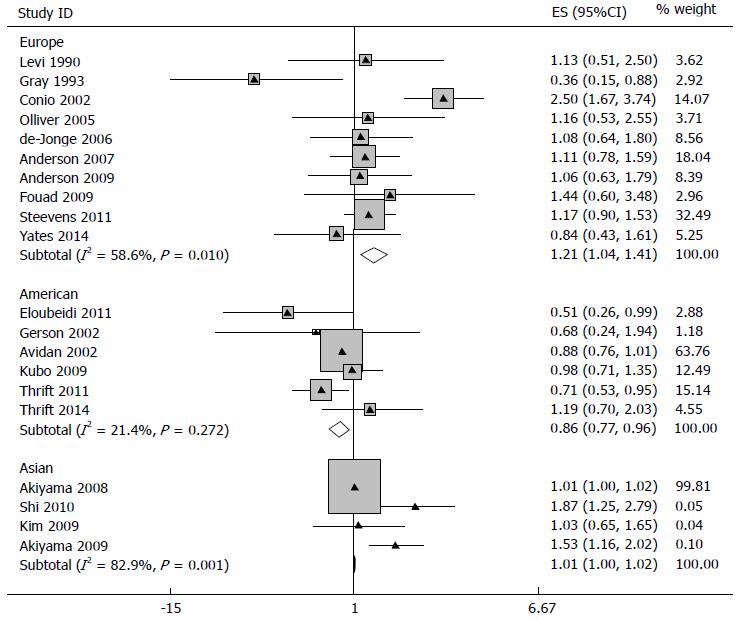
Figure 3 Forest plot of the prevalence of Barrett’s esophagus in alcohol consumption groups vs control groups in different geographical regions (Europe, America, Asia).
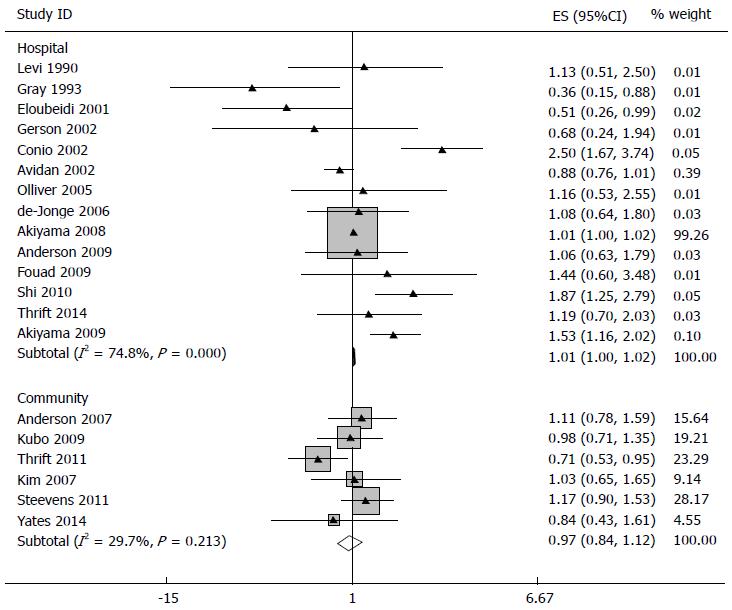
Figure 4 Forest plot of the prevalence of Barrett’s esophagus in alcohol consumption groups vs control groups from different sources (hospital, community).
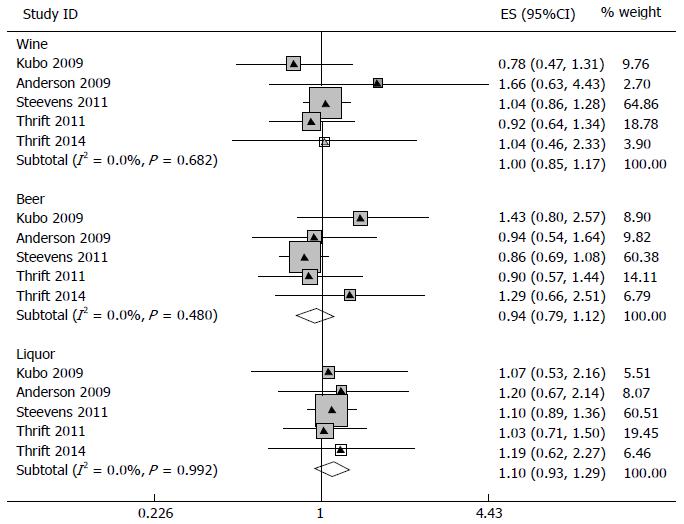
Figure 5 Forest plot of the prevalence of Barrett’s esophagus in alcohol consumption groups vs control groups in different type of alcohol (wine, beer and liquor).
- Citation: Dai C, Liu WX, Wang K, Jiang HK, Jiang M, Sun MJ. Alcohol consumption and the risk of Barrett’s esophagus: A meta-analysis. World J Meta-Anal 2014; 2(4): 204-211
- URL: https://www.wjgnet.com/2308-3840/full/v2/i4/204.htm
- DOI: https://dx.doi.org/10.13105/wjma.v2.i4.204


