Published online Feb 6, 2024. doi: 10.12998/wjcc.v12.i4.700
Peer-review started: December 1, 2023
First decision: December 7, 2023
Revised: December 14, 2023
Accepted: January 3, 2024
Article in press: January 3, 2024
Published online: February 6, 2024
Processing time: 54 Days and 18 Hours
Breast cancer (BC), a leading malignant disease, affects women all over the world. Cancer associated fibroblasts (CAFs) stimulate epithelial-mesenchymal transition, and induce chemoresistance and immunosuppression.
To establish a CAFs-associated prognostic signature to improve BC patient out
We retrieved the transcript profile and clinical data of 1072 BC samples from The Cancer Genome Atlas (TCGA) databases, and 3661 BC samples from the The Gene Expression Omnibus. CAFs and immune cell infiltrations were quantified using CIBERSORT algorithm. CAF-associated gene identification was done by weighted gene co-expression network analysis. A CAF risk signature was established via univariate, least absolute shrinkage and selection operator regression, and mul
Employing an 8-gene (IL18, MYD88, GLIPR1, TNN, BHLHE41, DNAJB5, FKBP14, and XG) signature, we attemp
We introduced a newly-discovered CAFs-associated gene signature, which can be employed to estimate BC patient outcomes conveniently and accurately.
Core Tip: Breast cancer (BC), a leading malignant disease, affects women all over the world. Cancer associated fibroblasts (CAFs) stimulate epithelial-mesenchymal transition, and induce chemoresistance and immunosuppression. We introduced a newly-discovered CAFs-associated gene signature using IL18, MYD88, GLIPR1, TNN, BHLHE41, DNAJB5, FKBP14, and XG, which can be employed to estimate BC patient outcomes conveniently and accurately.
- Citation: Wu ZZ, Wei YJ, Li T, Zheng J, Liu YF, Han M. Identification and validation of a new prognostic signature based on cancer-associated fibroblast-driven genes in breast cancer. World J Clin Cases 2024; 12(4): 700-720
- URL: https://www.wjgnet.com/2307-8960/full/v12/i4/700.htm
- DOI: https://dx.doi.org/10.12998/wjcc.v12.i4.700
Breast cancer (BC) is responsible for the most cancer-related deaths in women all over the world[1]. The Prediction Analysis of Microarray 50 (PAM50) classifies BC into five categories, namely, luminal A, luminal B, Her2-enriched, normal-like, and basal-like BC[2]. Despite this, patients with the same molecular and clinical signatures can exhibit vastly different outcomes as well as responses to chemotherapy and immunotherapy[3], suggesting the presence of unknown mediators that influence both the cancer prognosis and therapeutic response. Classical assessments such as those involving tumor-node-metastasis (TNM) staging and pathology are subjective at best and are poor at predicting patient outcomes and therapeutic responses. Hence, it is critical to develop novel approaches that are able to accurately estimate BC patient overall survival (OS) and thus improve outcomes.
Tumor pathogenesis and progression are modulated by both the cancer cells themselves and the tumor microenvironment (TME)[4]. The tumor stroma plays a critical role in enhancing tumor aggressiveness by modulating the deposition of the extracellular matrix (ECM) as well as cellular metabolism[5]. Of all TME stromal cells, cancer-associated fibroblasts (CAFs) have been the most widely examined. CAFs make up a majority of the stroma and are essential for tumor invasion, angiogenesis, and ECM remodeling, promoting cell-cell associations and the release of pro-invasive factors[6-8]. STAT3 induces breast cancer growth via ANGPTL4, MMP13 and STC1 secretion by cancer associated fibroblasts[9]. Cancer-associated fibroblasts facilitate premetastatic niche formation through lncRNA SNHG5-mediated angiogenesis and vascular permeability in breast cancer[10]. High expression of TGF-a, PKMYT1 and decreased SFRP1 and SFRP2 in the fibroblasts were associated with disease recurrence, invasive disease or decreased survival[11]. Hence, it is critical to explore the physiological properties of CAFs and their potential as therapeutic targets in BC.
Weighted gene co-expression network analysis (WGCNA) is an extensive bioinformatics algorithm that incorporates highly expressed genes and their associates into several gene modules to examine their association with the phenotype of interest[12]. In the past, WGCNA was successfully applied to identify CAF indicators[13,14]. To date, there have been no reports on WGCNA-based analysis of CAFs and stromal invasion in BC. Here, we reported that a CAF subtype functions as an indicator of BC patient prognosis, and we identified CAF-associated genes with prognostic significance. We also report an eight-gene signature using CAF-associated genes that can accurately estimate both OS and therapeutic response in BC patients. Our findings may highlight a novel and robust prognostic indicator for the personalized therapy of BC patients.
RNA-seq data [log2 (FPKM+1)], mutation annotation format file, and corresponding clinical information of 1072 breast invasive carcinoma patients in the The Cancer Genome Atlas (TCGA) database were obtained using Xena (https://xenabrowser.net). The Ensemble Gene was transformed into gene symbols to retrieve transcripts via the annotation file (hg38, gencode.v22.annotation.gene.probemap) of the GENCODE database[15]. Overall, 1072 primary BC samples and 99 adjoining healthy breast tissues were obtained from the TCGA. Table 1 summarizes in detail the clinical data of these primary BC patients. OS is defined as the time from diagnosis to death from any cause.
| Variables | n | % |
| Age, yr | ||
| < 60 | 570 | 53.17 |
| ≥ 60 | 571 | 46.74 |
| NA | 1 | 0.09 |
| Pathologic-T | ||
| T1 | 274 | 25.56 |
| T2 | 621 | 57.93 |
| T3 | 133 | 12.41 |
| T4 | 40 | 3.73 |
| TX | 4 | 0.37 |
| Pathologic-N | ||
| N0 | 502 | 46.83 |
| N1 | 355 | 33.12 |
| N2 | 118 | 11.01 |
| N3 | 76 | 7.08 |
| NA | 21 | 1.96 |
| Pathologic-M | ||
| M0 | 896 | 83.58 |
| M1 | 22 | 2.05 |
| NA | 154 | 14.37 |
| Stage | ||
| Stage I | 176 | 16.41 |
| Stage II | 608 | 56.72 |
| Stage III | 246 | 22.95 |
| Stage IV | 20 | 1.87 |
| NA | 22 | 2.05 |
| PAM50 | ||
| Basal | 136 | 12.69 |
| Luminal-A | 413 | 38.53 |
| Luminal-B | 185 | 17.25 |
| Her2 | 66 | 6.16 |
| Normal | 22 | 2.05 |
| NA | 250 | 23.32 |
OS information was available for 1050 patients. The GSE96058, GSE18728, and GSE21653 datasets were downloaded from the The Gene Expression Omnibus (GEO) database (www.ncbi.nlm.gov/geo). The GSE96058 and GSE21653 datasets served as the validation cohorts.
The CAF-related gene expression signature (reference genomes) was downloaded from previous literature. This clearly separated CAFs into five subtypes[16]. Only the gene expression values greater than 1 were included. Supplemen
The Cell Type Identification by Estimating Relative Subsets of Known RNA Transcripts (CIBERSORT) algorithm was employed for the enrichment estimation of the five CAF and immune cell types for BC and normal samples from the TCGA dataset[17]. The ESTIMATE algorithm computed the BC patient stromal and immune scores using the bulk gene expression data[18]. Kruskal-Wallis tests were used to compare differences in CAF and immune cell proportions, as well as stromal and immune scores in different cancer stages and normal tissues.
Using univariate analysis, we assessed the association between the five CAF phenotypes and OS. The correlations between prognostic CAF subtype, stromal and immune scores were computed via Pearson’s correlation coefficients.
The WGCNA package was employed to construct the weighted gene co-expression network (WGCN)[12] in R software, based on mRNA expression profiling. Hierarchical clustering was used to obtain modules, with each module harboring a minimum of 30 genes (min Module Size = 30). We computed the eigengenes, clustered the modules based on hierarchy, and combined comparable modules (abline = 0.25). Pearson’s correlation coefficients were calculated to assess the relationship between the modules and patient clinical signatures. The gene significance (GS) was described as the log10 transformation of the matched P value (GS = lg P) of the association between the gene levels and matched clinical data. To further evaluate this module, the module eigengenes (ME) dissimilarity was computed via the module Eigengenes fun
Gene ontology (GO), including cellular component, biological process, and molecular function (MF), and Kyoto Encyclopedia of Genes and Genomes (KEGG) network enrichment analyses were conducted on CAF-related gene hub genes and was visualized using the clusterProfile package[19] in the R software. Adjusted P < 0.05 was set as the significance threshold.
To build a prognosis-related signature, univariate analysis was employed to screen for OS-associated genes with P values < 0.05. Subsequently, the marked prognostic genes underwent filtration using least absolute shrinkage and selection ope
The Kaplan-Meier log-rank test and the time-dependent receiver operating characteristic (ROC) curve analysis were employed to confirm the eight-gene signature performance. The RS distribution and OS status scatter plots, as well as the expression heatmaps of the eight CAF-related risk genes between the HR and LR cohorts, were constructed to assess the prognostic signature, and the stand-alone prognostic analysis was performed to assess the independent nature of the signature in predicting OS.
To translate the prognostic significance of the eight-gene signature into clinical application, we established a nomogram involving the RS and matched clinical data of BC patients, which included age and pathological stage. In addition, the calibration curves were generated to evaluate the agreement between the true and estimated OS.
To further confirm the predictability of CAFPS in estimating patient chemotherapeutic response, GSE18728 was em
Furthermore, the “h.all.v7.4. symbols” gene sets were derived from the Molecular Signatures Database (MSigDB)[20]. The ssGSEA was employed to compute the hallmark gene set enrichment scores[21]. Spearman correlation analysis was used to assess the relationships between the CAFPS and gene set enrichment scores.
All 80 breast cancer tissues and paired adjacent normal tissues were obtained from patients treated at the first hospital of qinhuangdao between January 2022 and December 2022. The paired adjacent normal tissues were dissected by the surgeons 5-cm away from the tumor edge. Tissue samples were stored at liquid nitrogen until total RNA was extracted. This study was approved by the Ethics Committee of the first hospital of qinhuangdao, and the informed consent forms were obtained from all the patients.
Total RNA was isolated from the BC and matched adjacent tissues using TRIzol (Thermo Fisher Scientific). The Nanodrop 2000 (Thermo Fisher Scientific) was used to detect the purity and concentration of the total RNA. According to the manufacturer's protocol, quantitative real-time polymerase chain reaction (qRT-PCR) was performed by using Taq Pro universal SYBR qPCR Master Mix (Vazyme, Nanjing, China).The primers used were as follows: FKBP14 forward primer 5'-AGCTGATCAACATCGGCAAT-3' and reverse primer 5'- CCAAGAACCCCCATTATTGA -3', βactin forward primer 5'CATGTACGTTGCTATCCAGGC3' and reverse primer 5'CTCCTTAATGTCACGCACGAT-3'. The relative levels of FKBP14 was evaluated by the 2-ΔΔCT method using βactin as the control.
All data analyses were performed in R version 3.6.4 (https://www.r-project.org) and associated packages. The Wilcoxon test was used to examine the CAFPS-clinicopathological properties link. Kaplan-Meier curves and log-rank tests were used for evaluating OS using the survival and survminer R packages.
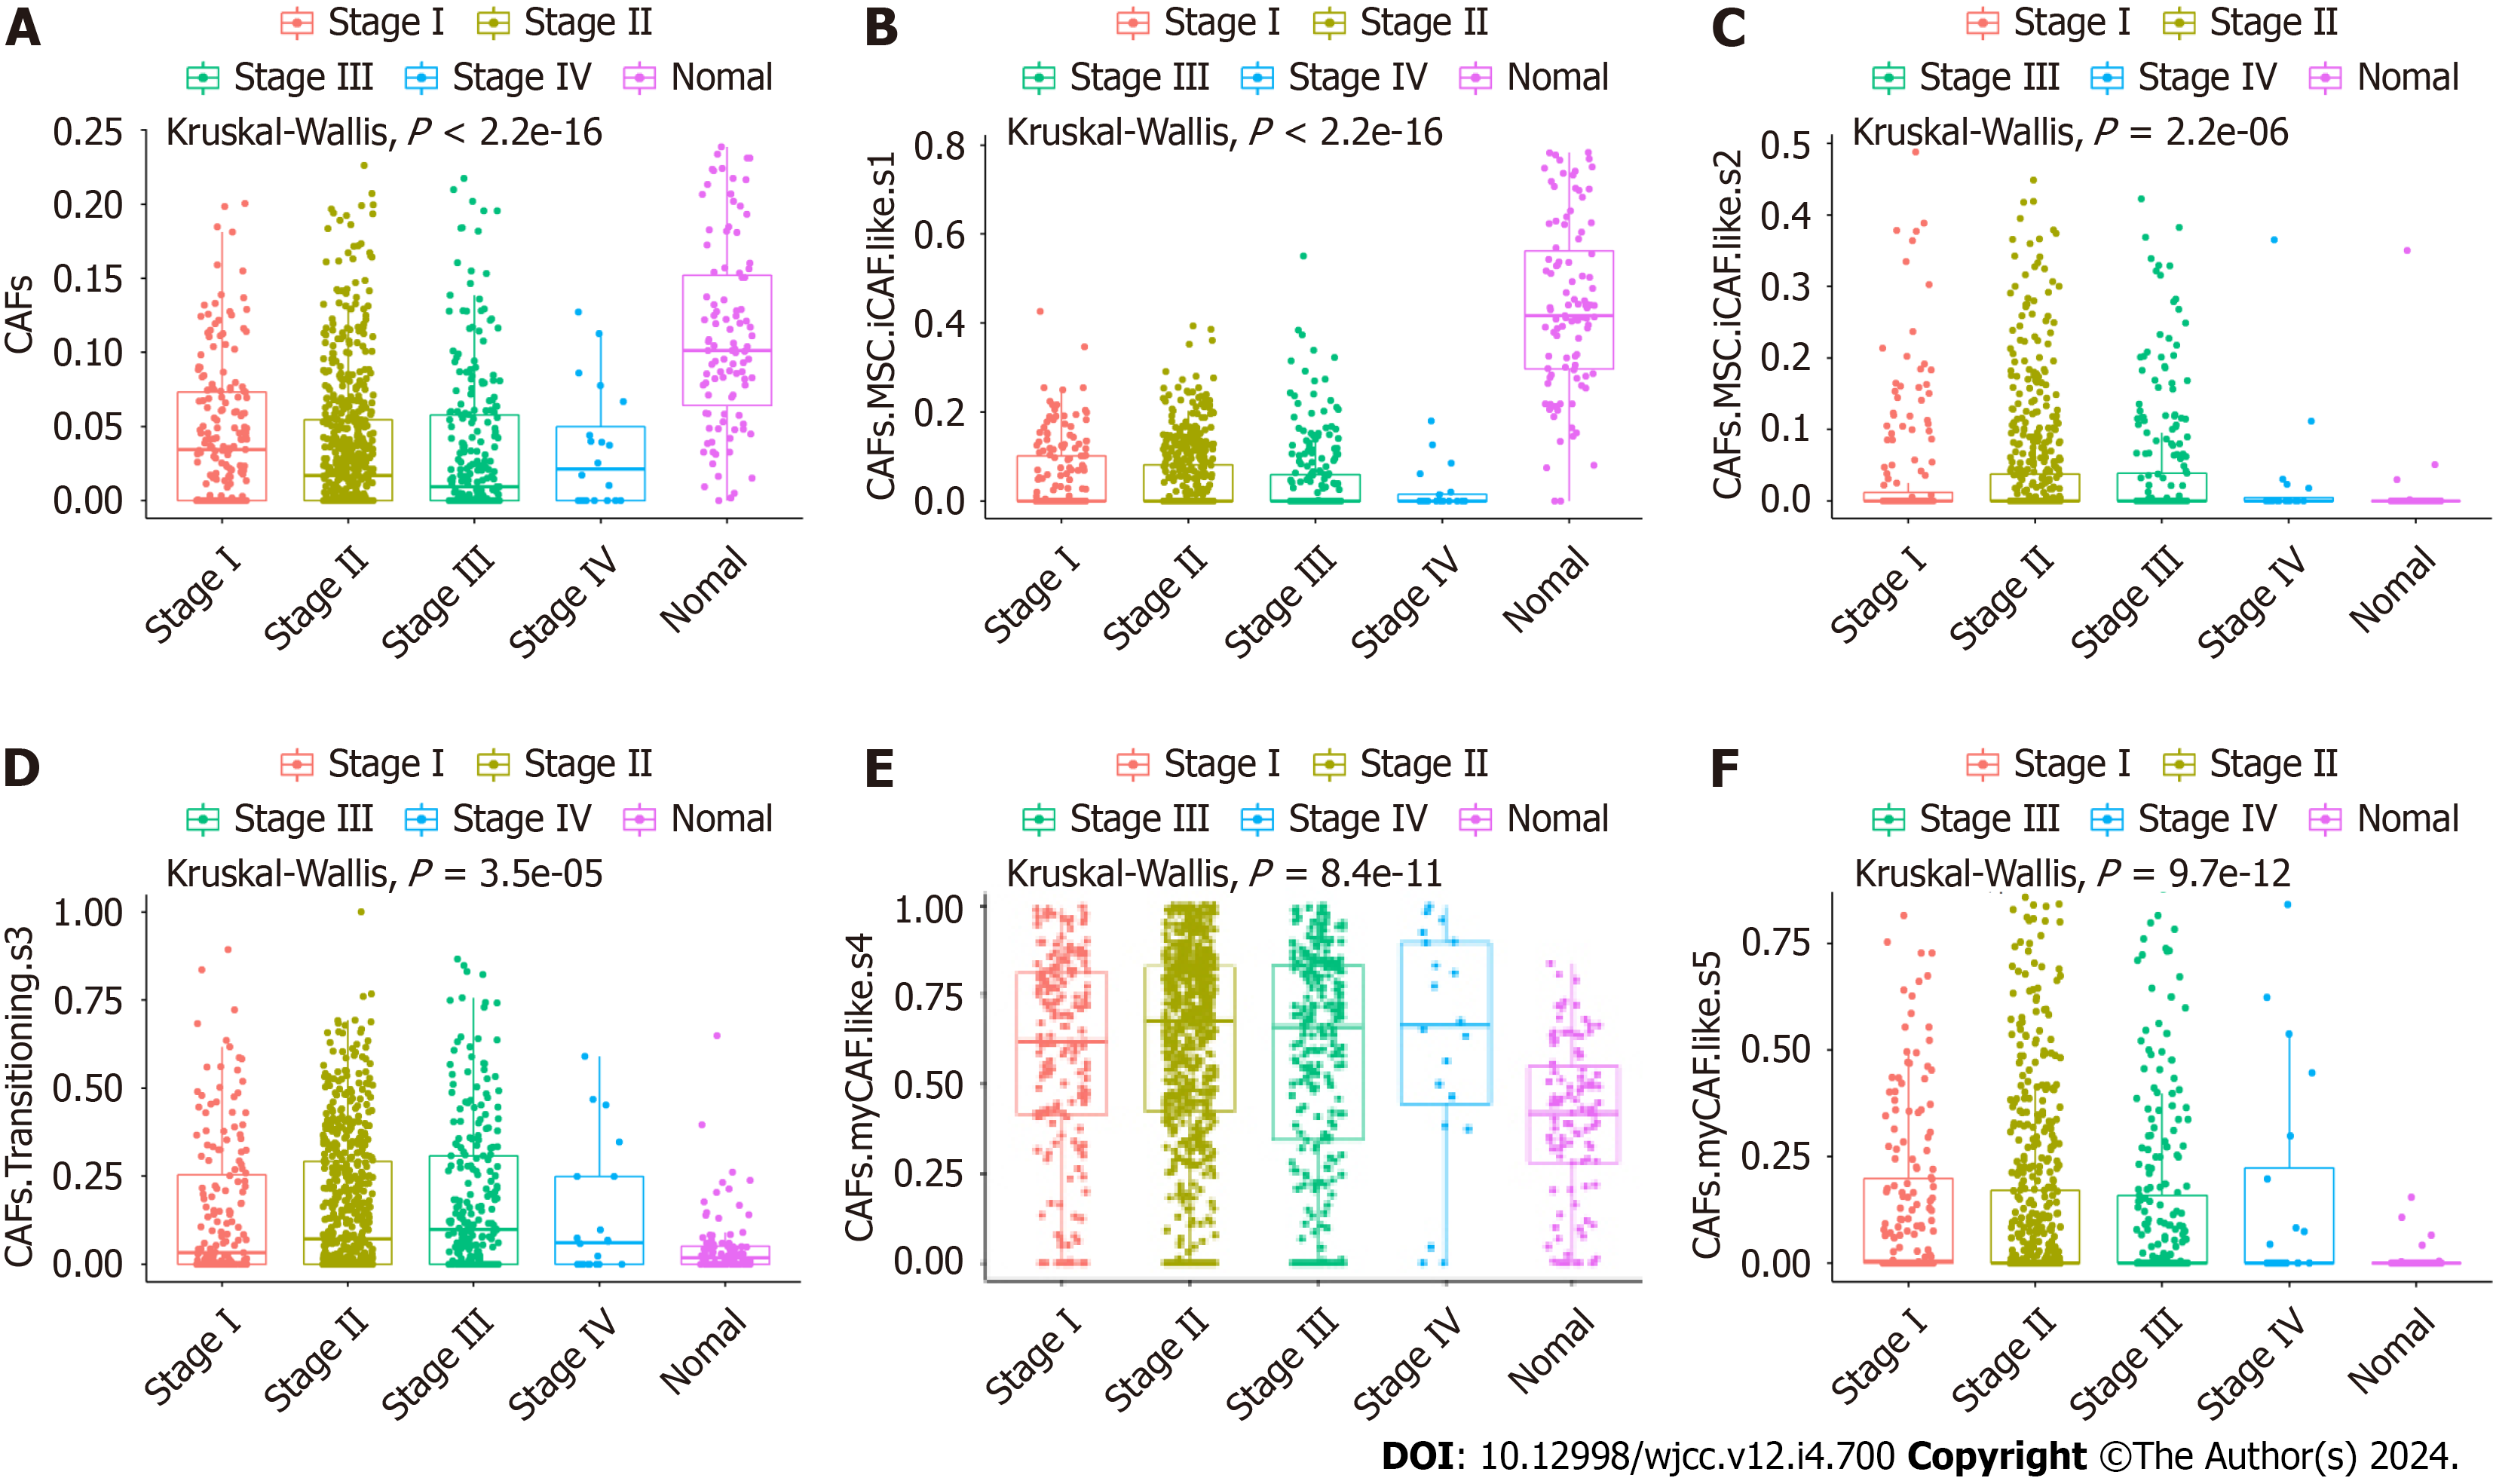
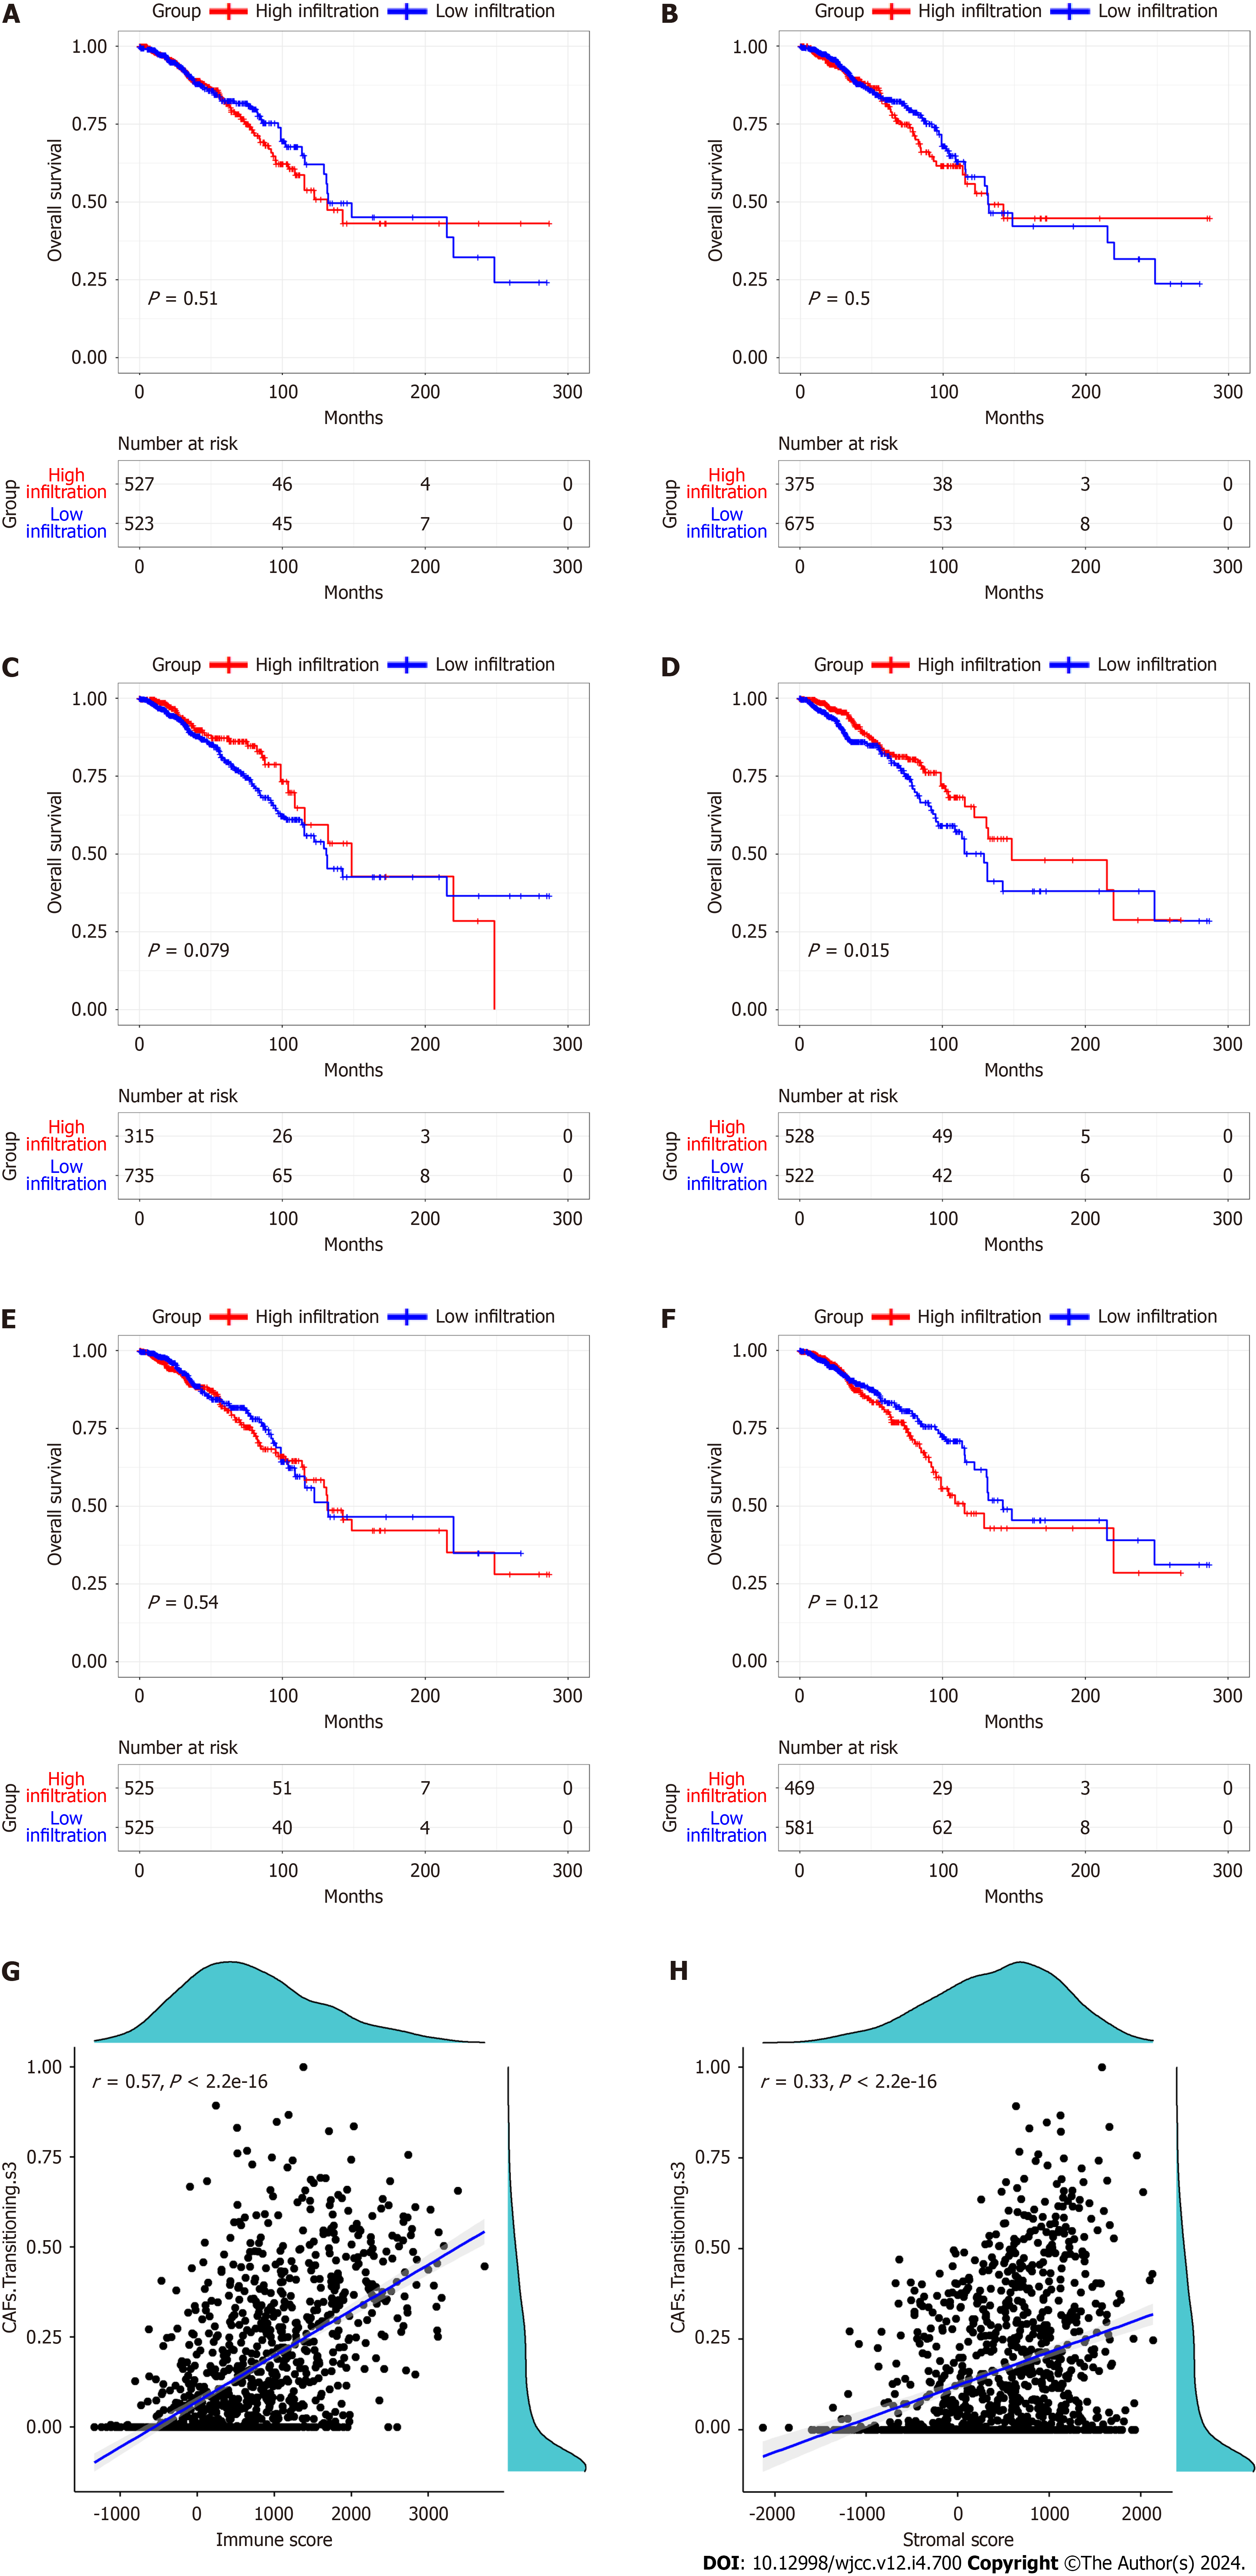
The proportions of five CAF and immune cell types in BC and normal samples from the TCGA database were obtained using the CIBERSORT algorithm. We observed marked differences in the proportions of the five types of CAFs (Figure 1), CD4 memory resting T cells, CD4 memory activated T cells, regulatory T cells, resting natural killer (NK) cells, and the stromal score between different cancer stages and normal tissues (Supplementary Figure 1). Based on the median value of the CAF proportion, patients were divided into high and low CAF groups. The prognosis of patients in different groups was compared (Figure 2A-F). Patients with lower proportions of the CAF S3 subset were found to have better OS (P = 0.015; Figure 2D). Figure 2G and H illustrates a positive correlation between the CAF-S3 proportion and the immune (r = 0.57, P < 2.2e-16) and stromal scores (r = 0.33, P < 2.2e-16).
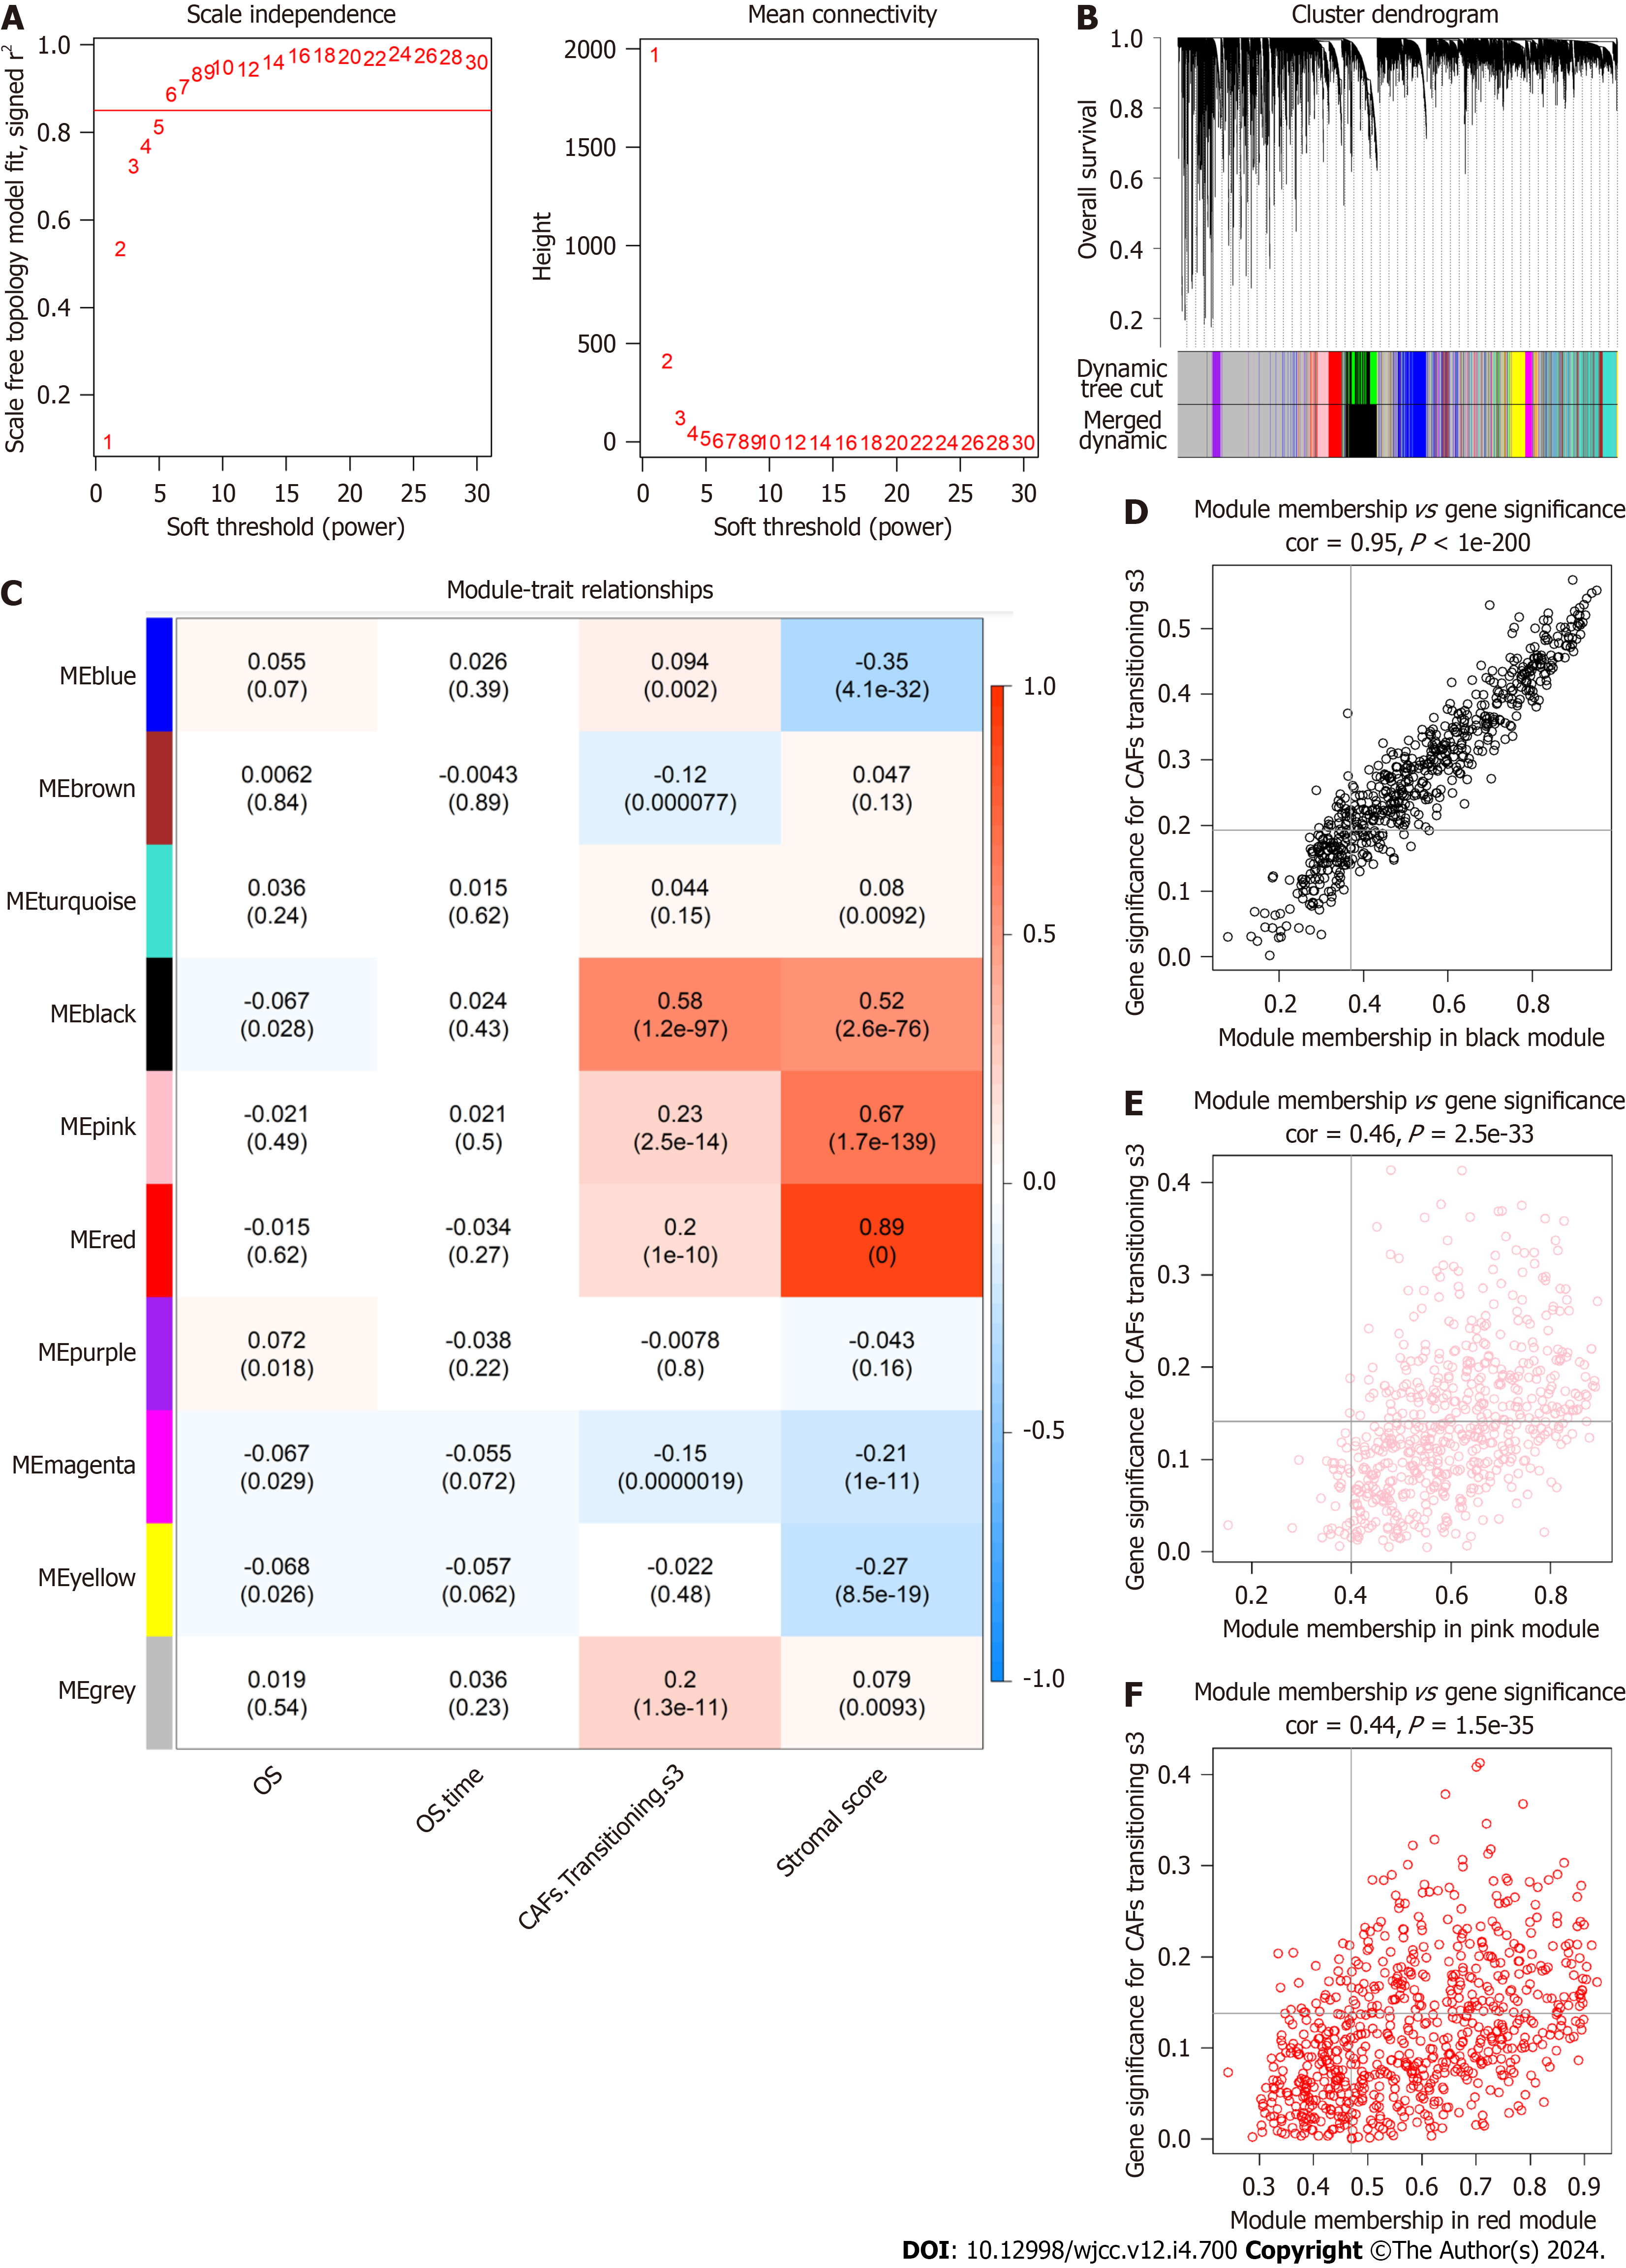
To better represent the scale-free topology of the co-expression axis in the WGCNA, we chose the soft-threshold β = 6 (Figure 3A). Ten co-expressed gene modules were clustered (Figure 3B), of which the black, pink, and red modules seen in Figure 3C were most relevant to CAF-S3 cells (Figure 3C). Of these, 921 genes [the black module (427 genes), pink module (255 genes), and red module (239 genes)] were selected as hub CAF-related genes (Figure 3D-F).
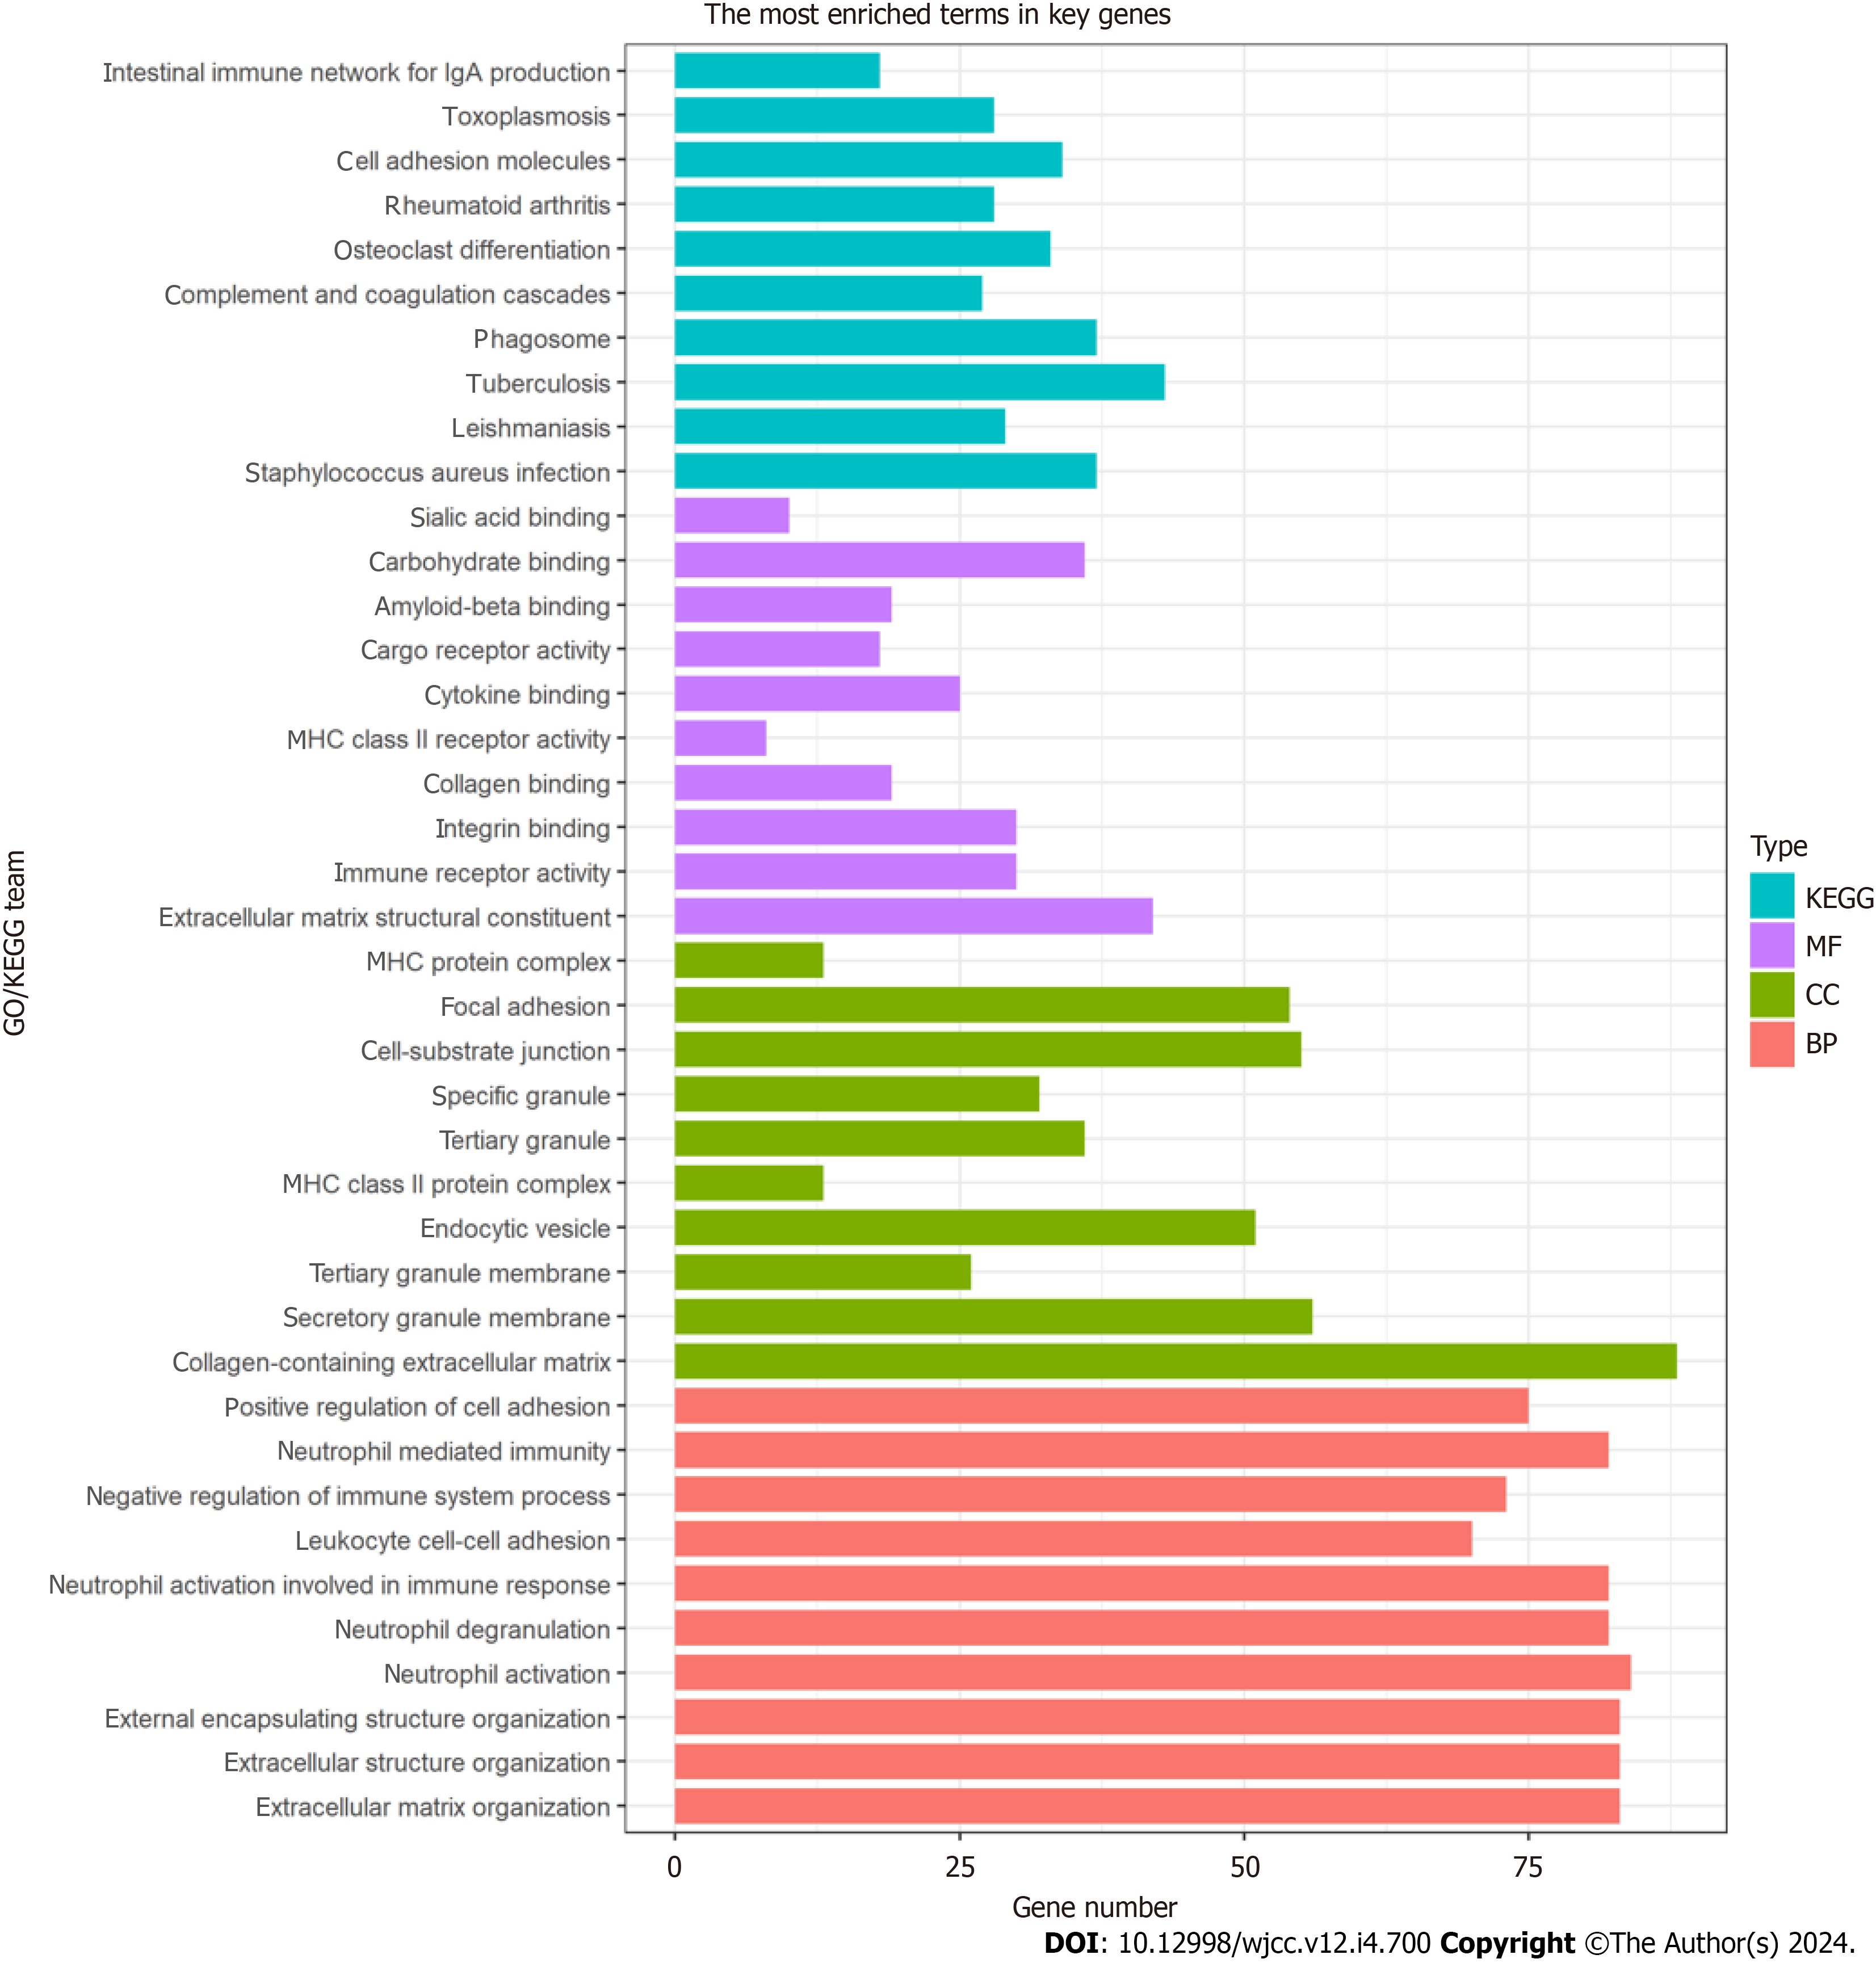
GO analysis showed that CAFrelated genes were mainly enriched in biological processes related to the ECM and cell adhesion, including focal adhesion, positive regulation of cell adhesion, extracellular structure organization, and ECM organization (Figure 4). KEGG pathway analysis indicated marked enrichment of the genes in pathways associated with cell adhesion (Figure 4).
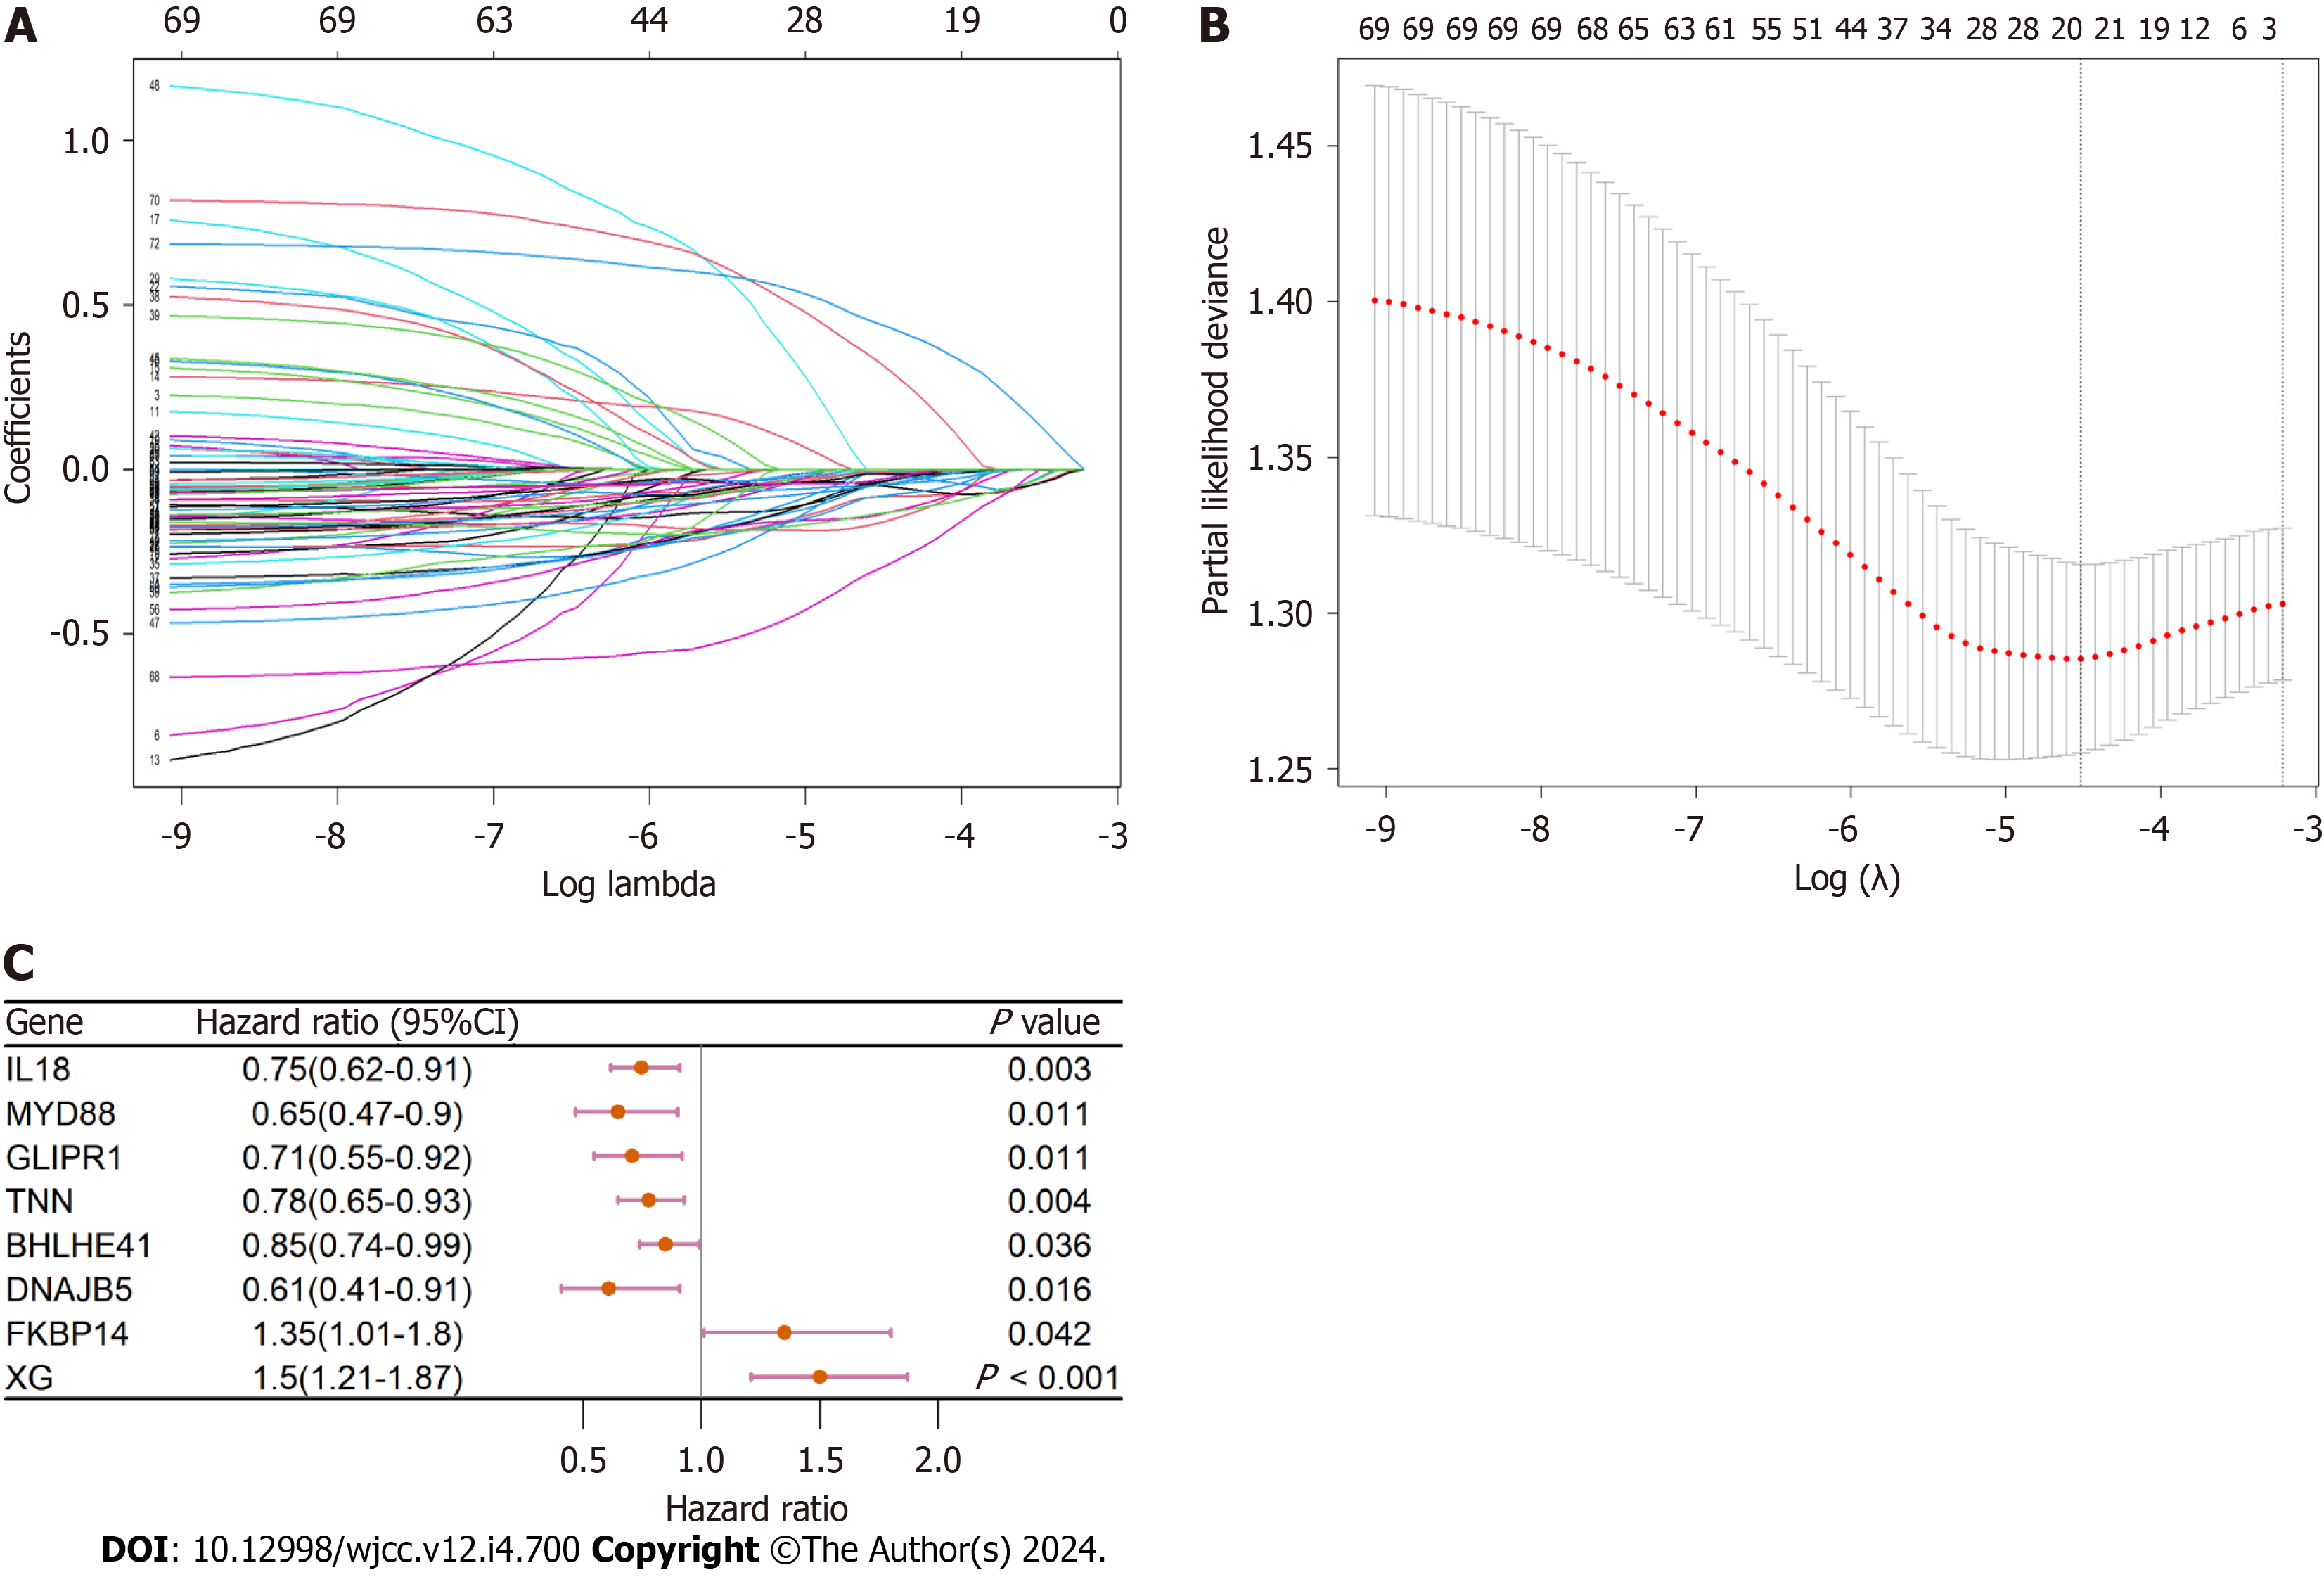
Only gene expression values greater than 1 were included in this analysis. Univariate analysis showed that 72 CAF-related genes were strongly associated with OS. Further LASSO and multivariate analyses showed that eight CAF-associated genes (IL18, MYD88, GLIPR1, TNN, BHLHE41, DNAJB5, FKBP14, and XG) were independent prognostic factors of BC patient OS (Figure 5A-C).
A risk score (RS) system was established using the expression levels of these eight genes and their corresponding coefficients obtained from the multivariate Cox regression analysis. We then calculated the RS using the formula: RS [CAF prognostic gene signature (CAFPS)] = (-0.168 × IL18 levels) + (-0.420 × MYD88 levels) + (-0.338 × GLIPR1 levels) + (-0.236 × TNN levels) +(-0.129 × BHLHE41 levels) + (-0.577 × DNAJB5 levels) + (0.695 × FKBP14 levels) + (0.573 × XG levels).
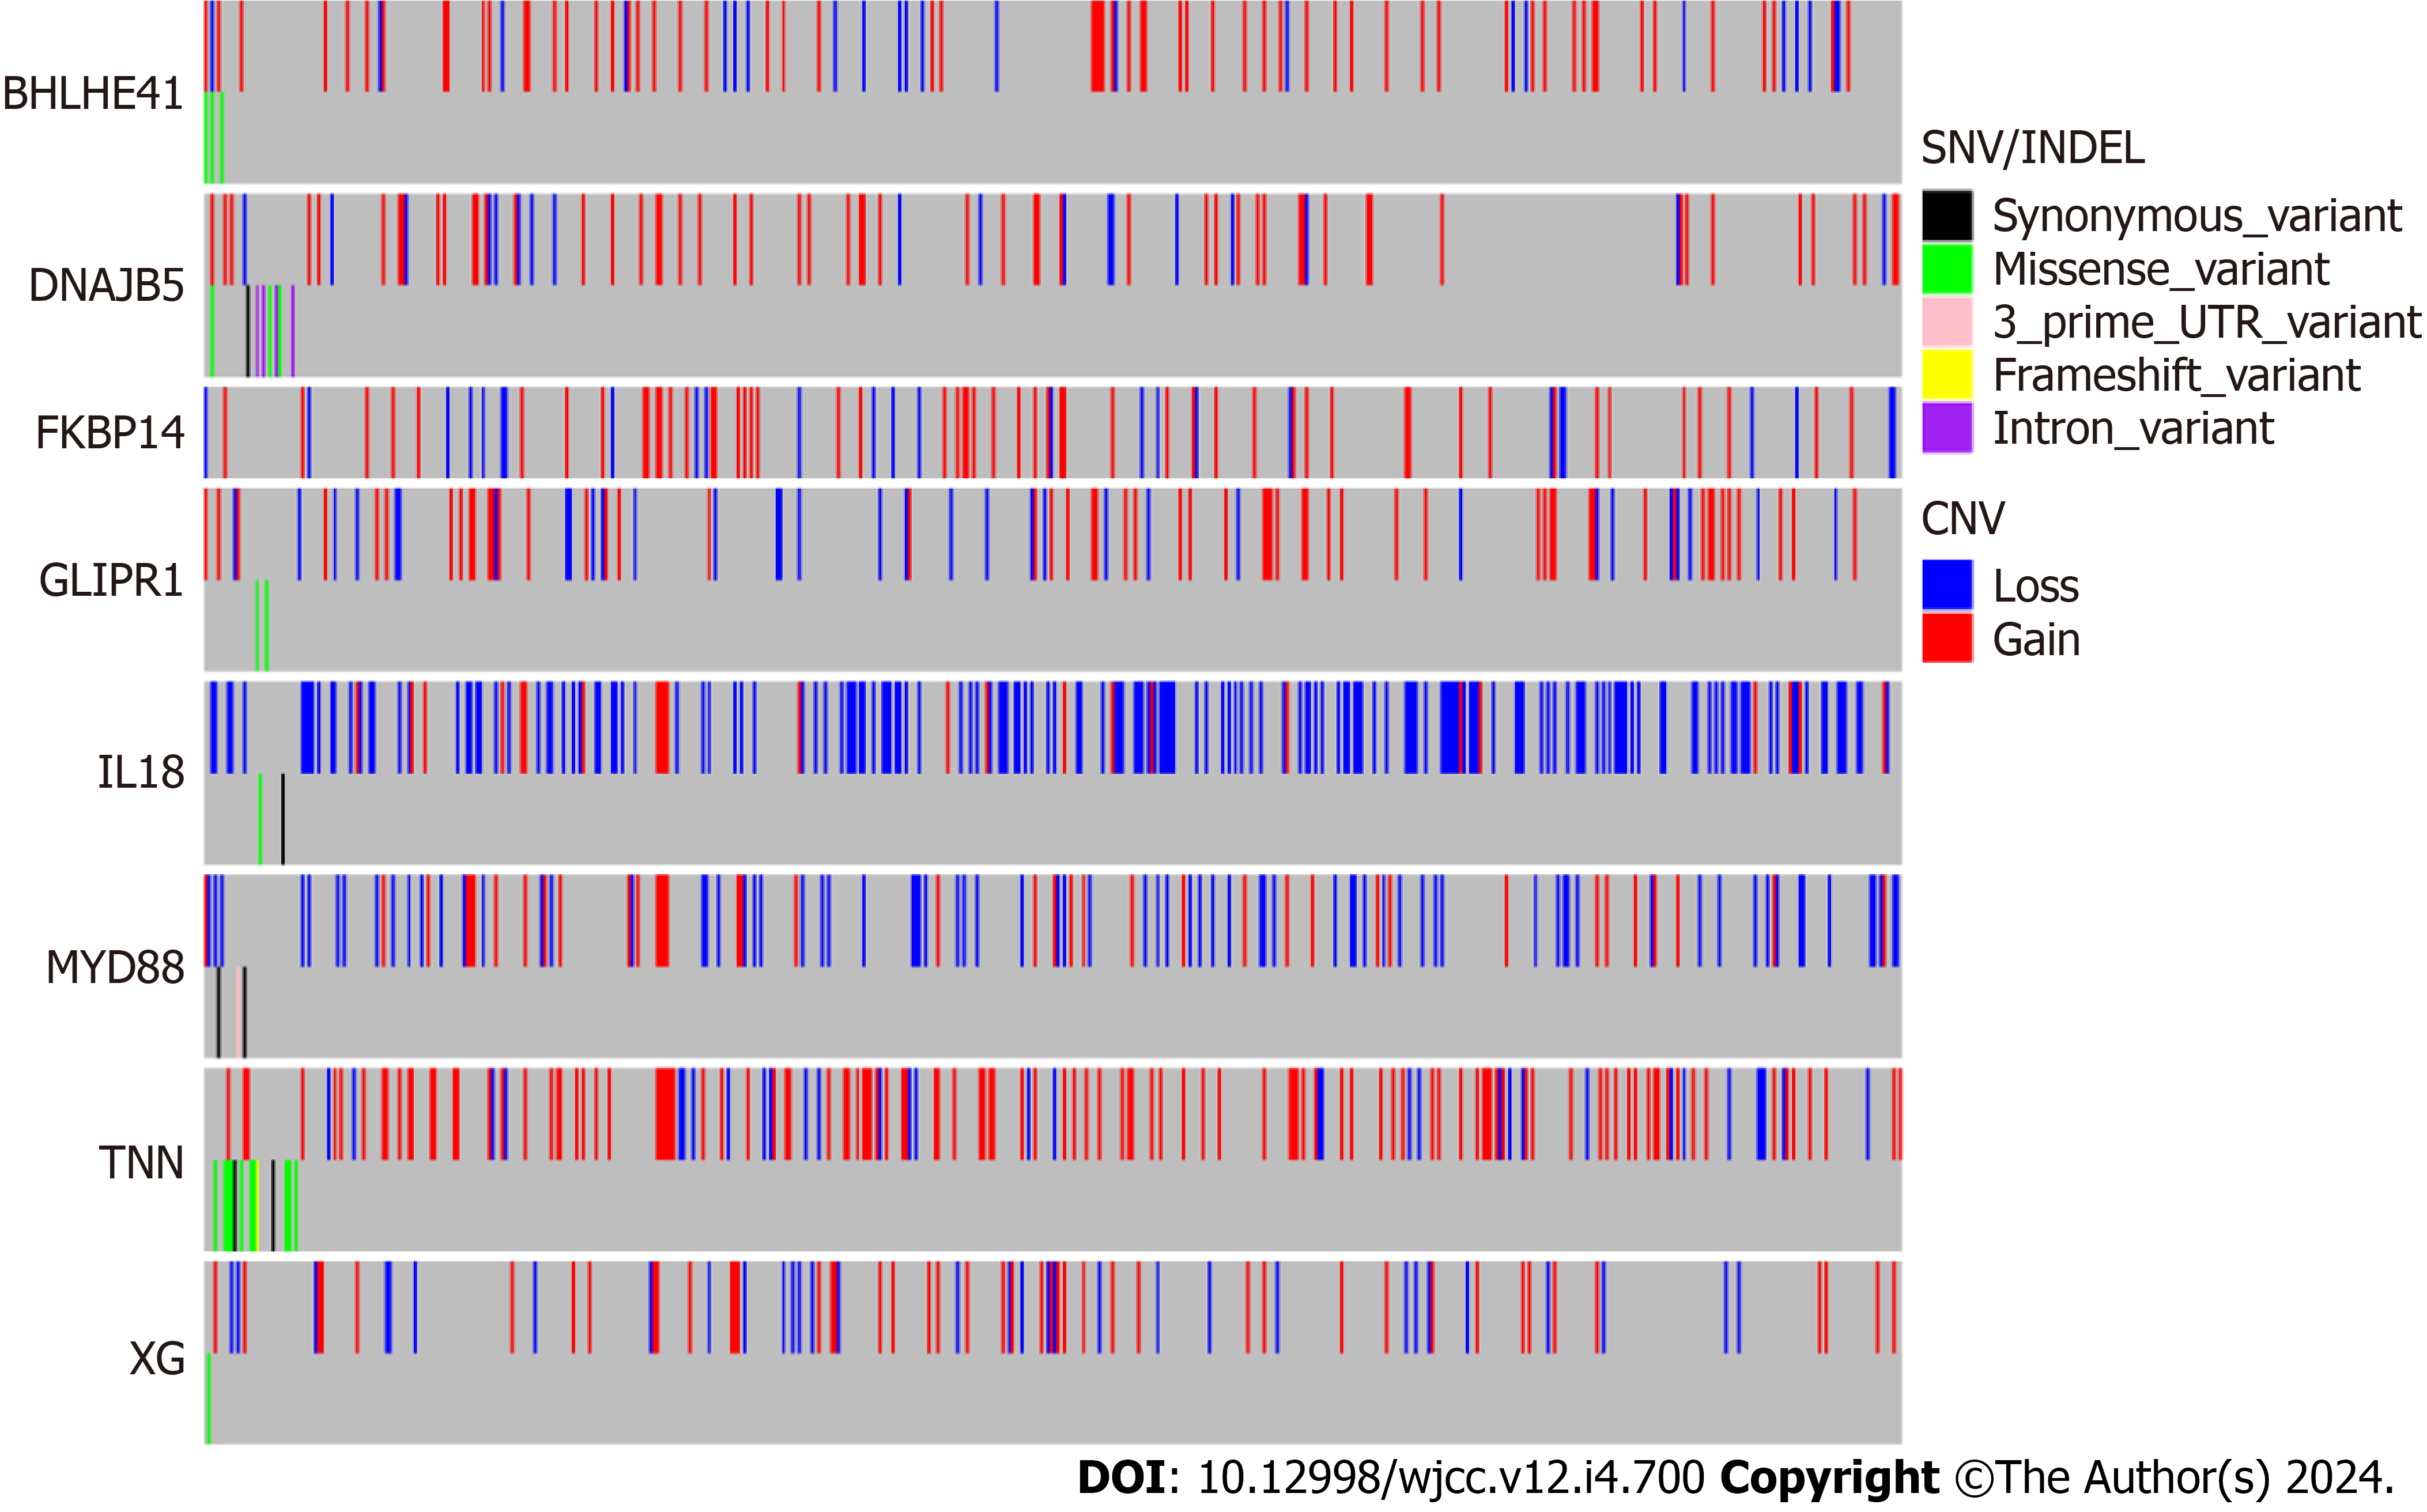
Genetic alterations in the biomarkers were assessed using data from the TCGA database. Most of the eight biomarkers exhibited high CNV frequencies in BC (IL18: 37.26%, MYD88: 22.05%, GLIPR1: 17.11%, TNN: 27.76%, BHLHE41: 16.16%, DNAJB5:14.07%, FKBP14: 15.21%, and XG: 14.83%; Figure 6).
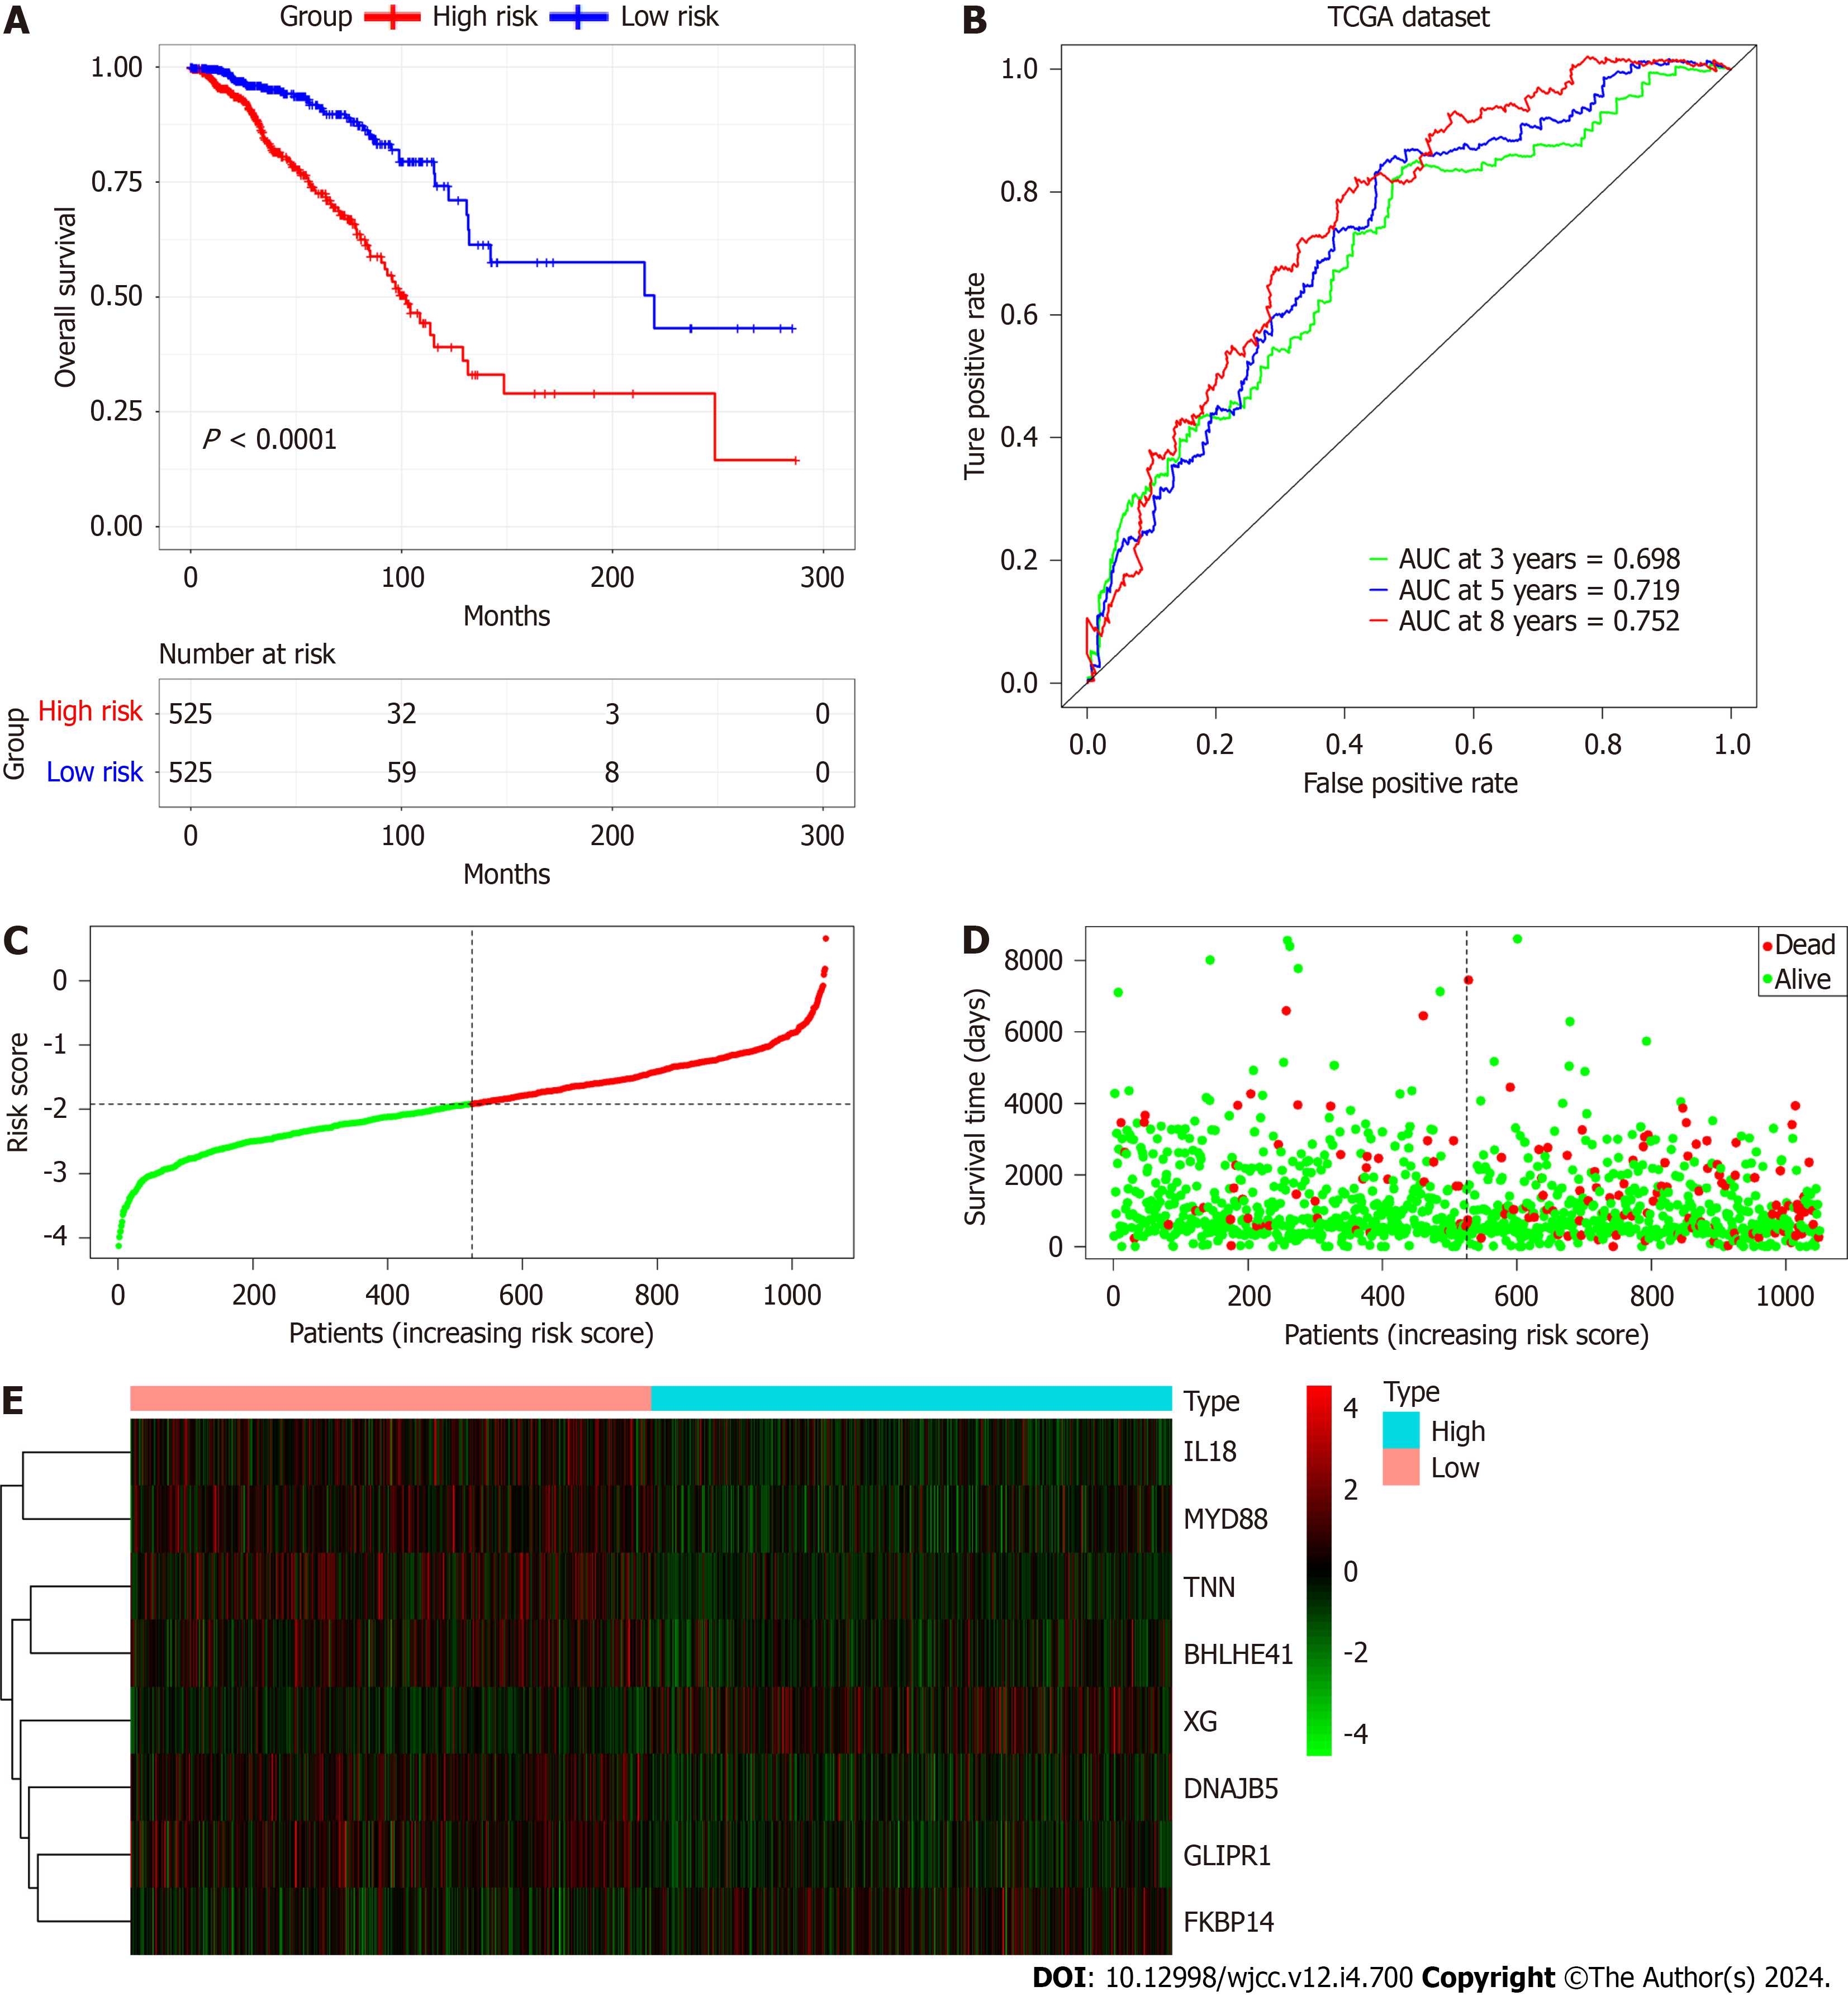
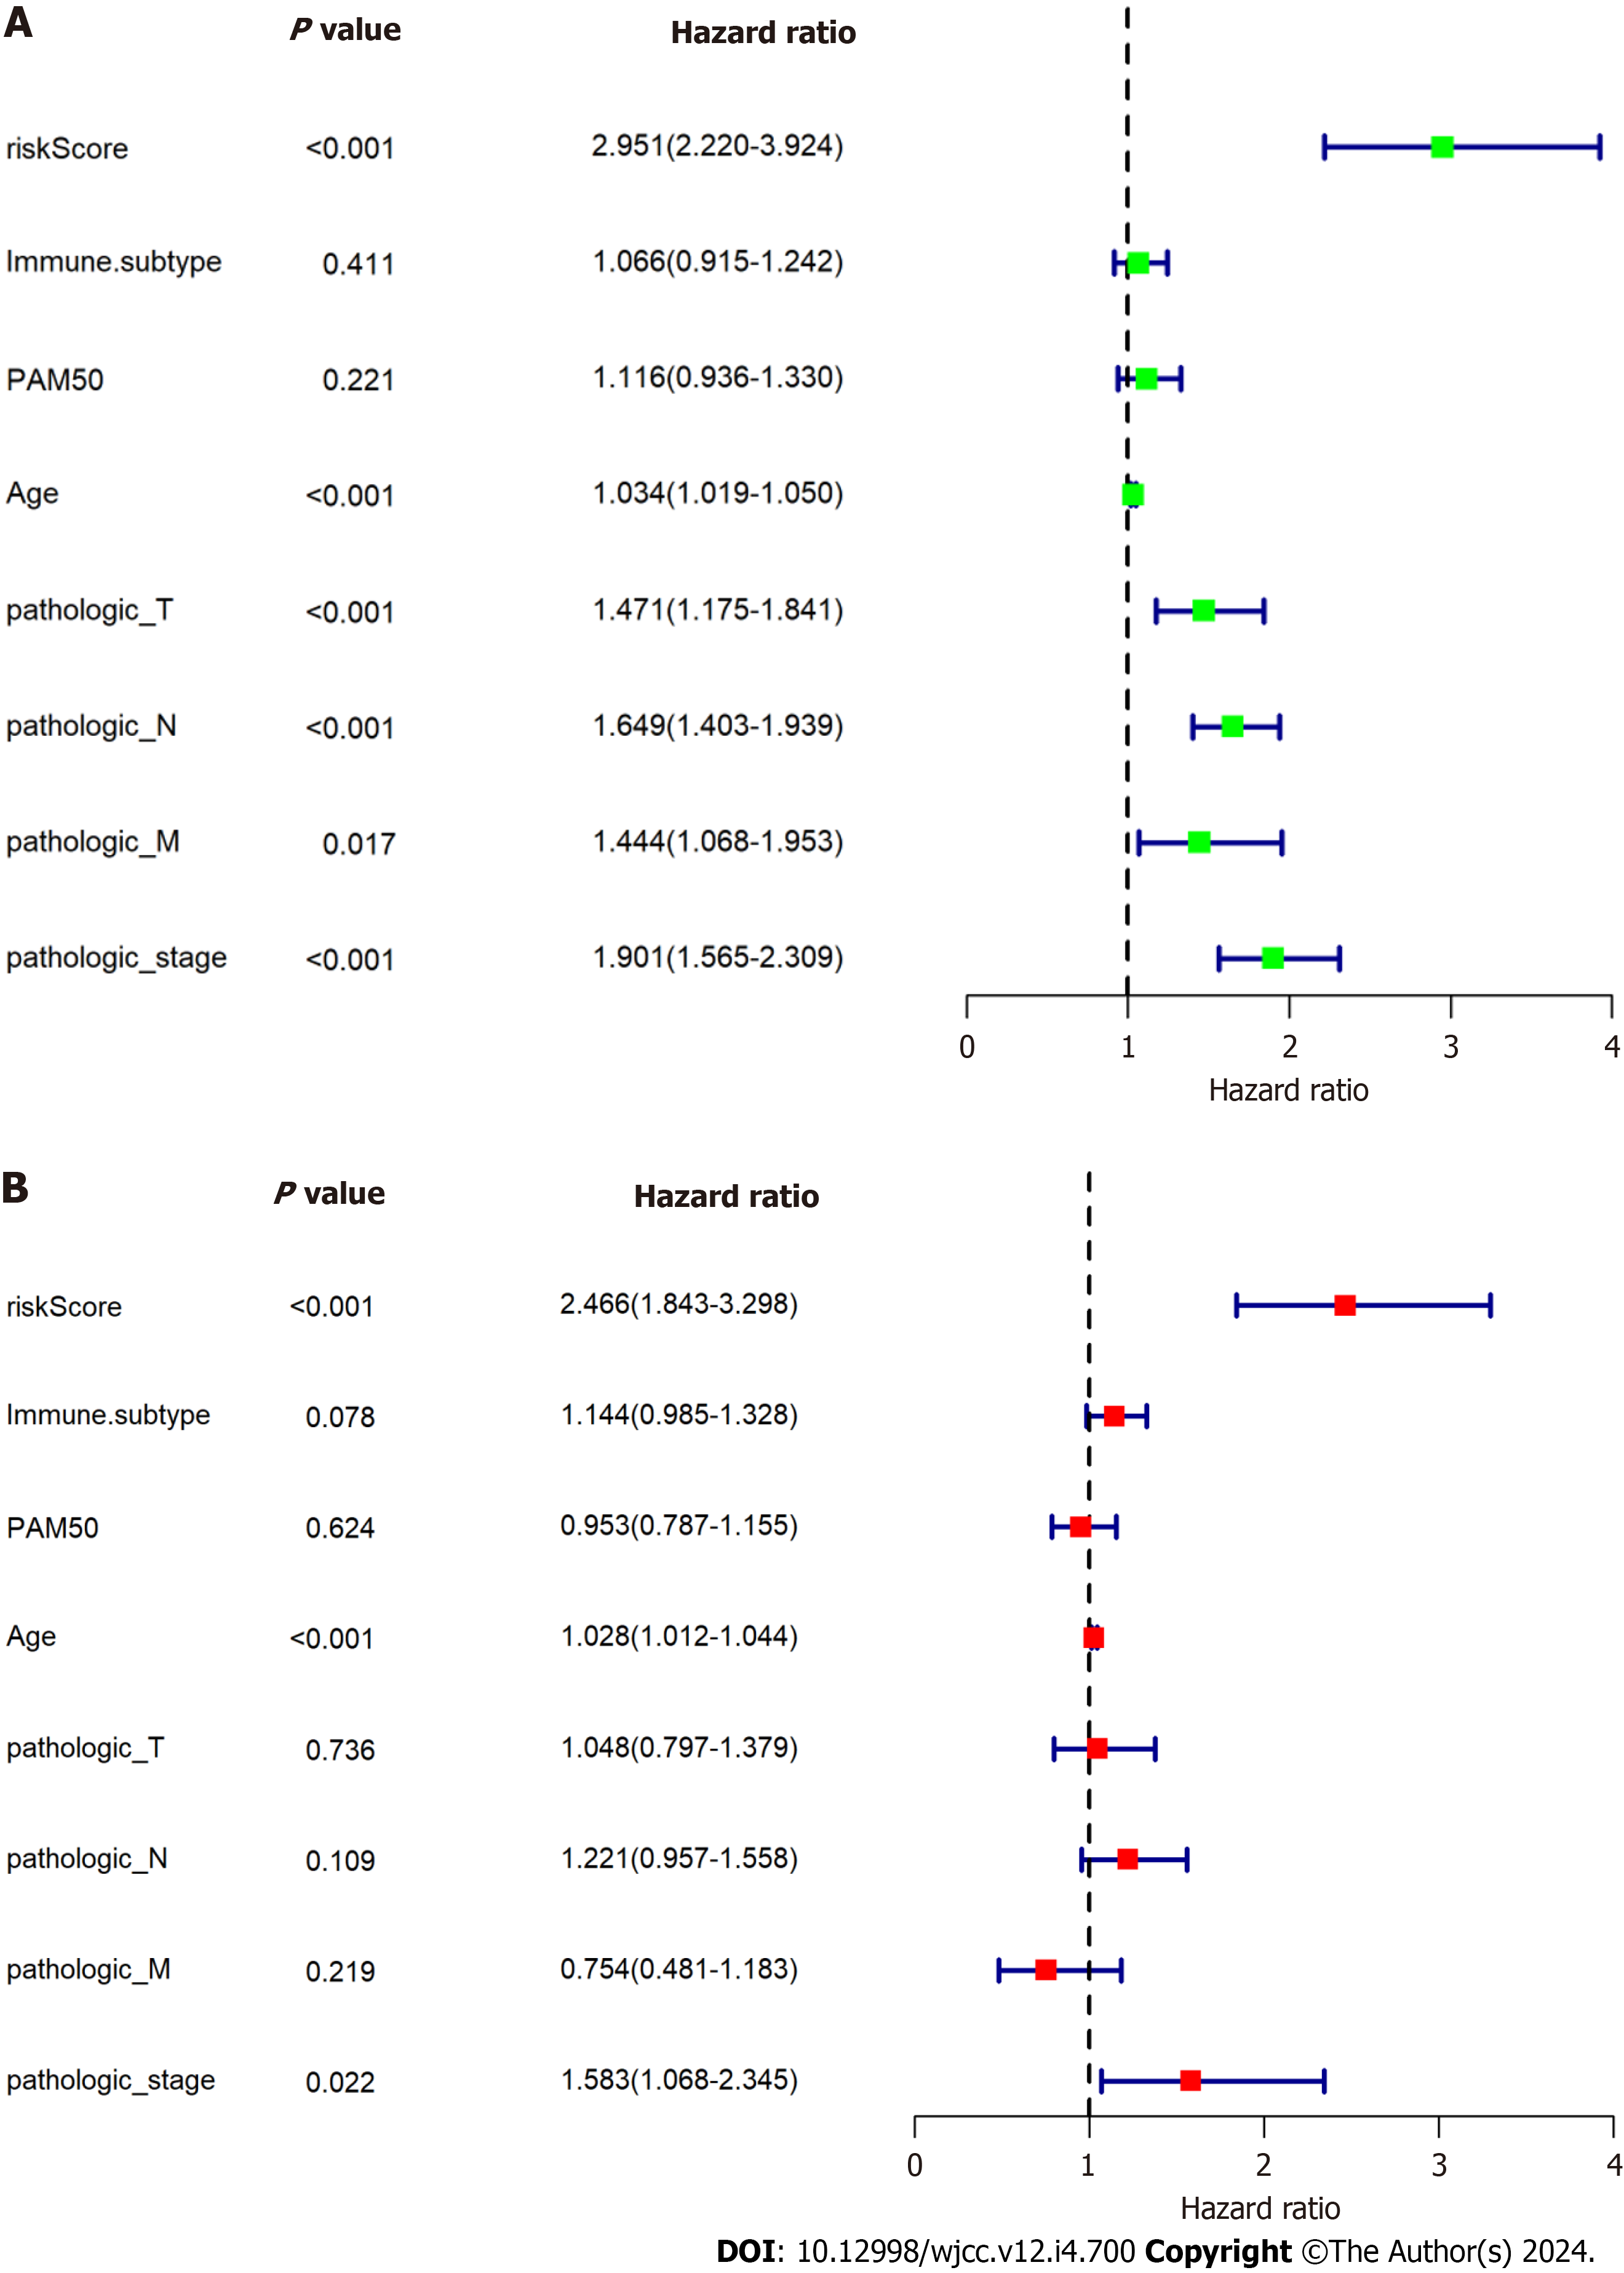
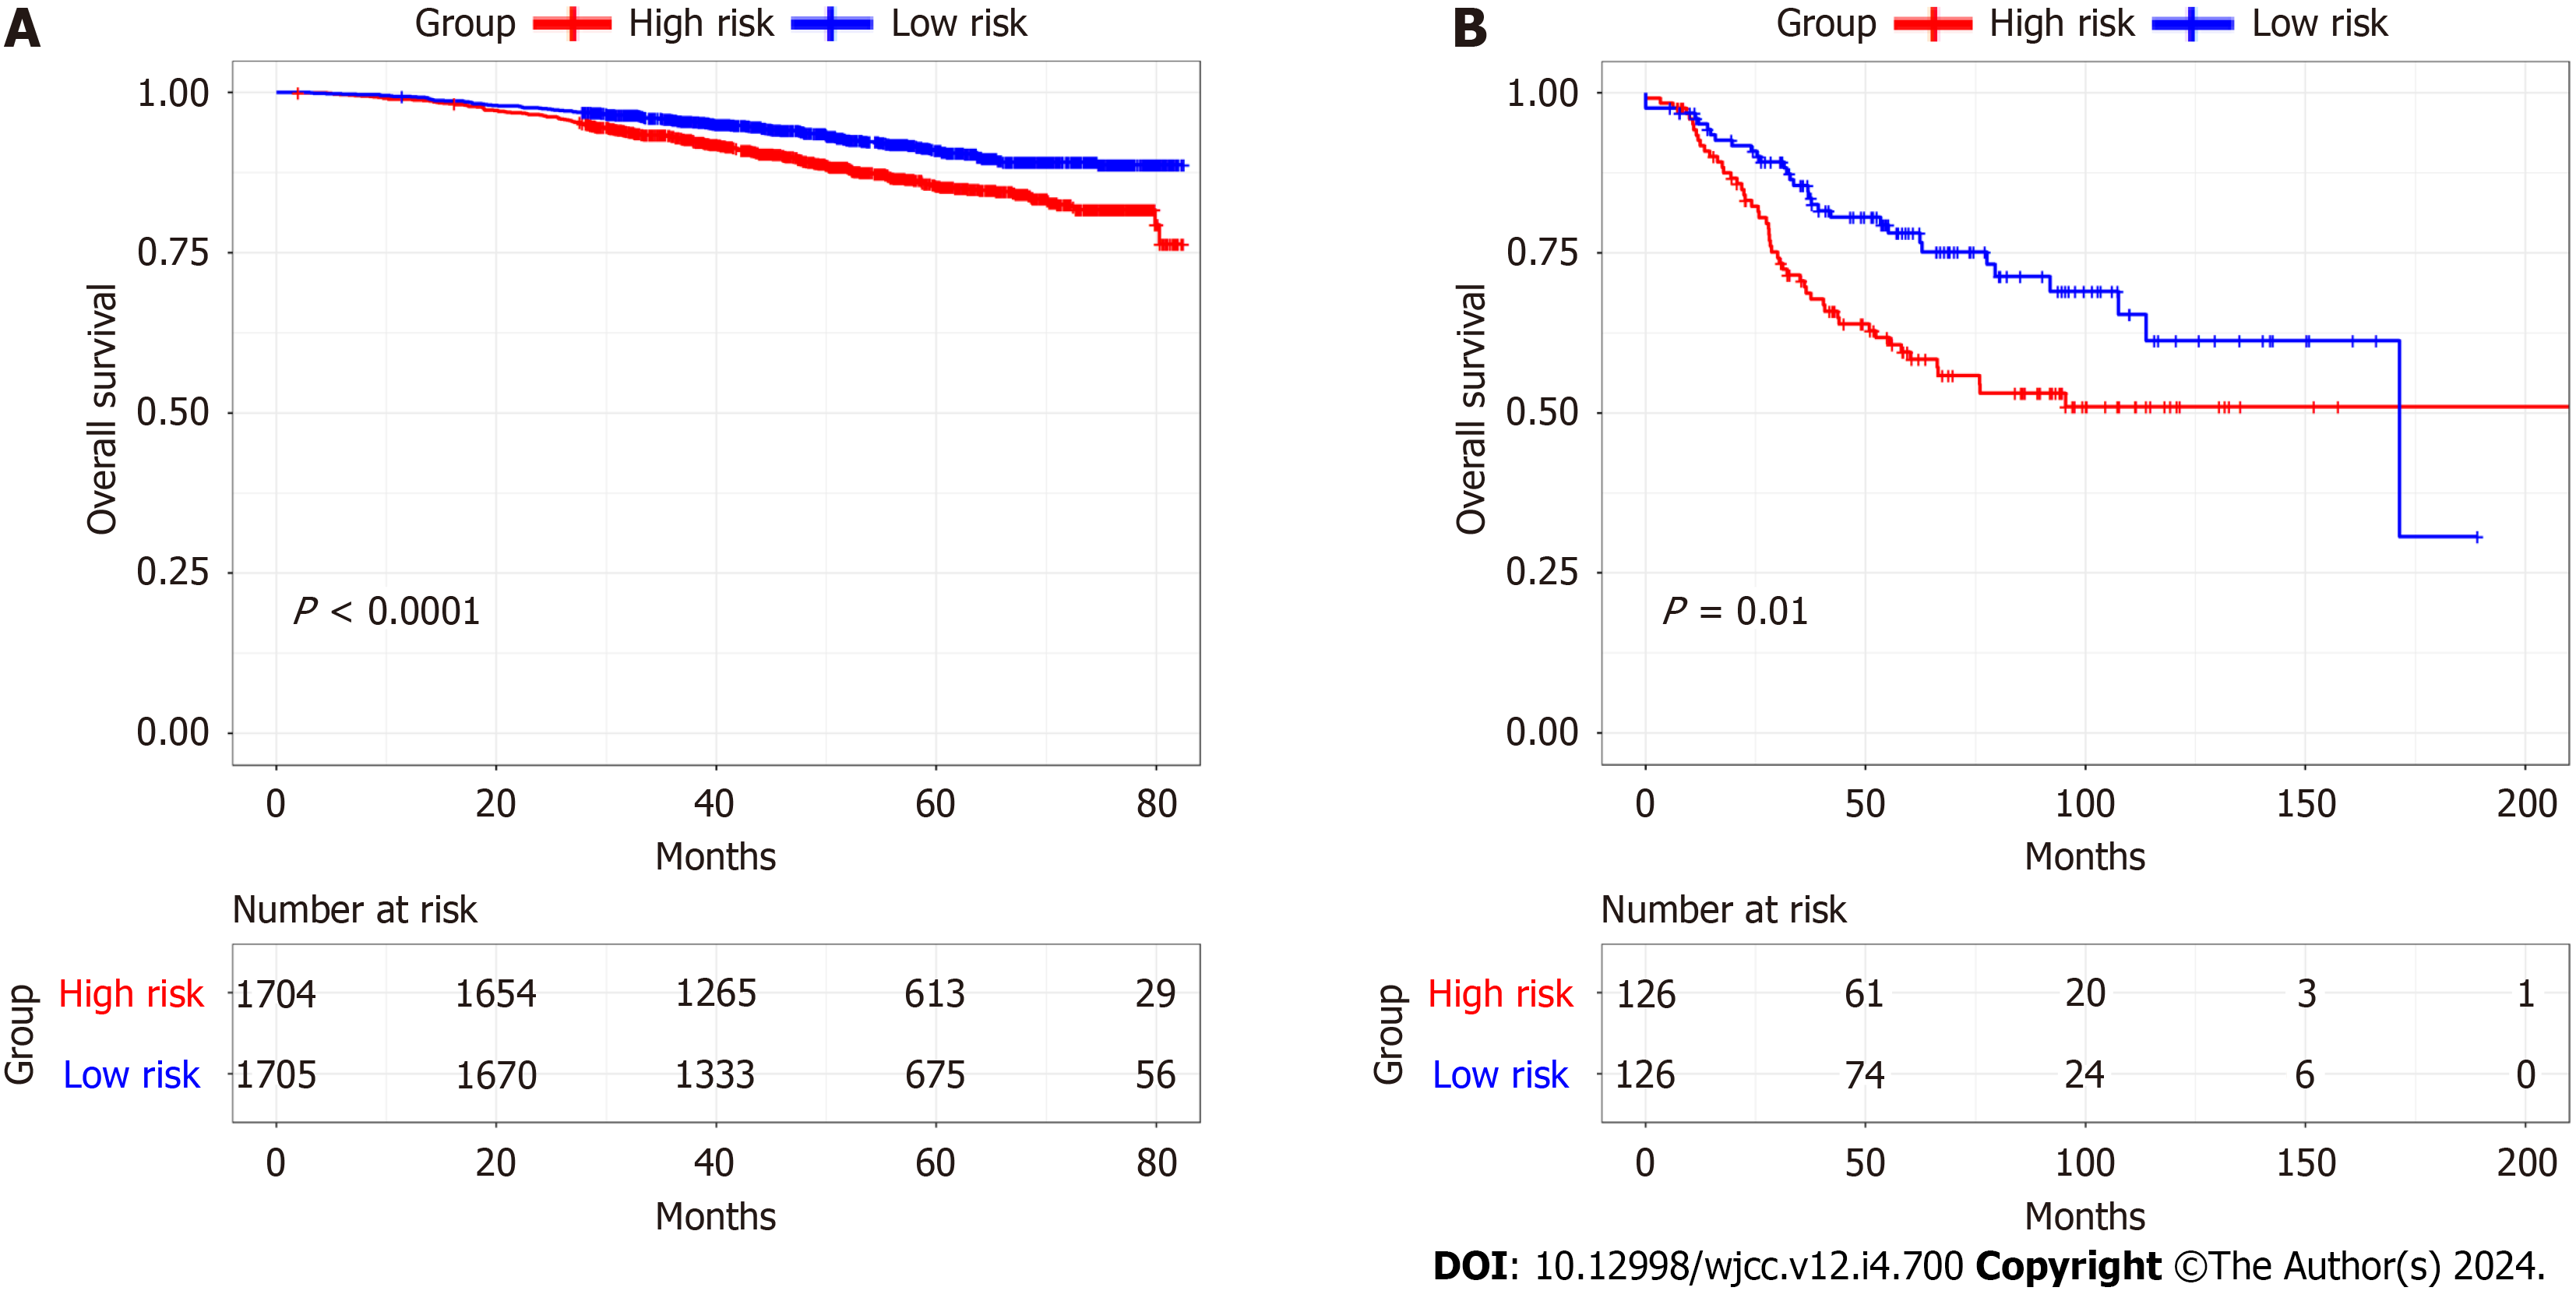
Using the median RS, we separated BC patients into either low- (LR) or high-risk (HR) groups to evaluate the predictive accuracy of the eight-gene prognostic signature. This showed that the LR group had significantly better OS, compared with the HR group (HR 2.951, 95%CI 2.220-3.924, P < 0.0001; Figure 7A). The AUCs of the prognostic signature showed that it was effective for predicting the OS of patients with BC (3-year AUC = 0.698, 5-year AUC = 0.719, 8-year AUC = 0.752) (Figure 7B). We generated risk curves and scatter plots to display the RS and survival status of individual BC patients, finding that poorer outcome was strongly related to an elevated RS (Figure 7C and D). Furthermore, a heatmap depicting the expression patterns of the risk-associated genes in both groups showed that FKBP14 and XG levels were significantly increased in HR patients, while the levels of IL18, MYD88, GLIPR1, TNN, BHLHE41, and DNAJB5 were elevated in LR patients (Figure 7E). Multivariate analysis indicated that the CAFPS was an independent prognostic factor of BC patient prognosis after adjustment for other clinical factors (HR 2.466, 95%CI 1.843-3.298, P < 0.001) (Figure 8).
The eight-gene prognostic signature was then validated using the GSE96058 and GSE21653 datasets. Kaplan-Meier sur
We then investigated whether RS could predict outcomes in various subgroups, including age ≥ 60, age < 60, phase I-II, phase III-IV, TNBC, and non-TNBC. This showed that all subgroups were accurately estimated by RS. Stratification analyses in the TCGA indicated worse OS for HR patients in each stratum, including age, stage, and molecular subtype, compared with LR patients. These data indicated that the CAFPS was a robust and independent predictor of OS in diffe
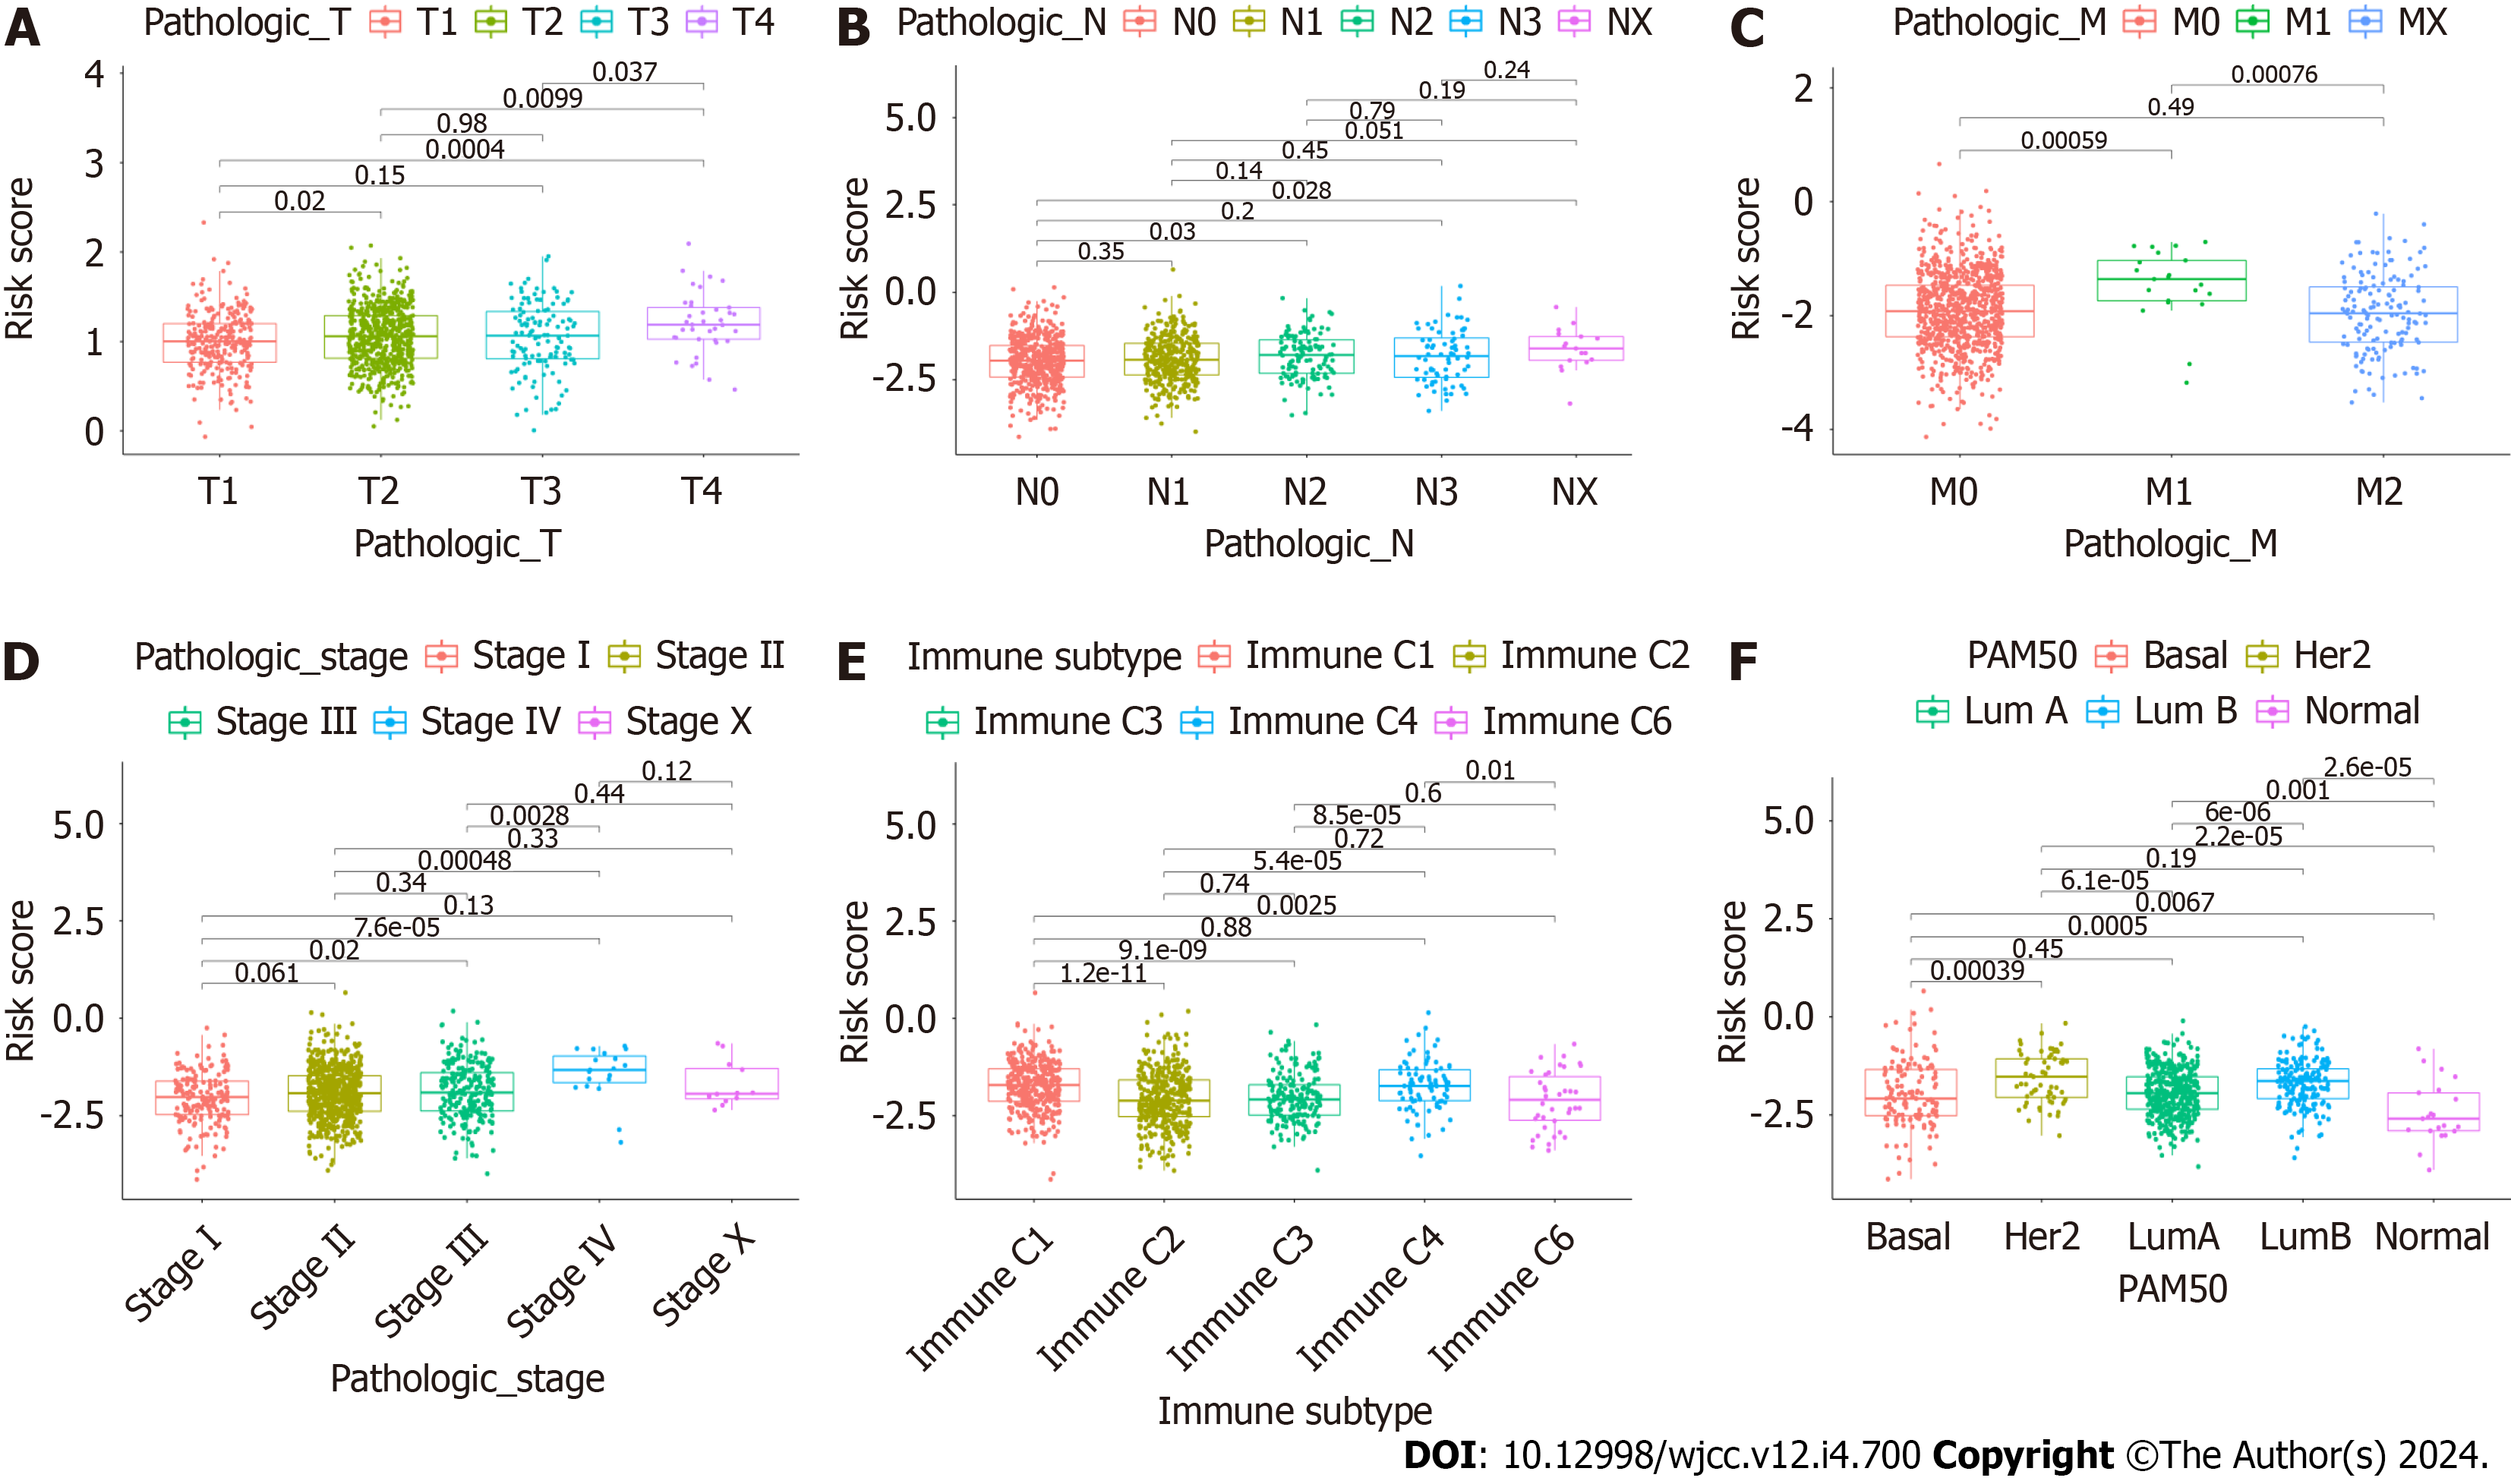
To further assess whether CAFrelated genes participated in the development of BC, we assessed the associations between CAFPS and patient clinicopathological factors. This showed that the CAFPS was significantly correlated with patho
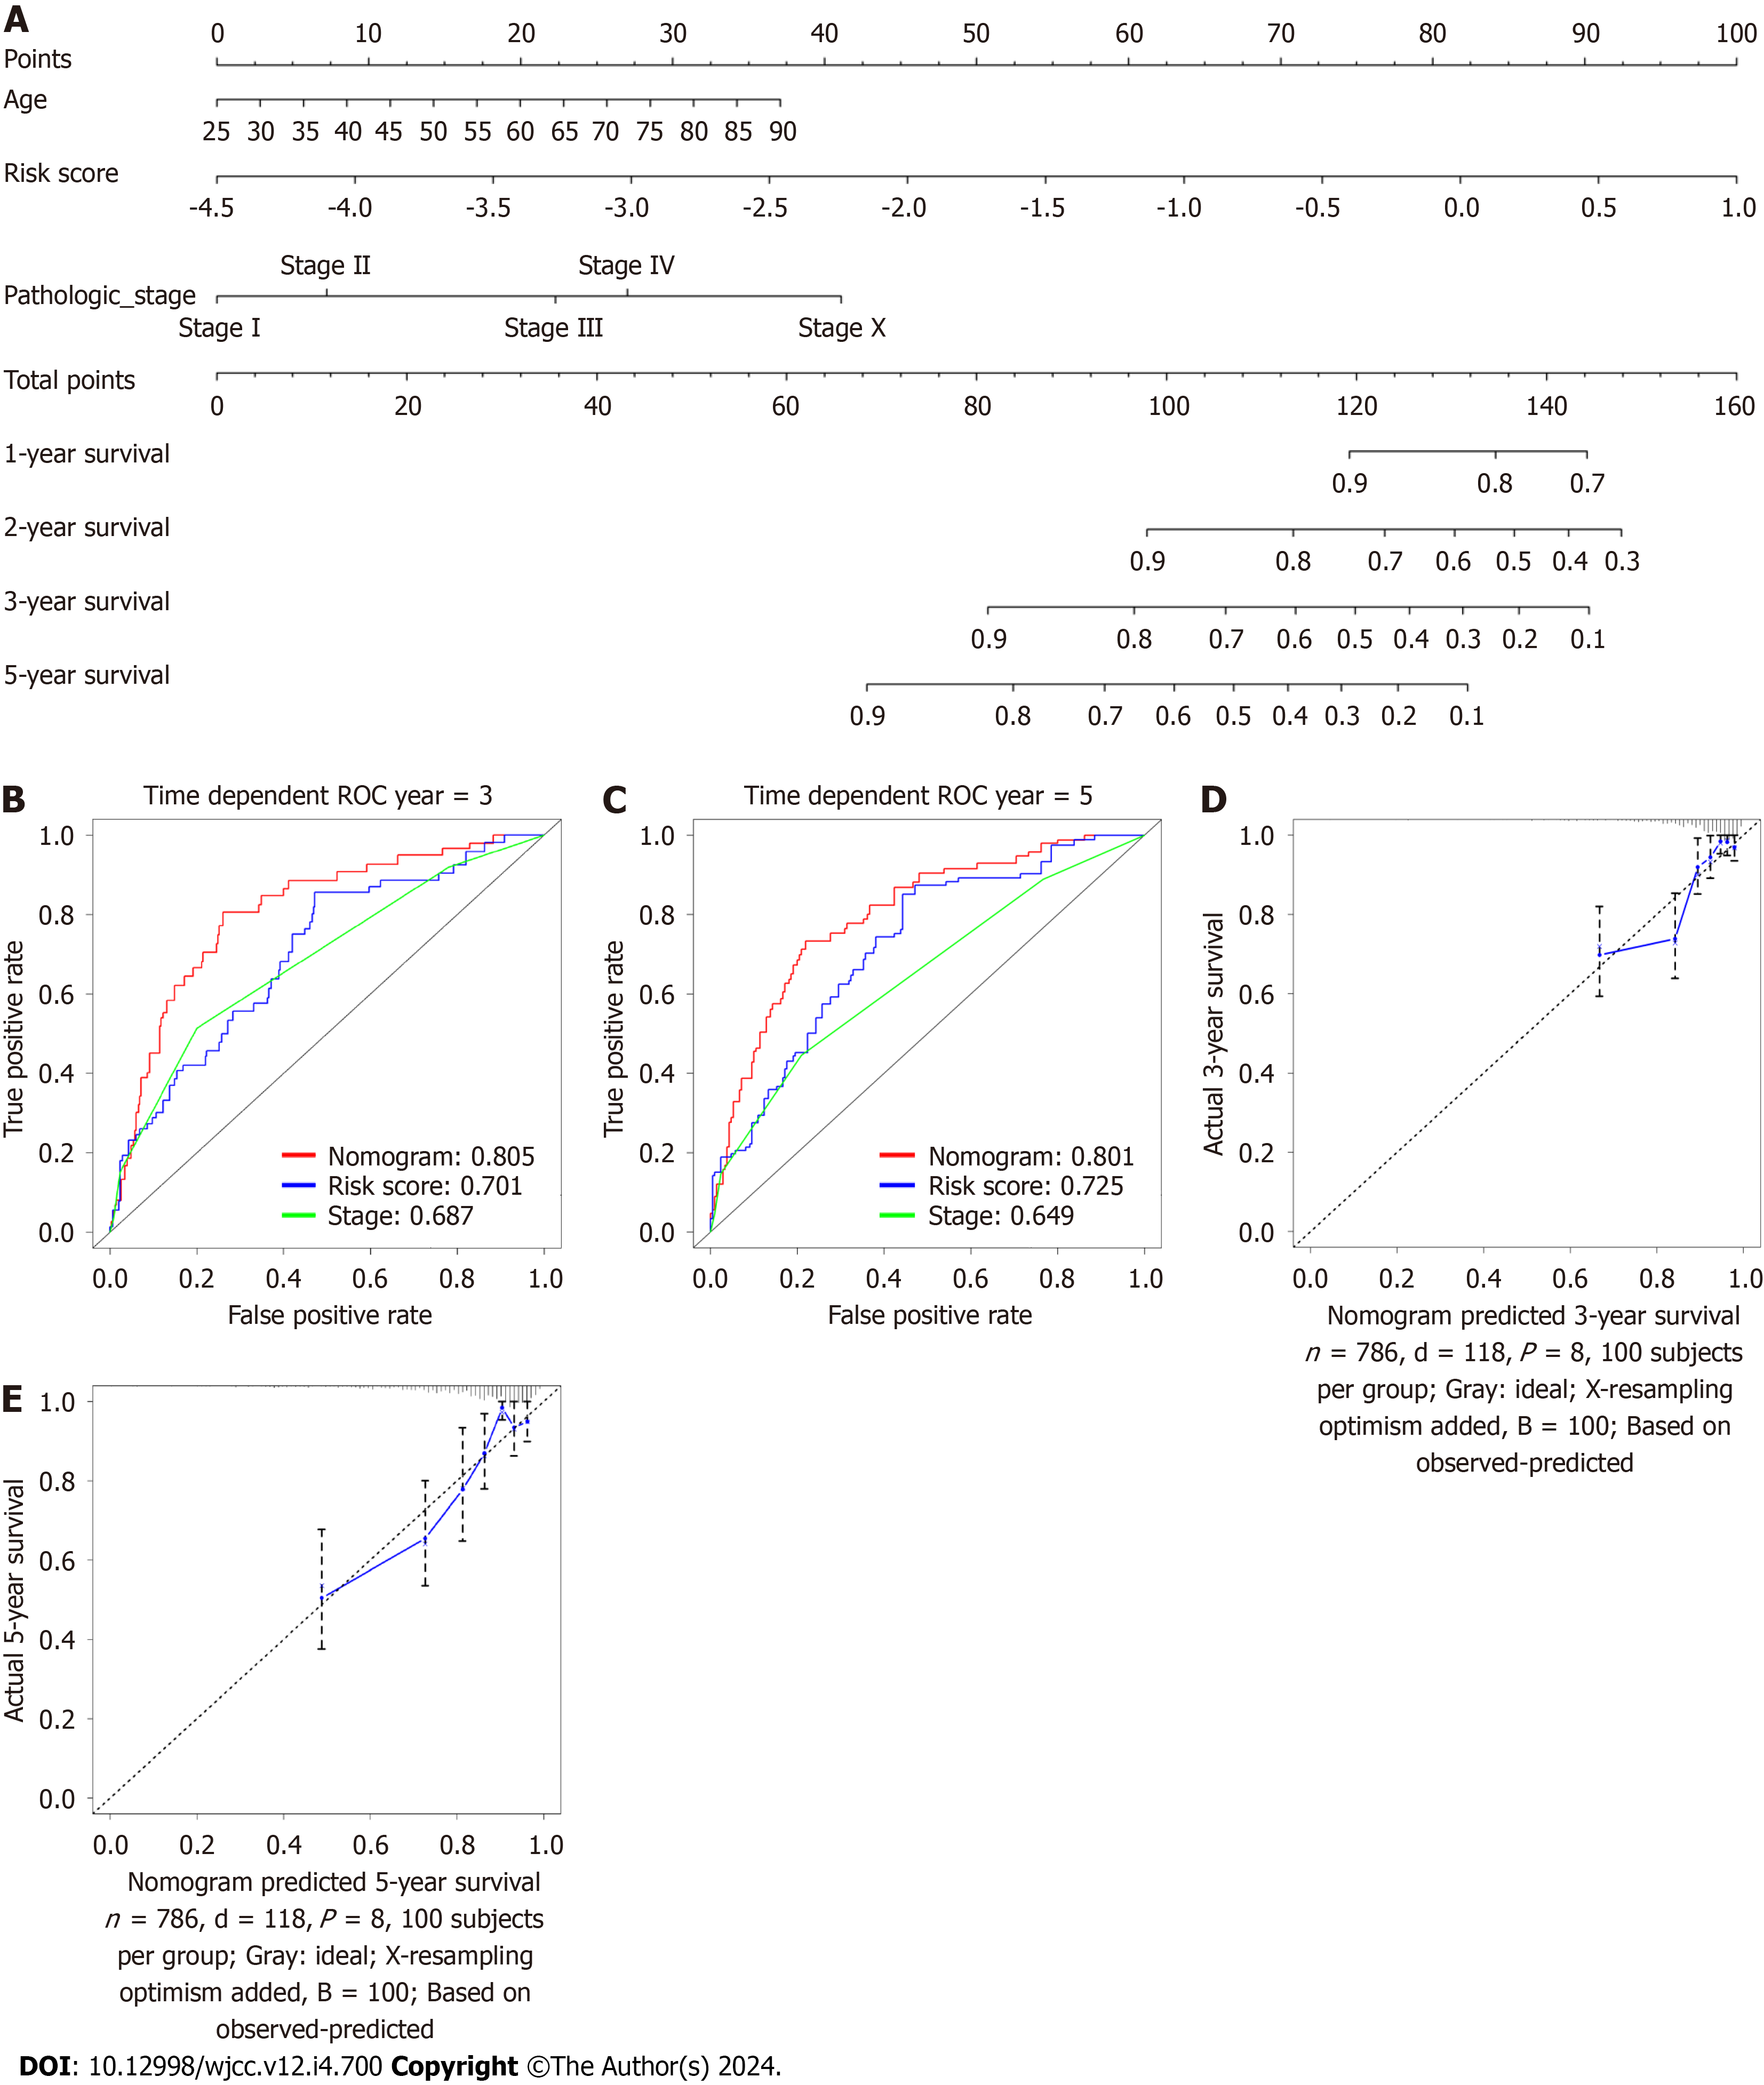
A nomogram was generated using the eight-gene CAFPS and several patient clinical characteristics, namely, age and pathological status, to predict the 3 and 5-year OS of BC patients (Figure 11A). All patients were given a point each for individual prognostic parameters, and a higher total score indicated worse prognosis. We next assessed the predictive efficacy of the nomogram using time-dependent ROC curve analysis. This showed that the AUCs of the nomogram were 0.805 and 0.801 for the 3- and 5-year OS rate predictions, respectively (Figure 11B and C). Moreover, higher AUCs were seen compared with the pathological stage. These results demonstrated the satisfactory predictive efficacy of the nomo
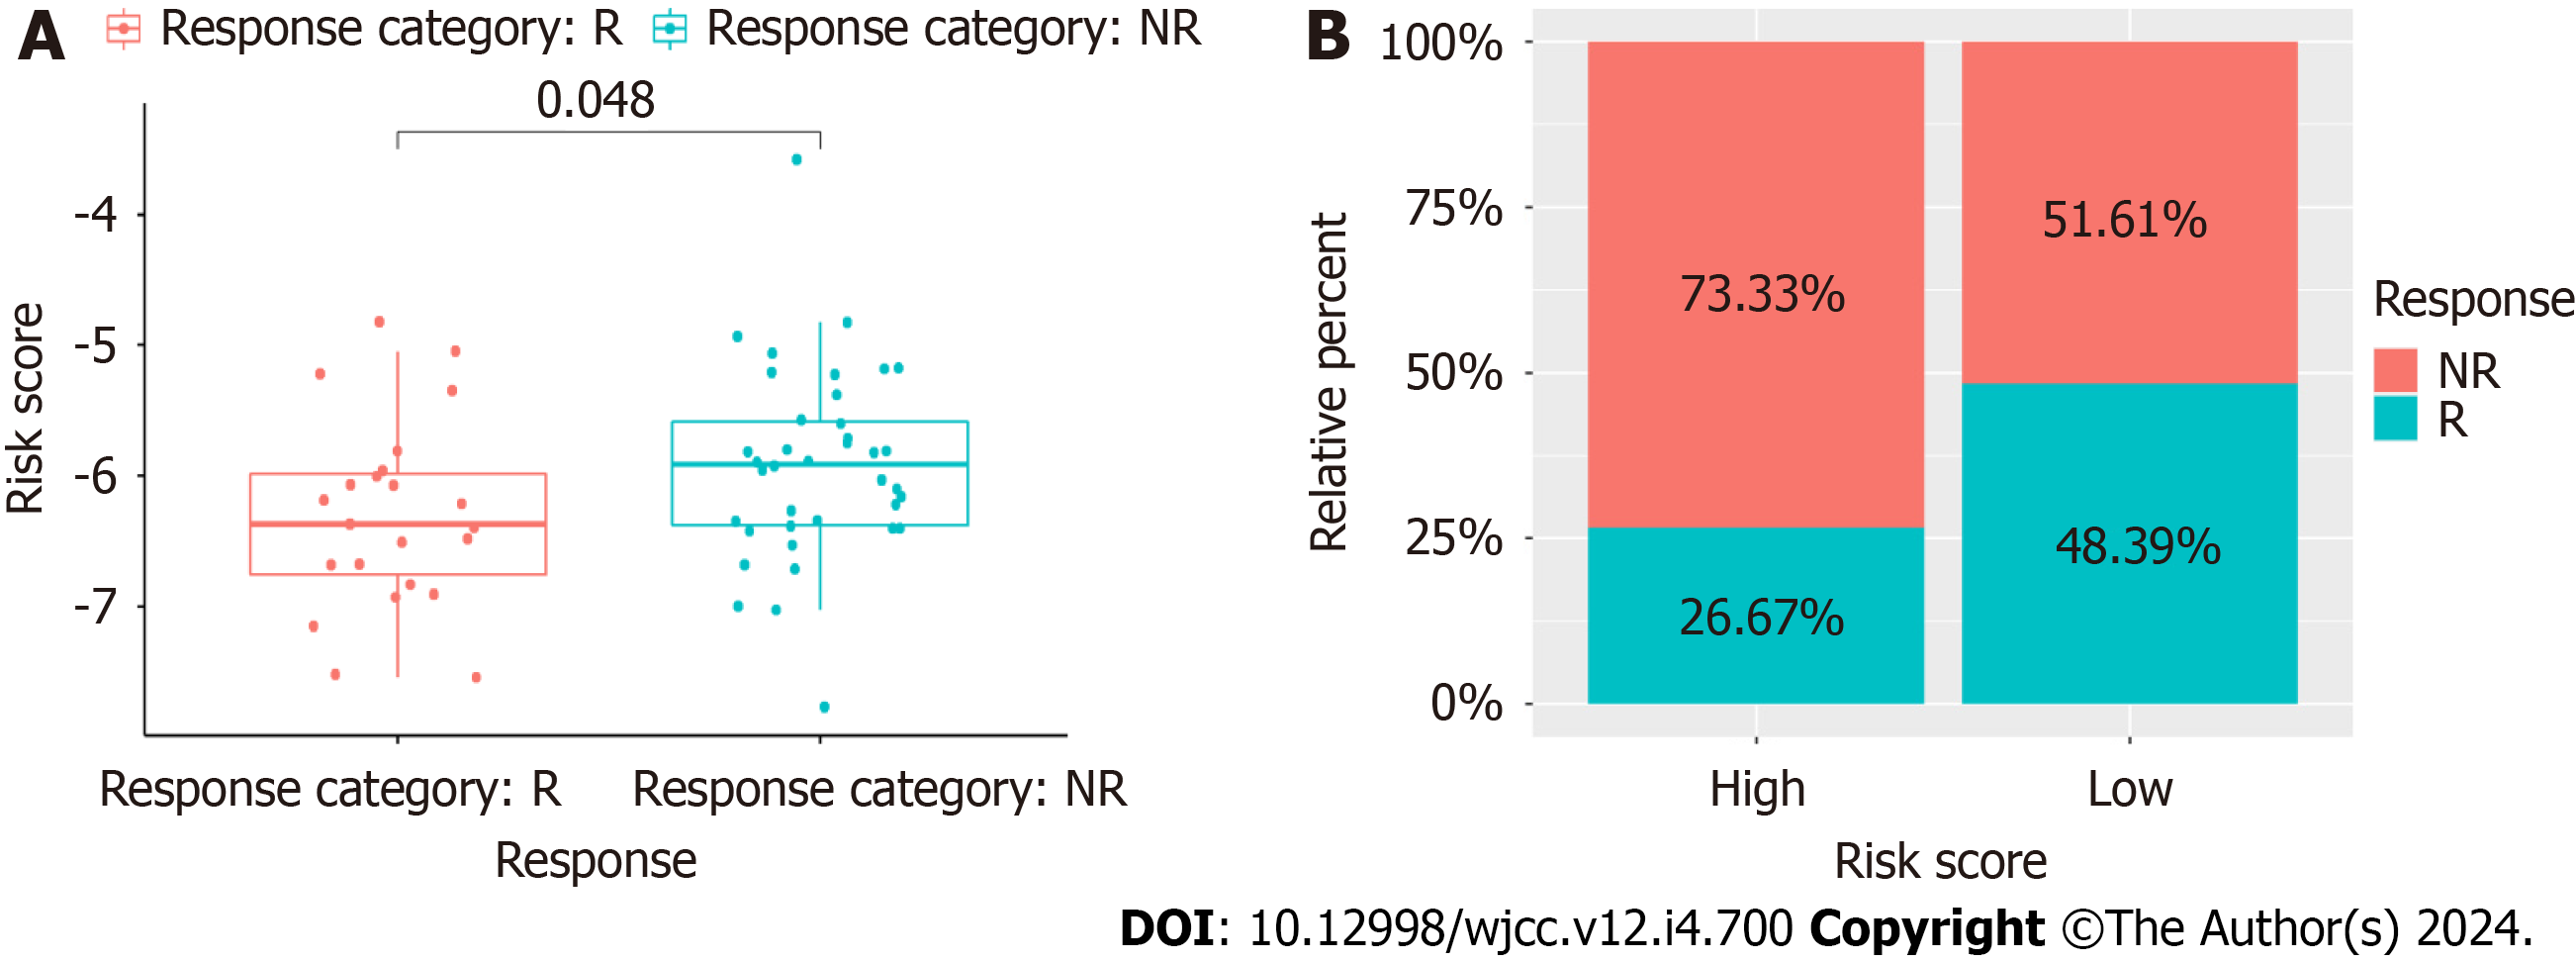
Patients in the GSE18728 dataset underwent chemotherapy. Of these, 11 responded while 17 did not. The CAFPS scores of the patients who responded were significantly lower compared to those of the non-responding patients (Wilcoxon test, P = 0.048, Figure 12A). Moreover, patients with reduced CAFPS scores responded better than those with elevated scores (Figure 12B). These findings indicate that the CAFPS was effective for estimating patient response to chemotherapy. This also explained the worse outcome and rapid cancer progression of patients with elevated CAFPS scores who underwent chemotherapy.
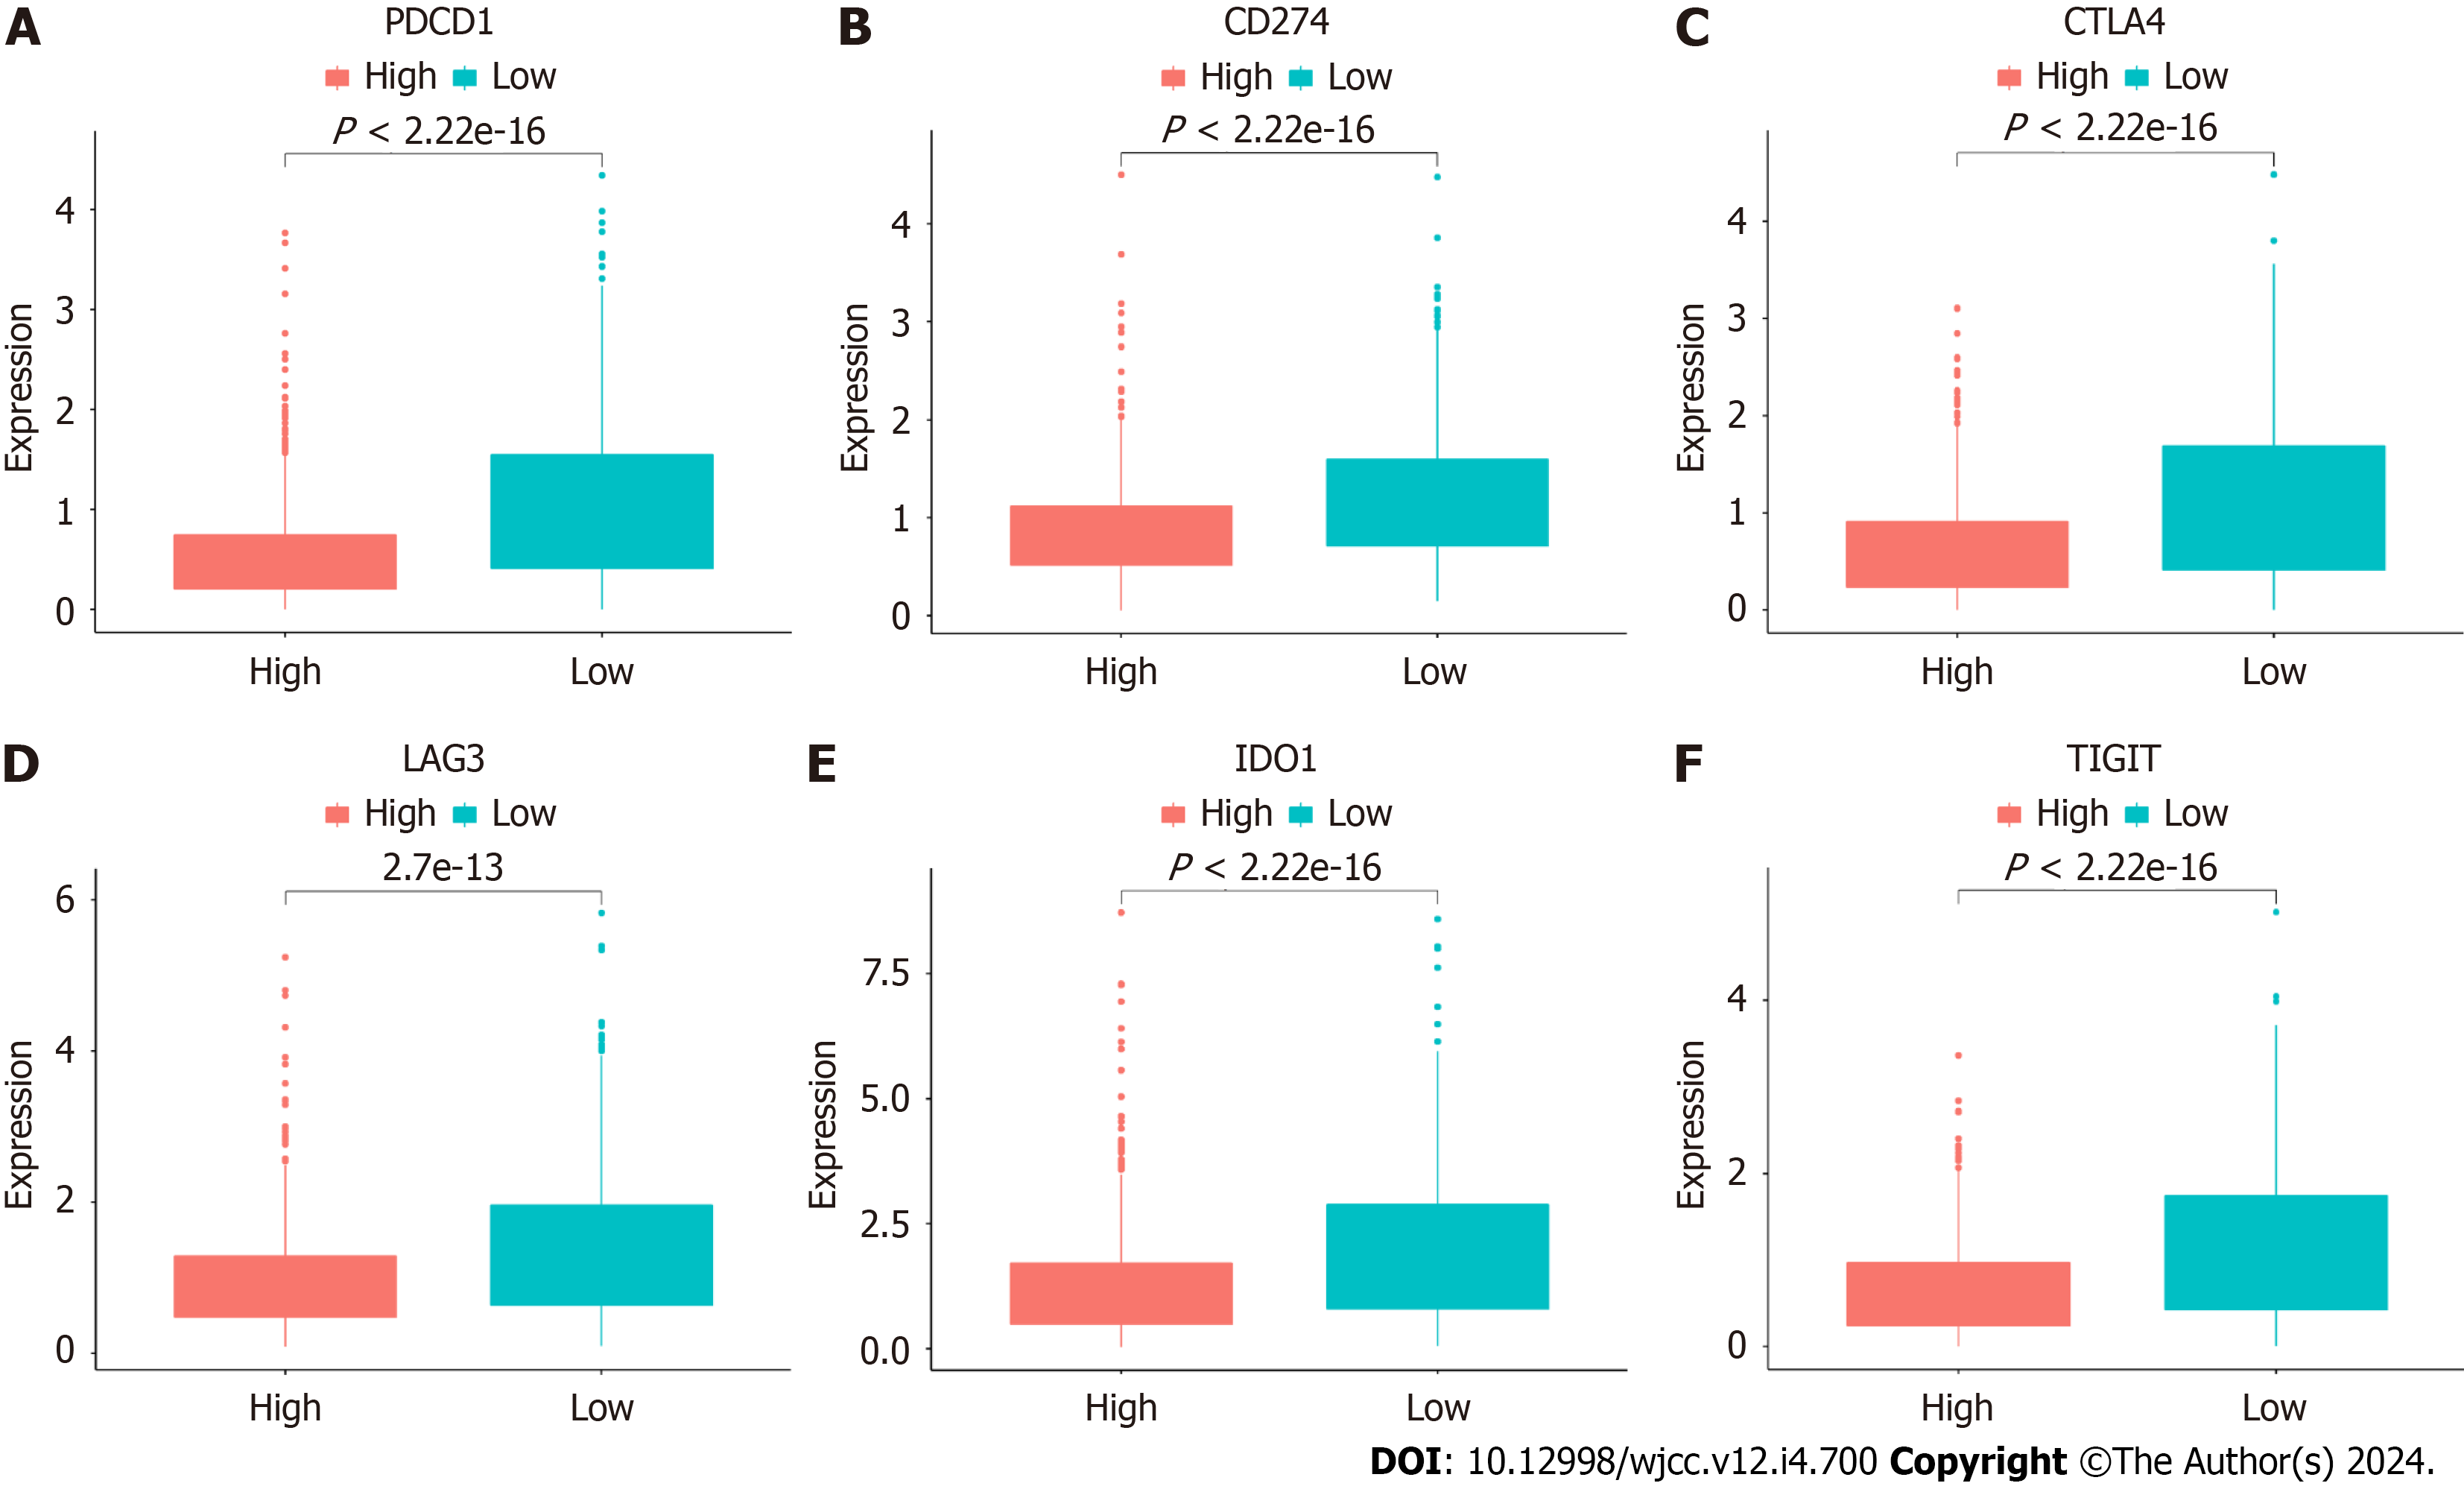
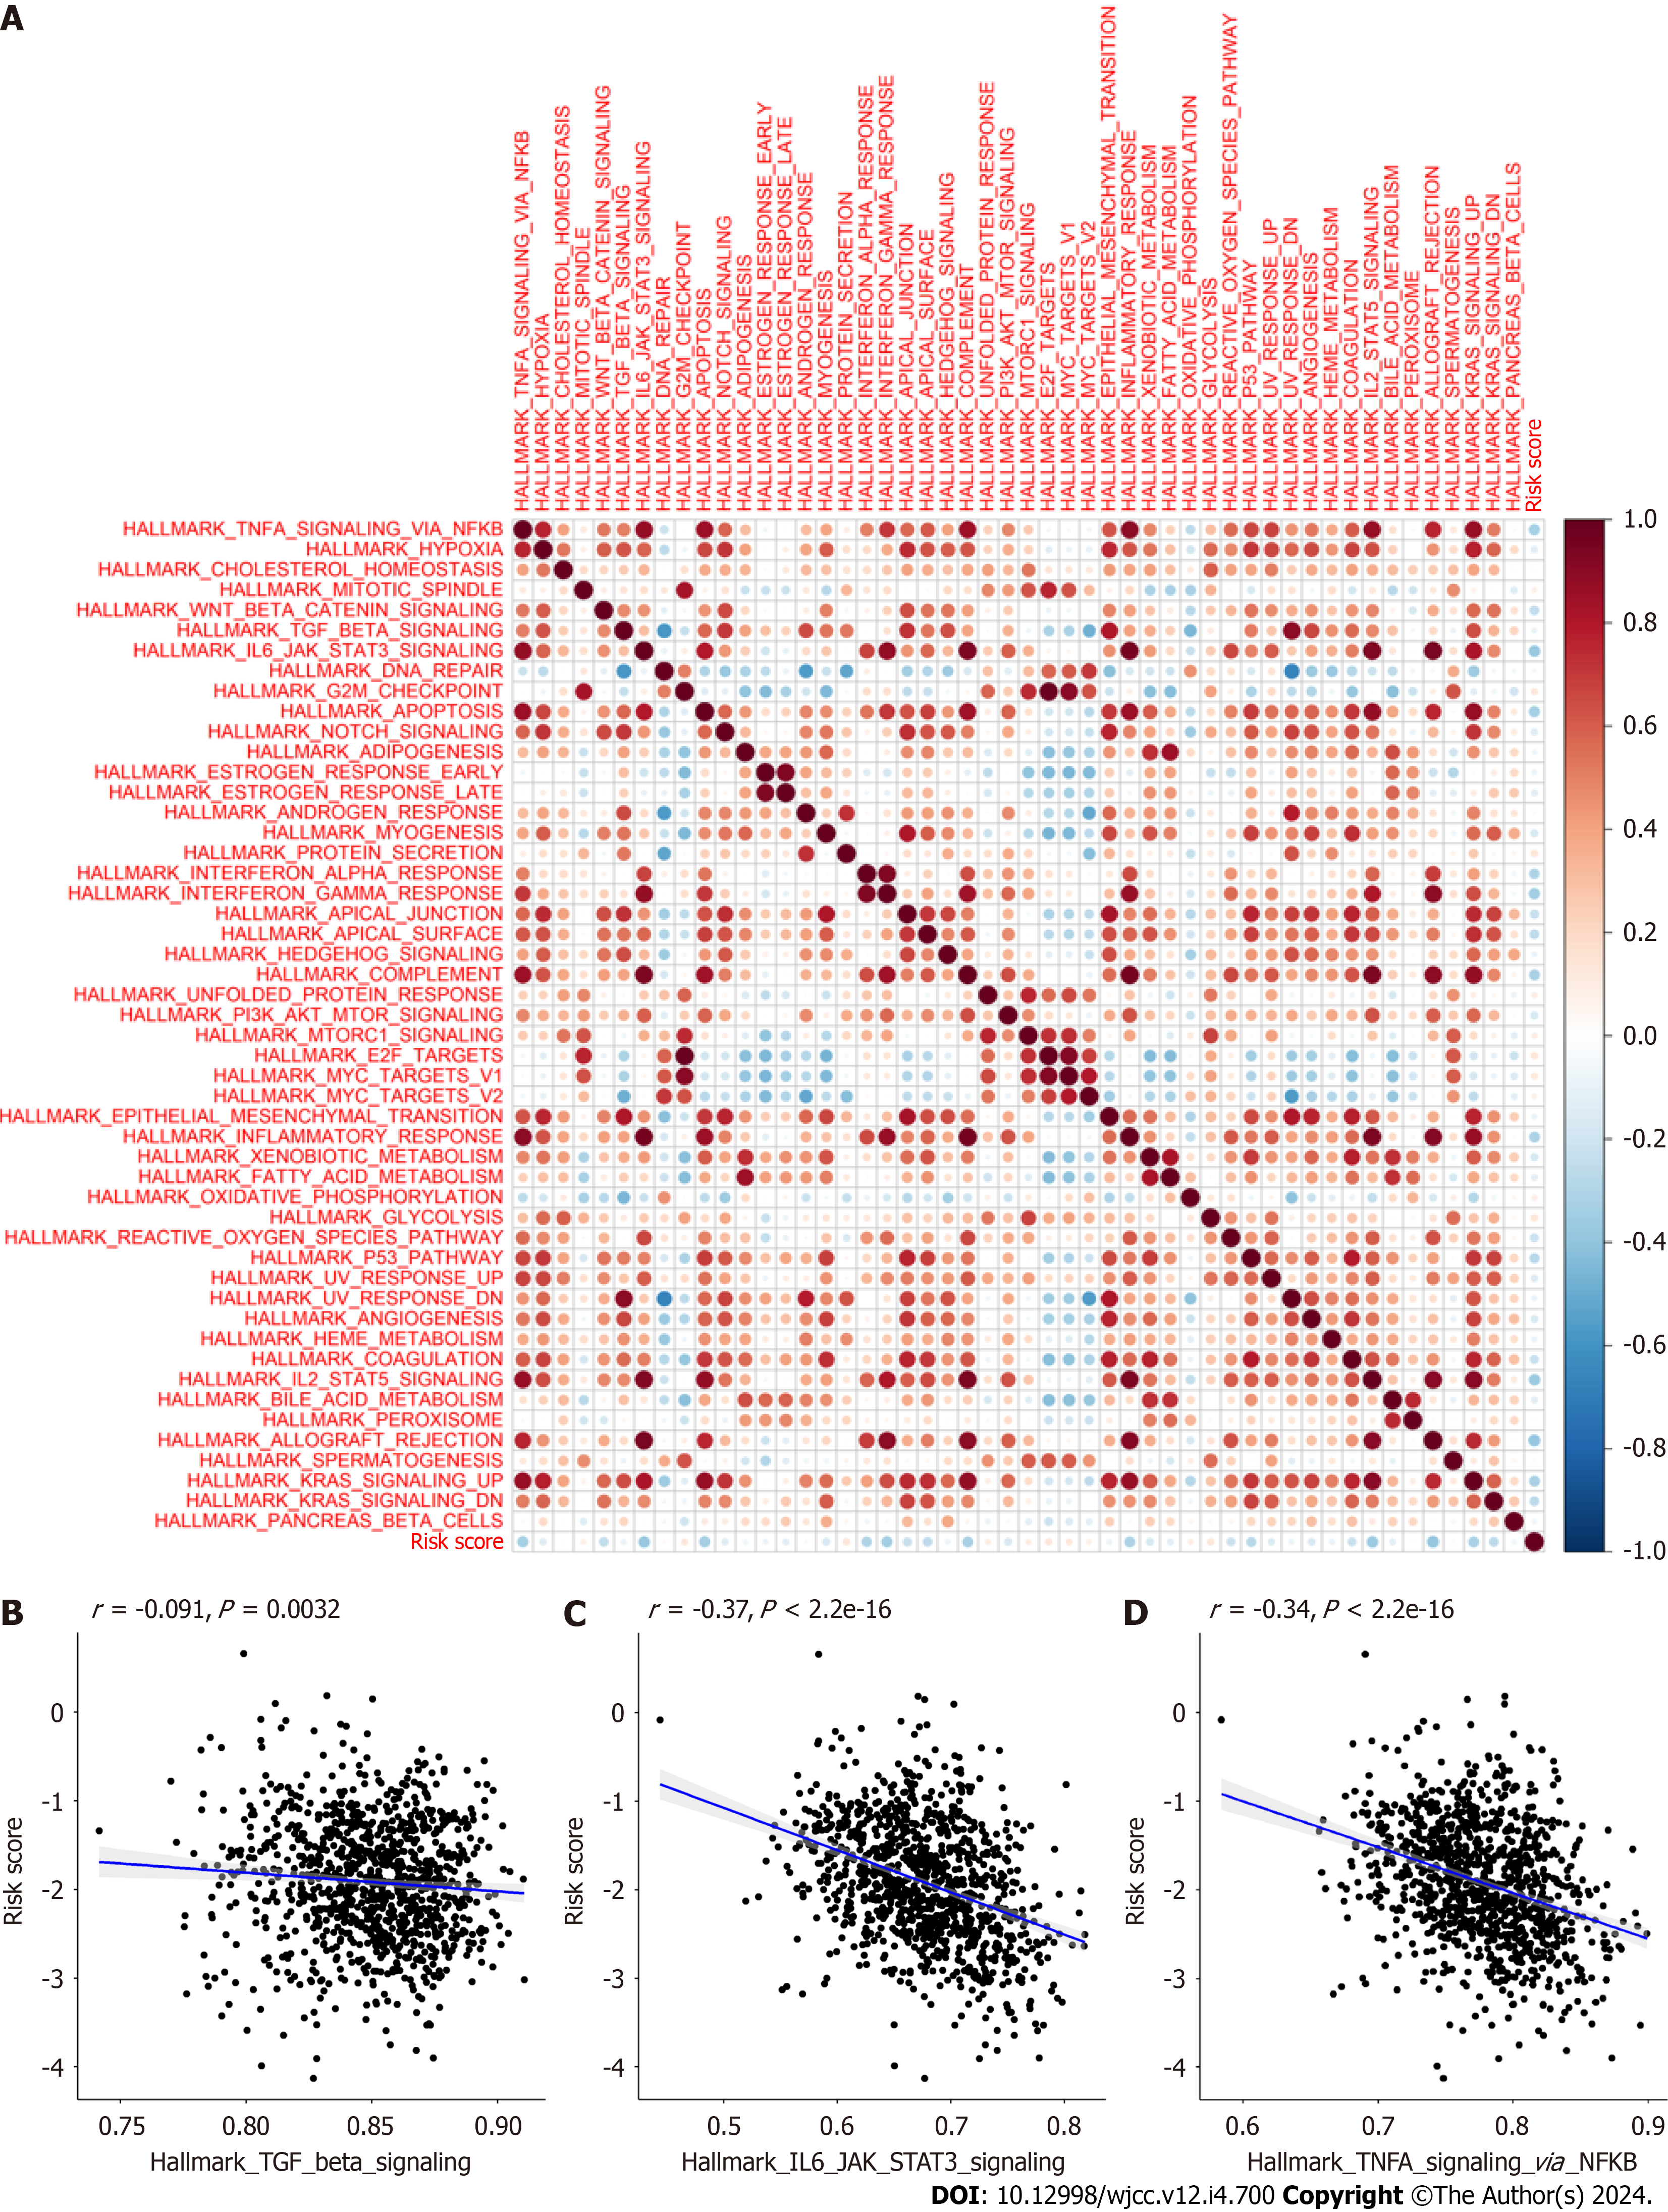
We next assessed differences in the levels of immune checkpoint molecules between the HR and LR cohorts. Relative to the HR cohort, the levels of PDCD1 (PD1) (P < 2.22e-16), CD274 (PD-L1) (P < 2.22e-16), CTLA4 (P < 2.22e-16), LAG3 (2.7e-13), IDO1 (P < 2.22e-16), and TIGIT (P < 2.22e-16) were significantly raised in the LR cohort (Figure 13). Another interesting finding was that almost all of the hallmark gene networks were significantly associated with CAFPS (Figure 14A). Moreover, the single-sample gene set enrichment analysis (ssGSEA) showed that the CAFPS RS was negatively associated with the TGF-BETA (r = -0.091, P = 0.0032), IL-6-JAK-STAT3 (r = -0.37, P < 2.2e-16), and TNFA-SIGNALING-VIA-NFKB (r =-0.34, P < 2.2e-16) signaling pathways (Figure 14B-D).
We found that the expression levels of FKBP14 was significantly higher in breast cancer samples than in the paired adjacent normal tissues. Patients were divided into high expression group and low expression group based on the me
| Variables | n | Low expression of FKBP14 (n = 40) | High expression of FKBP14 (n = 40) | χ2 | P value |
| Age (yr) | 0.056 | 0.813 | |||
| ≤ 60 | 53 | 27 (67.5) | 26 (65) | ||
| > 60 | 27 | 13 (32.5) | 14 (35) | ||
| Tumor size | 10.769 | 0.002 | |||
| ≤ 2 cm | 28 | 21 (52.5) | 7 (17.5) | ||
| > 2 cm | 52 | 19 (47.5) | 33 (82.5) | ||
| Lymph node metastasis | 25.208 | < 0.001 | |||
| No | 48 | 35 (87.5) | 13 (32.5) | ||
| Yes | 32 | 5 (12.5) | 27 (67.5) | ||
| Stage | 11.250 | 0.001 | |||
| I-II | 64 | 38 (95) | 26 (65) | ||
| III | 16 | 2 (5) | 14 (35) | ||
| Subtype | 3.660 | 0.056 | |||
| Triple negative | 17 | 12 (30) | 5 (12.5) | ||
| Non-triple negative | 63 | 28 (70) | 35 (87.5) |
Current methods are relatively ineffective for predicting the outcomes of BC patients, likely due to complications related to phenotypes and underlying mechanisms. However, advances in bioinformatics have allowed the identification of new biomarkers to aid BC diagnosis and the estimation of patient outcomes[22,23]. CAFs, non-neoplastic stromal cells found within the TME, aid in tumor formation and metastasis[24,25]. Multiple studies have identified CAFs as indicators of drug resistance and worse outcome in a range of tumors[26-28]. Moreover, it was revealed that factors secreted by CAFs can transmit signals to tumor cells that promote drug resistance[29]. Furthermore, CAFs also release cytokines, exosomes, and growth factors, which influence components of the TME, thereby modulating the therapeutic response. Emerging evi
Prior investigations have identified fibroblasts based on their expression of FAP and αSMA[30]. However, fibroblasts are distinct from cancer cells and have thus not been further stratified. Single-cell RNA sequencing (scRNA-seq) can examine the entire cellular signature of tumor cells[31,32]. Recent CAF examinations recognized two polarized states regulated by ECM formation or inflammatory secretomes[33-35].
Previous reports indicated that cancer-associated fibroblast genes expression can estimate breast cancer patient prognosis and predict the responses to immunotherapy[36-38]. Wang et al[36] reported that signature based on cancer-associated fibroblast genes could divide patients into low- and high-risk groups, accompanied by different OS, clinical features, and immune infiltration characteristics. Huang et al[37] identified various heterogeneous CAF cell populations in breast cancer patients. An CAF-associated gene signature was developed to predict the responses to immunotherapeutics. The five-gene prognostic CAF signature presented by Xu et al[38] was effective in estimating clinical immunotherapy response. In this study, we confirmed that the proportion of CAF-S3 cells was closely associated with patient prognosis, based on the CAF-related gene expression signature obtained from previous reports[16]. Subsequently, we regarded the proportion of CAF-S3 cells as a clinical characteristic and developed a CAF-based gene signature using eight genes (IL18, MYD88, GLIPR1, TNN, BHLHE41, DNAJB5, FKBP14, and XG) using WGCNA, univariate, LASSO, and multivariate analyses to predict patient prognosis. This demonstrated that the LR cohort had markedly better OS com
We then generated a nomogram to estimate BC patient outcomes. Based on our results, our model was highly effective in predicting BC patient prognosis. The results of the calibration curves demonstrated that the nomogram was able to accurately predict the prognosis of patients with BC. However, when compared with traditional clinical features, the prognostic signature showed even better potential for clinical application. According to the model, a reduced CAFPS RS was significantly related to enhanced chemotherapeutic response in BC patients. In addition, CAFPS was strongly correlated with most hallmark gene sets, explaining the rapid progression and worse outcomes of patients with elevated CAFPS values. Immune checkpoint molecules can also reflect the immune status of tumor microenvironments. In the present study, the levels of immune checkpoint molecules were found to be significantly elevated in the LR cohort, im
For a proper evaluation of the prognostic signature, we then assessed individual biomarkers. IL-18 is a member of the IL-1 family of proinflammatory cytokines. IL-18 modulates Th1 and Th2 immune responses, as well as the activation of NK cells and macrophages[39]. It is reported that the IL-18 protein is strongly expressed in human BC and lymph node tissues, and is directly associated with lymph node metastasis in BC[40]. MYD88 serves a critical function in both innate and adaptive immune responses. It is also involved in crosstalk with the interleukin-1 and Toll-like receptor networks. MYD88 expression is high in metastatic tumors and has been suggested as a potential therapeutic target[41]. GLIPR1 is markedly up-regulated in BC and has been identified as an oncoprotein in BC. In BC cells, GLIPR1 expression is pro
Here, we generated a CAF-associated gene prognostic signature using IL18, MYD88, GLIPR1, TNN, BHLHE41, DNAJB5, FKBP14, and XG as prognostic markers of BC. This novel signature can be employed to estimate BC patient outcomes conveniently and accurately. These results provide a basis for further studies on the role of CAFs in BC.
Breast cancer (BC), a leading malignant disease, affects women all over the world. It is still urgent to explore new biomarkers to estimate and enhance prognosis of BC patients.
The present study for the first time investigated the 8 cancer associated fibroblasts (CAFs)-associated genes as the potential biomarkers of the prognosis of patients using bioinformatics.
This study aims to establish a CAFs-associated prognostic signature to improve BC patient outcome estimation.
We retrieved the transcript profile and clinical data of 1072 BC samples from The Cancer Genome Atlas (TCGA) data
Patient samples were collected to validate gene expression by quantitative real-time polymerase chain reaction (qRT-PCR).
Employing an 8-gene (IL18, MYD88, GLIPR1, TNN, BHLHE41, DNAJB5, FKBP14, and XG) signature, we attempted to estimate BC patient prognosis. Based on our analysis, high-risk patients exhibited worse outcomes than low-risk patients. Multivariate analysis revealed the risk score as an independent indicator of BC patient prognosis. ROC analysis exhibited satisfactory nomogram predictability. The AUC showed 0.805 at 3 years, and 0.801 at 5 years in the TCGA cohort. We also demonstrated that a reduced CAF risk score was strongly associated with enhanced chemotherapeutic outcomes. CAF risk score was significantly correlated with most hallmark gene sets. Finally, the prognostic signature were further va
We introduced a newly-discovered CAFs-associated gene signature, which can be employed to estimate BC patient out
The mechanisms of 8 CAFs-associated genes in BC is still unclear, which needs further confirmation through molecular biology and clinical experiments.
The authors thank TCGA and GEO for sharing the BC data.
Provenance and peer review: Unsolicited article; Externally peer reviewed.
Peer-review model: Single blind
Specialty type: Oncology
Country/Territory of origin: China
Peer-review report’s scientific quality classification
Grade A (Excellent): 0
Grade B (Very good): 0
Grade C (Good): C, C, C
Grade D (Fair): 0
Grade E (Poor): 0
P-Reviewer: Bansal C, India; Papadopoulos VP, Greece S-Editor: Liu JH L-Editor: A P-Editor: Xu ZH
| 1. | Siegel RL, Miller KD, Fuchs HE, Jemal A. Cancer statistics, 2022. CA Cancer J Clin. 2022;72:7-33. [RCA] [PubMed] [DOI] [Full Text] [Cited by in Crossref: 4235] [Cited by in RCA: 11439] [Article Influence: 3813.0] [Reference Citation Analysis (4)] |
| 2. | Pu M, Messer K, Davies SR, Vickery TL, Pittman E, Parker BA, Ellis MJ, Flatt SW, Marinac CR, Nelson SH, Mardis ER, Pierce JP, Natarajan L. Research-based PAM50 signature and long-term breast cancer survival. Breast Cancer Res Treat. 2020;179:197-206. [RCA] [PubMed] [DOI] [Full Text] [Full Text (PDF)] [Cited by in Crossref: 22] [Cited by in RCA: 58] [Article Influence: 9.7] [Reference Citation Analysis (0)] |
| 3. | Tekpli X, Lien T, Røssevold AH, Nebdal D, Borgen E, Ohnstad HO, Kyte JA, Vallon-Christersson J, Fongaard M, Due EU, Svartdal LG, Sveli MAT, Garred Ø; OSBREAC, Frigessi A, Sahlberg KK, Sørlie T, Russnes HG, Naume B, Kristensen VN. An independent poor-prognosis subtype of breast cancer defined by a distinct tumor immune microenvironment. Nat Commun. 2019;10:5499. [RCA] [PubMed] [DOI] [Full Text] [Full Text (PDF)] [Cited by in Crossref: 67] [Cited by in RCA: 136] [Article Influence: 22.7] [Reference Citation Analysis (0)] |
| 4. | Wang M, Zhao J, Zhang L, Wei F, Lian Y, Wu Y, Gong Z, Zhang S, Zhou J, Cao K, Li X, Xiong W, Li G, Zeng Z, Guo C. Role of tumor microenvironment in tumorigenesis. J Cancer. 2017;8:761-773. [RCA] [PubMed] [DOI] [Full Text] [Full Text (PDF)] [Cited by in Crossref: 1071] [Cited by in RCA: 956] [Article Influence: 119.5] [Reference Citation Analysis (0)] |
| 5. | Dzobo K, Dandara C. Architecture of Cancer-Associated Fibroblasts in Tumor Microenvironment: Mapping Their Origins, Heterogeneity, and Role in Cancer Therapy Resistance. OMICS. 2020;24:314-339. [RCA] [PubMed] [DOI] [Full Text] [Cited by in Crossref: 19] [Cited by in RCA: 47] [Article Influence: 11.8] [Reference Citation Analysis (0)] |
| 6. | Bertero T, Oldham WM, Grasset EM, Bourget I, Boulter E, Pisano S, Hofman P, Bellvert F, Meneguzzi G, Bulavin DV, Estrach S, Feral CC, Chan SY, Bozec A, Gaggioli C. Tumor-Stroma Mechanics Coordinate Amino Acid Availability to Sustain Tumor Growth and Malignancy. Cell Metab. 2019;29:124-140.e10. [RCA] [PubMed] [DOI] [Full Text] [Cited by in Crossref: 160] [Cited by in RCA: 290] [Article Influence: 48.3] [Reference Citation Analysis (0)] |
| 7. | Gamradt P, De La Fouchardière C, Hennino A. Stromal Protein-Mediated Immune Regulation in Digestive Cancers. Cancers (Basel). 2021;13. [RCA] [PubMed] [DOI] [Full Text] [Full Text (PDF)] [Cited by in Crossref: 8] [Cited by in RCA: 16] [Article Influence: 4.0] [Reference Citation Analysis (0)] |
| 8. | Kaur A, Ecker BL, Douglass SM, Kugel CH 3rd, Webster MR, Almeida FV, Somasundaram R, Hayden J, Ban E, Ahmadzadeh H, Franco-Barraza J, Shah N, Mellis IA, Keeney F, Kossenkov A, Tang HY, Yin X, Liu Q, Xu X, Fane M, Brafford P, Herlyn M, Speicher DW, Wargo JA, Tetzlaff MT, Haydu LE, Raj A, Shenoy V, Cukierman E, Weeraratna AT. Remodeling of the Collagen Matrix in Aging Skin Promotes Melanoma Metastasis and Affects Immune Cell Motility. Cancer Discov. 2019;9:64-81. [RCA] [PubMed] [DOI] [Full Text] [Cited by in Crossref: 264] [Cited by in RCA: 297] [Article Influence: 49.5] [Reference Citation Analysis (0)] |
| 9. | Avalle L, Raggi L, Monteleone E, Savino A, Viavattene D, Statello L, Camperi A, Stabile SA, Salemme V, De Marzo N, Marino F, Guglielmi C, Lobascio A, Zanini C, Forni M, Incarnato D, Defilippi P, Oliviero S, Poli V. STAT3 induces breast cancer growth via ANGPTL4, MMP13 and STC1 secretion by cancer associated fibroblasts. Oncogene. 2022;41:1456-1467. [RCA] [PubMed] [DOI] [Full Text] [Cited by in Crossref: 2] [Cited by in RCA: 58] [Article Influence: 19.3] [Reference Citation Analysis (0)] |
| 10. | Zeng H, Hou Y, Zhou X, Lang L, Luo H, Sun Y, Wan X, Yuan T, Wang R, Liu Y, Tang R, Cheng S, Xu M, Liu M. Cancer-associated fibroblasts facilitate premetastatic niche formation through lncRNA SNHG5-mediated angiogenesis and vascular permeability in breast cancer. Theranostics. 2022;12:7351-7370. [RCA] [PubMed] [DOI] [Full Text] [Cited by in RCA: 79] [Reference Citation Analysis (0)] |
| 11. | Fang WB, Medrano M, Cote P, Portsche M, Rao V, Hong Y, Behbod F, Knapp JR, Bloomer C, Noel-Macdonnell J, Cheng N. Transcriptome analysis reveals differences in cell cycle, growth and migration related genes that distinguish fibroblasts derived from pre-invasive and invasive breast cancer. Front Oncol. 2023;13:1130911. [RCA] [PubMed] [DOI] [Full Text] [Cited by in Crossref: 3] [Reference Citation Analysis (0)] |
| 12. | Langfelder P, Horvath S. WGCNA: an R package for weighted correlation network analysis. BMC Bioinformatics. 2008;9:559. [RCA] [PubMed] [DOI] [Full Text] [Full Text (PDF)] [Cited by in Crossref: 10254] [Cited by in RCA: 16478] [Article Influence: 969.3] [Reference Citation Analysis (0)] |
| 13. | Zheng H, Liu H, Li H, Dou W, Wang X. Weighted Gene Co-expression Network Analysis Identifies a Cancer-Associated Fibroblast Signature for Predicting Prognosis and Therapeutic Responses in Gastric Cancer. Front Mol Biosci. 2021;8:744677. [RCA] [PubMed] [DOI] [Full Text] [Full Text (PDF)] [Cited by in Crossref: 6] [Cited by in RCA: 51] [Article Influence: 12.8] [Reference Citation Analysis (0)] |
| 14. | Liu B, Chen X, Zhan Y, Wu B, Pan S. Identification of a Gene Signature for Renal Cell Carcinoma-Associated Fibroblasts Mediating Cancer Progression and Affecting Prognosis. Front Cell Dev Biol. 2020;8:604627. [RCA] [PubMed] [DOI] [Full Text] [Full Text (PDF)] [Cited by in Crossref: 26] [Cited by in RCA: 32] [Article Influence: 8.0] [Reference Citation Analysis (0)] |
| 15. | Harrow J, Frankish A, Gonzalez JM, Tapanari E, Diekhans M, Kokocinski F, Aken BL, Barrell D, Zadissa A, Searle S, Barnes I, Bignell A, Boychenko V, Hunt T, Kay M, Mukherjee G, Rajan J, Despacio-Reyes G, Saunders G, Steward C, Harte R, Lin M, Howald C, Tanzer A, Derrien T, Chrast J, Walters N, Balasubramanian S, Pei B, Tress M, Rodriguez JM, Ezkurdia I, van Baren J, Brent M, Haussler D, Kellis M, Valencia A, Reymond A, Gerstein M, Guigó R, Hubbard TJ. GENCODE: the reference human genome annotation for The ENCODE Project. Genome Res. 2012;22:1760-1774. [RCA] [PubMed] [DOI] [Full Text] [Full Text (PDF)] [Cited by in Crossref: 3435] [Cited by in RCA: 3427] [Article Influence: 285.6] [Reference Citation Analysis (0)] |
| 16. | Wu SZ, Al-Eryani G, Roden DL, Junankar S, Harvey K, Andersson A, Thennavan A, Wang C, Torpy JR, Bartonicek N, Wang T, Larsson L, Kaczorowski D, Weisenfeld NI, Uytingco CR, Chew JG, Bent ZW, Chan CL, Gnanasambandapillai V, Dutertre CA, Gluch L, Hui MN, Beith J, Parker A, Robbins E, Segara D, Cooper C, Mak C, Chan B, Warrier S, Ginhoux F, Millar E, Powell JE, Williams SR, Liu XS, O'Toole S, Lim E, Lundeberg J, Perou CM, Swarbrick A. A single-cell and spatially resolved atlas of human breast cancers. Nat Genet. 2021;53:1334-1347. [RCA] [PubMed] [DOI] [Full Text] [Cited by in Crossref: 160] [Cited by in RCA: 841] [Article Influence: 210.3] [Reference Citation Analysis (0)] |
| 17. | Newman AM, Liu CL, Green MR, Gentles AJ, Feng W, Xu Y, Hoang CD, Diehn M, Alizadeh AA. Robust enumeration of cell subsets from tissue expression profiles. Nat Methods. 2015;12:453-457. [RCA] [PubMed] [DOI] [Full Text] [Full Text (PDF)] [Cited by in Crossref: 4763] [Cited by in RCA: 8922] [Article Influence: 892.2] [Reference Citation Analysis (0)] |
| 18. | Yoshihara K, Shahmoradgoli M, Martínez E, Vegesna R, Kim H, Torres-Garcia W, Treviño V, Shen H, Laird PW, Levine DA, Carter SL, Getz G, Stemke-Hale K, Mills GB, Verhaak RG. Inferring tumour purity and stromal and immune cell admixture from expression data. Nat Commun. 2013;4:2612. [RCA] [PubMed] [DOI] [Full Text] [Full Text (PDF)] [Cited by in Crossref: 3056] [Cited by in RCA: 6454] [Article Influence: 586.7] [Reference Citation Analysis (0)] |
| 19. | Yu G, Wang LG, Han Y, He QY. clusterProfiler: an R package for comparing biological themes among gene clusters. OMICS. 2012;16:284-287. [RCA] [PubMed] [DOI] [Full Text] [Cited by in Crossref: 11591] [Cited by in RCA: 22263] [Article Influence: 1712.5] [Reference Citation Analysis (0)] |
| 20. | Liberzon A, Birger C, Thorvaldsdóttir H, Ghandi M, Mesirov JP, Tamayo P. The Molecular Signatures Database (MSigDB) hallmark gene set collection. Cell Syst. 2015;1:417-425. [RCA] [PubMed] [DOI] [Full Text] [Cited by in Crossref: 4238] [Cited by in RCA: 8409] [Article Influence: 840.9] [Reference Citation Analysis (0)] |
| 21. | Hänzelmann S, Castelo R, Guinney J. GSVA: gene set variation analysis for microarray and RNA-seq data. BMC Bioinformatics. 2013;14:7. [RCA] [PubMed] [DOI] [Full Text] [Full Text (PDF)] [Cited by in Crossref: 7222] [Cited by in RCA: 9296] [Article Influence: 774.7] [Reference Citation Analysis (0)] |
| 22. | Wang N, Zhang H, Li D, Jiang C, Zhao H, Teng Y. Identification of novel biomarkers in breast cancer via integrated bioinformatics analysis and experimental validation. Bioengineered. 2021;12:12431-12446. [RCA] [PubMed] [DOI] [Full Text] [Full Text (PDF)] [Cited by in Crossref: 16] [Cited by in RCA: 16] [Article Influence: 4.0] [Reference Citation Analysis (0)] |
| 23. | Wang X, Li G, Zhang Y, Li L, Qiu L, Qian Z, Zhou S, Wang X, Li Q, Zhang H. Pan-Cancer Analysis Reveals Genomic and Clinical Characteristics of TRPV Channel-Related Genes. Front Oncol. 2022;12:813100. [RCA] [PubMed] [DOI] [Full Text] [Full Text (PDF)] [Cited by in Crossref: 1] [Cited by in RCA: 14] [Article Influence: 4.7] [Reference Citation Analysis (0)] |
| 24. | Kechagia JZ, Ivaska J, Roca-Cusachs P. Integrins as biomechanical sensors of the microenvironment. Nat Rev Mol Cell Biol. 2019;20:457-473. [RCA] [PubMed] [DOI] [Full Text] [Cited by in Crossref: 455] [Cited by in RCA: 812] [Article Influence: 162.4] [Reference Citation Analysis (0)] |
| 25. | Mohammadi H, Sahai E. Mechanisms and impact of altered tumour mechanics. Nat Cell Biol. 2018;20:766-774. [RCA] [PubMed] [DOI] [Full Text] [Cited by in Crossref: 115] [Cited by in RCA: 222] [Article Influence: 31.7] [Reference Citation Analysis (0)] |
| 26. | Shan T, Chen S, Chen X, Lin WR, Li W, Ma J, Wu T, Ji H, Li Y, Cui X, Kang Y. Prometastatic mechanisms of CAF-mediated EMT regulation in pancreatic cancer cells. Int J Oncol. 2017;50:121-128. [RCA] [PubMed] [DOI] [Full Text] [Cited by in Crossref: 21] [Cited by in RCA: 34] [Article Influence: 3.8] [Reference Citation Analysis (0)] |
| 27. | Herrera M, Berral-González A, López-Cade I, Galindo-Pumariño C, Bueno-Fortes S, Martín-Merino M, Carrato A, Ocaña A, De La Pinta C, López-Alfonso A, Peña C, García-Barberán V, De Las Rivas J. Cancer-associated fibroblast-derived gene signatures determine prognosis in colon cancer patients. Mol Cancer. 2021;20:73. [RCA] [PubMed] [DOI] [Full Text] [Full Text (PDF)] [Cited by in Crossref: 10] [Cited by in RCA: 69] [Article Influence: 17.3] [Reference Citation Analysis (0)] |
| 28. | Zhang Z, Liang Z, Li D, Wang L, Chen Y, Liang Y, Jiao W, Niu H. Development of a CAFs-related gene signature to predict survival and drug response in bladder cancer. Hum Cell. 2022;35:649-664. [RCA] [PubMed] [DOI] [Full Text] [Cited by in Crossref: 1] [Cited by in RCA: 8] [Article Influence: 2.7] [Reference Citation Analysis (0)] |
| 29. | Monteran L, Erez N. The Dark Side of Fibroblasts: Cancer-Associated Fibroblasts as Mediators of Immunosuppression in the Tumor Microenvironment. Front Immunol. 2019;10:1835. [RCA] [PubMed] [DOI] [Full Text] [Full Text (PDF)] [Cited by in Crossref: 266] [Cited by in RCA: 484] [Article Influence: 80.7] [Reference Citation Analysis (0)] |
| 30. | Wu X, Zhou Z, Xu S, Liao C, Chen X, Li B, Peng J, Li D, Yang L. Extracellular vesicle packaged LMP1-activated fibroblasts promote tumor progression via autophagy and stroma-tumor metabolism coupling. Cancer Lett. 2020;478:93-106. [RCA] [PubMed] [DOI] [Full Text] [Cited by in Crossref: 48] [Cited by in RCA: 105] [Article Influence: 21.0] [Reference Citation Analysis (0)] |
| 31. | Puram SV, Tirosh I, Parikh AS, Patel AP, Yizhak K, Gillespie S, Rodman C, Luo CL, Mroz EA, Emerick KS, Deschler DG, Varvares MA, Mylvaganam R, Rozenblatt-Rosen O, Rocco JW, Faquin WC, Lin DT, Regev A, Bernstein BE. Single-Cell Transcriptomic Analysis of Primary and Metastatic Tumor Ecosystems in Head and Neck Cancer. Cell. 2017;171:1611-1624.e24. [RCA] [PubMed] [DOI] [Full Text] [Cited by in Crossref: 1072] [Cited by in RCA: 1679] [Article Influence: 209.9] [Reference Citation Analysis (0)] |
| 32. | Qian J, Olbrecht S, Boeckx B, Vos H, Laoui D, Etlioglu E, Wauters E, Pomella V, Verbandt S, Busschaert P, Bassez A, Franken A, Bempt MV, Xiong J, Weynand B, van Herck Y, Antoranz A, Bosisio FM, Thienpont B, Floris G, Vergote I, Smeets A, Tejpar S, Lambrechts D. A pan-cancer blueprint of the heterogeneous tumor microenvironment revealed by single-cell profiling. Cell Res. 2020;30:745-762. [RCA] [PubMed] [DOI] [Full Text] [Full Text (PDF)] [Cited by in Crossref: 161] [Cited by in RCA: 472] [Article Influence: 94.4] [Reference Citation Analysis (0)] |
| 33. | Öhlund D, Handly-Santana A, Biffi G, Elyada E, Almeida AS, Ponz-Sarvise M, Corbo V, Oni TE, Hearn SA, Lee EJ, Chio II, Hwang CI, Tiriac H, Baker LA, Engle DD, Feig C, Kultti A, Egeblad M, Fearon DT, Crawford JM, Clevers H, Park Y, Tuveson DA. Distinct populations of inflammatory fibroblasts and myofibroblasts in pancreatic cancer. J Exp Med. 2017;214:579-596. [RCA] [PubMed] [DOI] [Full Text] [Full Text (PDF)] [Cited by in Crossref: 1020] [Cited by in RCA: 1760] [Article Influence: 220.0] [Reference Citation Analysis (0)] |
| 34. | Elyada E, Bolisetty M, Laise P, Flynn WF, Courtois ET, Burkhart RA, Teinor JA, Belleau P, Biffi G, Lucito MS, Sivajothi S, Armstrong TD, Engle DD, Yu KH, Hao Y, Wolfgang CL, Park Y, Preall J, Jaffee EM, Califano A, Robson P, Tuveson DA. Cross-Species Single-Cell Analysis of Pancreatic Ductal Adenocarcinoma Reveals Antigen-Presenting Cancer-Associated Fibroblasts. Cancer Discov. 2019;9:1102-1123. [RCA] [PubMed] [DOI] [Full Text] [Cited by in Crossref: 602] [Cited by in RCA: 1375] [Article Influence: 229.2] [Reference Citation Analysis (0)] |
| 35. | Biffi G, Oni TE, Spielman B, Hao Y, Elyada E, Park Y, Preall J, Tuveson DA. IL1-Induced JAK/STAT Signaling Is Antagonized by TGFβ to Shape CAF Heterogeneity in Pancreatic Ductal Adenocarcinoma. Cancer Discov. 2019;9:282-301. [RCA] [PubMed] [DOI] [Full Text] [Cited by in Crossref: 476] [Cited by in RCA: 921] [Article Influence: 131.6] [Reference Citation Analysis (0)] |
| 36. | Wang Y, Lv W, Yi Y, Zhang Q, Zhang J, Wu Y. A novel signature based on cancer-associated fibroblast genes to predict prognosis, immune feature, and therapeutic response in breast cancer. Aging (Albany NY). 2023;15:3480-3497. [RCA] [PubMed] [DOI] [Full Text] [Cited by in Crossref: 1] [Reference Citation Analysis (0)] |
| 37. | Huang B, Chen Q, Ye Z, Zeng L, Huang C, Xie Y, Zhang R, Shen H. Construction of a Matrix Cancer-Associated Fibroblast Signature Gene-Based Risk Prognostic Signature for Directing Immunotherapy in Patients with Breast Cancer Using Single-Cell Analysis and Machine Learning. Int J Mol Sci. 2023;24. [RCA] [PubMed] [DOI] [Full Text] [Cited by in RCA: 6] [Reference Citation Analysis (0)] |
| 38. | Xu A, Xu XN, Luo Z, Huang X, Gong RQ, Fu DY. Identification of prognostic cancer-associated fibroblast markers in luminal breast cancer using weighted gene co-expression network analysis. Front Oncol. 2023;13:1191660. [RCA] [PubMed] [DOI] [Full Text] [Full Text (PDF)] [Cited by in RCA: 7] [Reference Citation Analysis (0)] |
| 39. | Li Z, Yu X, Werner J, Bazhin AV, D'Haese JG. The role of interleukin-18 in pancreatitis and pancreatic cancer. Cytokine Growth Factor Rev. 2019;50:1-12. [RCA] [PubMed] [DOI] [Full Text] [Cited by in Crossref: 14] [Cited by in RCA: 44] [Article Influence: 7.3] [Reference Citation Analysis (0)] |
| 40. | Ma T, Kong M. Interleukin-18 and -10 may be associated with lymph node metastasis in breast cancer. Oncol Lett. 2021;21:253. [RCA] [PubMed] [DOI] [Full Text] [Full Text (PDF)] [Cited by in RCA: 8] [Reference Citation Analysis (0)] |
| 41. | Szekely B, Bossuyt V, Li X, Wali VB, Patwardhan GA, Frederick C, Silber A, Park T, Harigopal M, Pelekanou V, Zhang M, Yan Q, Rimm DL, Bianchini G, Hatzis C, Pusztai L. Immunological differences between primary and metastatic breast cancer. Ann Oncol. 2018;29:2232-2239. [RCA] [PubMed] [DOI] [Full Text] [Cited by in Crossref: 158] [Cited by in RCA: 162] [Article Influence: 23.1] [Reference Citation Analysis (0)] |
| 42. | Rasmussen LM, Frederiksen KS, Din N, Galsgaard E, Christensen L, Berchtold MW, Panina S. Prolactin and oestrogen synergistically regulate gene expression and proliferation of breast cancer cells. Endocr Relat Cancer. 2010;17:809-822. [RCA] [PubMed] [DOI] [Full Text] [Cited by in Crossref: 47] [Cited by in RCA: 55] [Article Influence: 3.7] [Reference Citation Analysis (0)] |
| 43. | Degen M, Brellier F, Kain R, Ruiz C, Terracciano L, Orend G, Chiquet-Ehrismann R. Tenascin-W is a novel marker for activated tumor stroma in low-grade human breast cancer and influences cell behavior. Cancer Res. 2007;67:9169-9179. [RCA] [PubMed] [DOI] [Full Text] [Cited by in Crossref: 61] [Cited by in RCA: 56] [Article Influence: 3.1] [Reference Citation Analysis (0)] |
| 44. | Montagner M, Enzo E, Forcato M, Zanconato F, Parenti A, Rampazzo E, Basso G, Leo G, Rosato A, Bicciato S, Cordenonsi M, Piccolo S. SHARP1 suppresses breast cancer metastasis by promoting degradation of hypoxia-inducible factors. Nature. 2012;487:380-384. [RCA] [PubMed] [DOI] [Full Text] [Cited by in Crossref: 173] [Cited by in RCA: 210] [Article Influence: 16.2] [Reference Citation Analysis (0)] |
| 45. | Lampis A, Carotenuto P, Vlachogiannis G, Cascione L, Hedayat S, Burke R, Clarke P, Bosma E, Simbolo M, Scarpa A, Yu S, Cole R, Smyth E, Mateos JF, Begum R, Hezelova B, Eltahir Z, Wotherspoon A, Fotiadis N, Bali MA, Nepal C, Khan K, Stubbs M, Hahne JC, Gasparini P, Guzzardo V, Croce CM, Eccles S, Fassan M, Cunningham D, Andersen JB, Workman P, Valeri N, Braconi C. MIR21 Drives Resistance to Heat Shock Protein 90 Inhibition in Cholangiocarcinoma. Gastroenterology. 2018;154:1066-1079.e5. [RCA] [PubMed] [DOI] [Full Text] [Full Text (PDF)] [Cited by in Crossref: 95] [Cited by in RCA: 95] [Article Influence: 13.6] [Reference Citation Analysis (0)] |
| 46. | Ghoorun RA, Wu XH, Chen HL, Ren DL, Wu XB. Prognostic Significance of FKBP14 in Gastric Cancer. Onco Targets Ther. 2019;12:11567-11577. [RCA] [PubMed] [DOI] [Full Text] [Full Text (PDF)] [Cited by in Crossref: 2] [Cited by in RCA: 3] [Article Influence: 0.5] [Reference Citation Analysis (0)] |
| 47. | Lu M, Miao Y, Qi L, Bai M, Zhang J, Feng Y. RNAi-Mediated Downregulation of FKBP14 Suppresses the Growth of Human Ovarian Cancer Cells. Oncol Res. 2016;23:267-274. [RCA] [PubMed] [DOI] [Full Text] [Full Text (PDF)] [Cited by in Crossref: 7] [Cited by in RCA: 12] [Article Influence: 1.5] [Reference Citation Analysis (0)] |


