Published online Aug 26, 2024. doi: 10.12998/wjcc.v12.i24.5568
Revised: May 21, 2024
Accepted: June 12, 2024
Published online: August 26, 2024
Processing time: 93 Days and 1.6 Hours
Hepatocellular carcinoma (HCC) is the most common subtype of liver cancer. The primary treatment strategies for HCC currently include liver transplantation and surgical resection. However, these methods often yield unsatisfactory outcomes, leading to a poor prognosis for many patients. This underscores the urgent need to identify and evaluate novel therapeutic targets that can improve the prognosis and survival rate of HCC patients.
To construct a radiomics model that can accurately predict the EZH2 expression in HCC.
Gene expression, clinical parameters, HCC-related radiomics, and fibroblast-related genes were acquired from public databases. A gene model was developed, and its clinical efficacy was assessed statistically. Drug sensitivity analysis was conducted with identified hub genes. Radiomics features were extracted and machine learning algorithms were employed to generate a radiomics model related to the hub genes. A nomogram was used to illustrate the prognostic significance of the computed Radscore and the hub genes in the context of HCC patient outcomes.
EZH2 and NRAS were independent predictors for prognosis of HCC and were utilized to construct a predictive gene model. This model demonstrated robust performance in diagnosing HCC and predicted an unfavorable prognosis. A negative correlation was observed between EZH2 expression and drug sensitivity. Elevated EZH2 expression was linked to poorer prognosis, and its diagnostic value in HCC surpassed that of the risk model. A radiomics model, developed using a logistic algorithm, also showed superior efficiency in predicting EZH2 expression. The Radscore was higher in the group with high EZH2 expression. A nomogram was constructed to visually demonstrate the significant roles of the radiomics model and EZH2 expression in predicting the overall survival of HCC patients.
EZH2 plays significant roles in diagnosing HCC and therapeutic efficacy. A radiomics model, developed using a logistic algorithm, efficiently predicted EZH2 expression and exhibited strong correlation with HCC prognosis.
Core Tip: This study integrated radiomics molecular analysis based on computed tomography images. It aimed to identify important molecular biomarkers associated with hepatocellular carcinoma (HCC), particularly EZH2, and establish a radiomics model to predict EZH2 expression and its association with the prognosis of HCC patients. The results of this study demonstrated a close correlation between the radiomics model, EZH2 expression, and HCC patient prognosis, suggesting that a radiomics analysis can provide additional molecular information and offer a new approach to clinical treatment of HCC.
- Citation: Yu TY, Zhan ZJ, Lin Q, Huang ZH. Computed tomography-based radiomics predicts the fibroblast-related gene EZH2 expression level and survival of hepatocellular carcinoma. World J Clin Cases 2024; 12(24): 5568-5582
- URL: https://www.wjgnet.com/2307-8960/full/v12/i24/5568.htm
- DOI: https://dx.doi.org/10.12998/wjcc.v12.i24.5568
Liver cancer, a highly heterogeneous and malignant tumor associated with the digestive system, is the fourth-leading cause of cancer-related fatalities worldwide[1,2]. Hepatocellular carcinoma (HCC), the most common subtype of liver cancer, accounts for over 75% of all cases[3]. In China, HCC is responsible for the second-highest cancer mortality rate. This is due to various factors including historical, demographic, and health conditions[4]. Major contributors to the development of HCC include chronic infection with hepatitis B virus or hepatitis C virus, excessive alcohol consumption, and liver fibrosis[5]. Presently, the major treatment strategies for HCC are liver transplantation and surgical resection, but these methods often yield unsatisfactory outcomes[6]. This underscores the urgent need to identify novel therapeutic targets that can improve the prognosis and overall survival (OS) rate of HCC patients.
Persistent liver damage and fibrosis are significant risk factors for HCC development[7]. Research indicates that most HCC patients had preexisting cirrhosis, with approximately one-third of these cirrhosis patients eventually developing HCC[8]. Moreover, the tumor microenvironment (TME) has been shown to facilitate tumor progression[9]. In HCC, the interactions within the TME, composed of cancer-associated fibroblasts (CAFs), immune cells, endothelial cells, and HCC cells, significantly increase tumor proliferation, invasion, metastasis, and chemoresistance[9]. Additionally, CAFs, the primary component in TME stroma, have previously been shown to promote the aggressiveness of various cancers, including HCC[10,11].
Genetics plays a crucial role in understanding the structure and function of organisms and has been widely applied in various medical fields, including clinical diagnosis, drug development, and disease prediction. In this study, an enhancer of the EZH2 subunit was identified as a key fibroblast-related gene (FRG) in HCC. Furthermore, EZH2 demonstrated significant diagnostic value in HCC. As a core component of the polycomb repressive complex 2, EZH2 is involved in the onset and progression of various cancers, including prostate, breast, melanoma, bladder, and endometrial[12]. In malignant tumors, EZH2 suppresses the expression of numerous tumor suppressor genes, thereby facilitating carcinogenesis[13].
Radiomics, an emerging technological tool, transforms standard medical images into quantitative representations. By analyzing quantitative imaging features, radiomics has substantially lowered the cost of diagnosing diseases and the need for invasive surgeries[14]. Preoperative computed tomography (CT) radiomics is widely used for diagnosing, staging, and assessing the treatment efficacy in HCC, demonstrating robust evaluation and prediction capabilities[15].
In this study, FRGs were retrieved and used to develop a gene model associated with HCC prognosis through various bioinformatics analyses. The drug sensitivity analysis and molecular docking results highlighted the significant role of EZH2 in treating HCC patients. Subsequently, leveraging CT images, this study aimed to establish a radiomics model for predicting EZH2 expression levels, offering valuable insights for clinical HCC treatment.
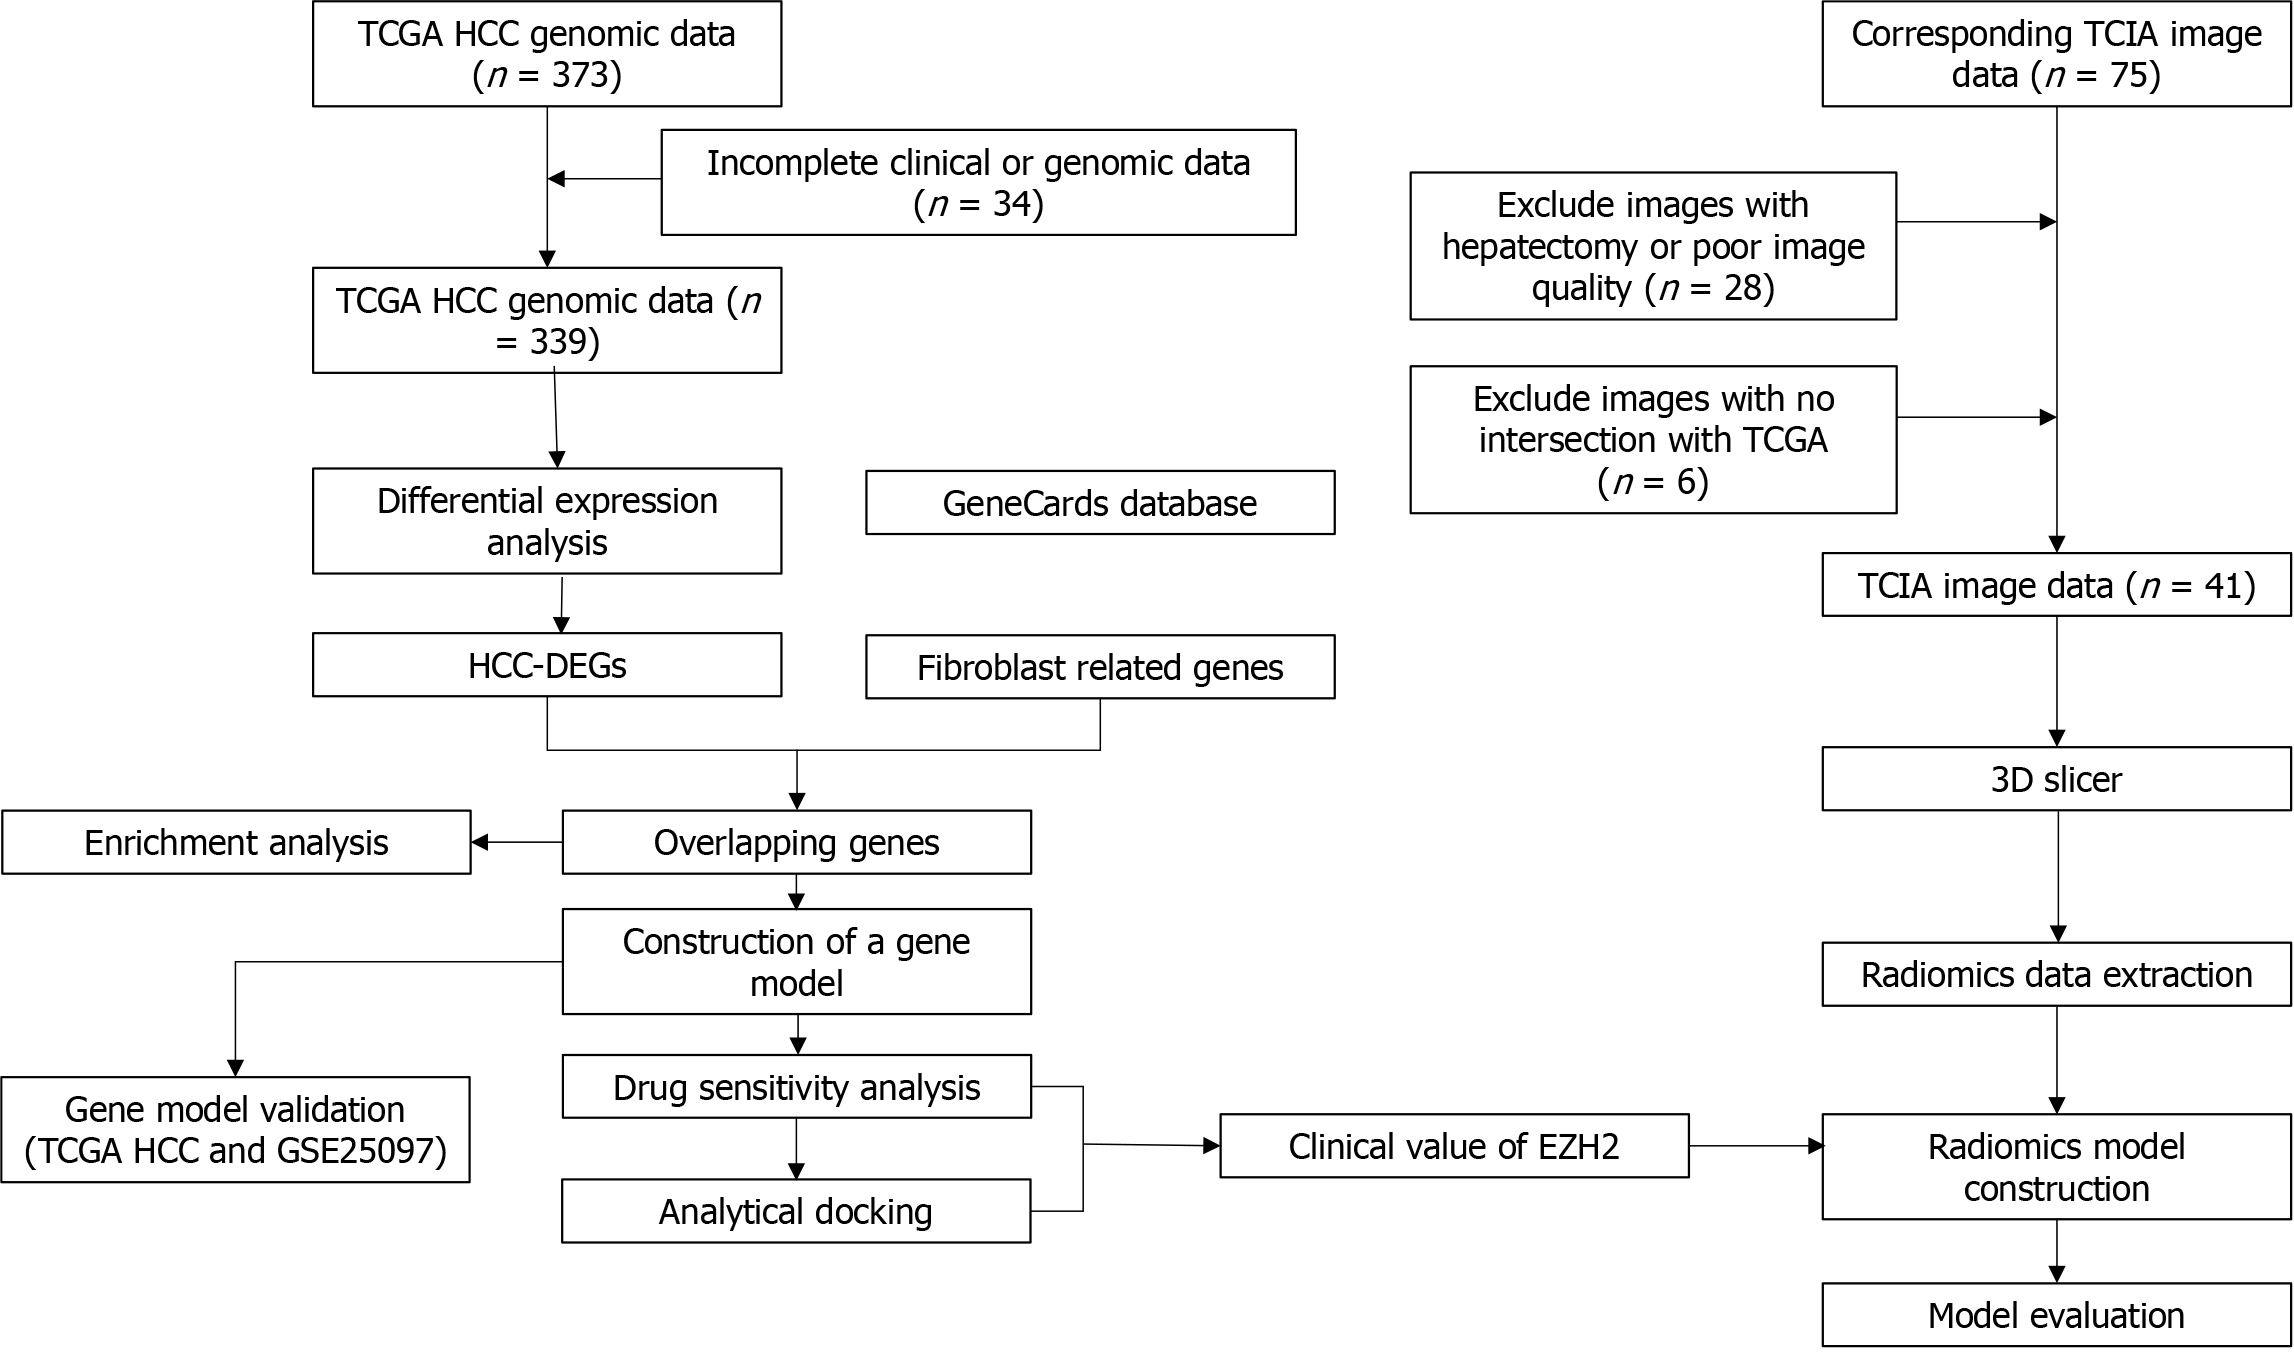
Figure 1 illustrates the research process undertaken in this study. RNA-seq data and clinicopathological information (age, sex, pathological stage, and grade) of HCC patients were retrieved from The Cancer Genome Atlas (TCGA) database (https://tcga-data.nci.nih.gov/tcga/). The samples without complete expression and clinical information in the TCGA-HCC dataset were excluded. Subsequently, HCC patient CT image data was downloaded from The Cancer Imaging Archive (TCIA) database (http://www.cancerimagingarchive.net). The TCIA data was carefully filtered to exclude any data that did not overlap with the TCGA data as well as CT images from tumor excision patients and those with poor image pixels. Ultimately, this study included 339 HCC tumor samples, 50 normal samples, and 41 imaging datasets. Notably, all tumor samples received radiation and pharmaceutical therapy. Additionally, the GSE25097 dataset, comprising 249 normal and 268 HCC samples, was retrieved from the Gene Expression Omnibus database, using the GPL10687 platform.
The GeneCard database (https://www.genecards.org/) was used to screen for FRGs, using the keyword “Fibroblast.” Next, differentially expressed genes (DEGs) between normal and tumor tissues in the TCGA-HCC dataset were identified using the limma package in R language, with a threshold setting of | log2 (Fold change) | > 2.0 and P < 0.05. Finally, Venn diagram analysis was used to identify FRGs that are DEGs in HCC.
Gene Ontology (GO) and Kyoto Encyclopedia of Genes and Genomes (KEGG) enrichment analyses were conducted on the FRGs differentially expressed in HCC, using the org.Hs.eg.db and clusterProfiler packages in R software. GO describes the function of all gene products in various organisms and identifies characteristic biological features of high-throughput genomes, including biological process, cellular component, and molecular function[16]. KEGG is a widely used database that stores information on genomes, biological pathways, diseases, and drugs.
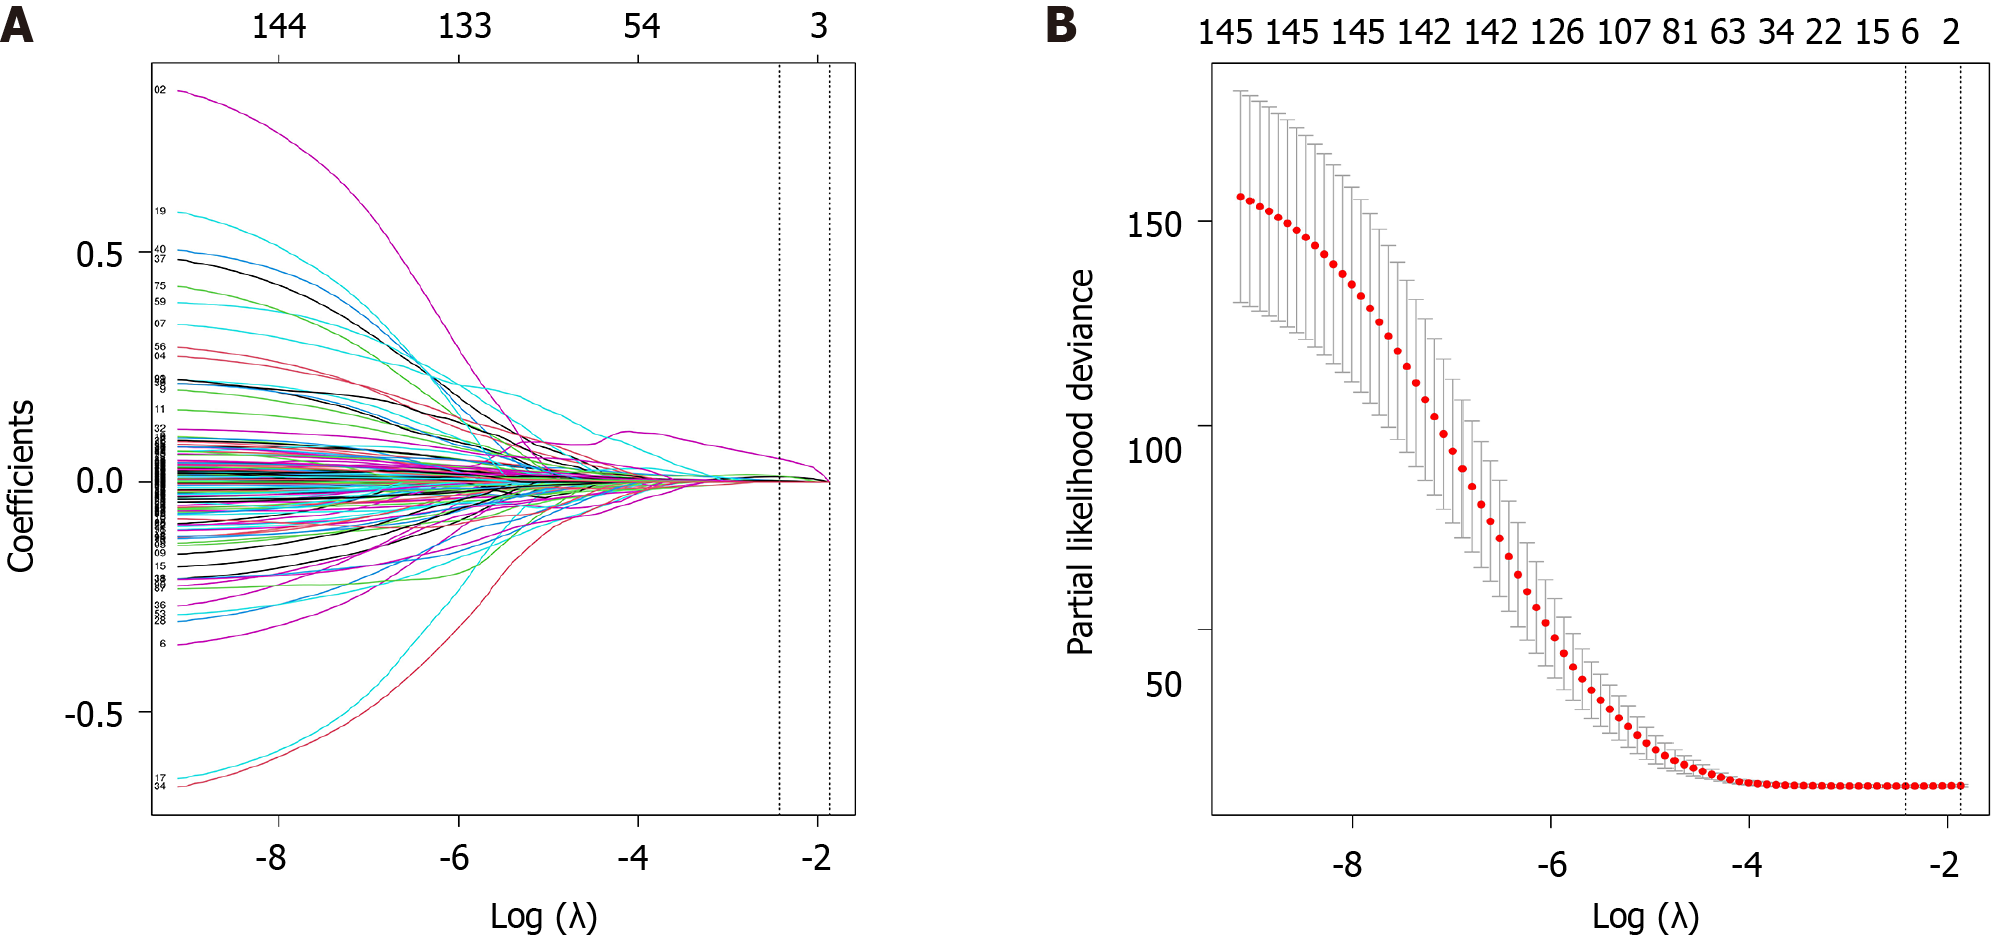
Firstly, least absolute shrinkage and selection operator regression analysis was performed on the differentially expressed FRGs using the glmnet package in R software to identify key genes associated with the OS of HCC patients from the TCGA dataset. Secondly, univariate and multivariate Cox regression analyses were conducted sequentially to identify genes significantly associated with HCC prognosis. Finally, based on the multivariate Cox regression analysis, an HCC prognostic gene model was established using the following formula: Risk score = gene exp1 × β1 + gene exp2 × β2 + ... + gene expn × βn, where “gene exp” represents the expression level of the gene, and β represents the corresponding coefficient of the multivariate Cox regression.
The receiver operating characteristic (ROC) curve analysis was performed on the TCGA and GSE25097 HCC datasets using the R package pROC. This was to assess the diagnostic efficacy of the gene model. Kaplan-Meier analysis of the risk score and OS in the TCGA data was conducted using the survival package and visualized using the survminer package in R software. Additionally, R software generated a forest plot to determine the relationship between the gene risk score and HCC prognosis across different clinical feature groups. Multivariate Cox regression analysis was employed to verify the independent prognostic value of the risk score.
The Cancer Therapeutics Response Portal database contains data on the sensitivity of different tumor cells to various chemotherapy drugs. The database was used to calculate the sensitivity of genes to different chemotherapy drugs with the help of the oncoprdict package in R software. Then, the crystal structures of these genes were obtained from the Research Collaboratory for Structural Bioinformatics database (https://www.rcsb). The binding efficiency of genes with crucial chemotherapy drugs was analyzed using the Autodock software (Version 4.2.6). A binding energy l ≤ -1.5 kcal/mol indicates a good binding effect[17].
The entire tumor region was manually delineated by two radiologists using 3D Slicer (Version 5.4.0) who also independently described the lesions without knowledge of the patient’s clinical details. The pyradiomics package in Python software was used for radiomics feature extraction and data normalization. A total of 837 radiomics features were acquired, including first-order features, shape, and texture.
The intraclass correlation coefficient was calculated using the R “irr” package to evaluate the consistency of the extracted radiomics features based on the region of interest outlined by the two radiologists. Intraclass correlation coefficient values ≥ 0.75 indicated good consistency, 0.51-0.74 indicated moderate consistency, and ≤ 0.50 indicated poor consistency[18].
The TCIA image data related to HCC were divided into two groups based on the median expression level of EZH2. Radiomics features related to EZH2 were selected using the XG Boost package in Python. Feature importance analysis was conducted using multiple machine learning algorithms to identify radiomics features closely associated with EZH2.
Two radiomics models related to EZH2, specifically logistic regression and random forest models, were constructed using multiple machine learning algorithms. A comprehensive multimodel analysis was conducted to determine the radiomics model with superior performance in predicting EZH2. Subsequently, a restricted cubic spline analysis was executed on the Radscore and EZH2 using the rms package in R software to predict their nonlinear relationship. Ultimately, a nomogram was constructed to evaluate the correlation of EZH2 and Radscore and the prognosis of HCC patients.
Data analysis and visualization were performed using R (Version 4.2.2) and Python (Version 3.6.6). Quantitative data was expressed as mean ± standard deviation, median, or quartile. The Student’s t-test or Wilcoxon test was employed to analyze comparisons between groups. Categorical variables were represented as counts and percentages, and group comparisons were performed using the χ2 test. The Delong test was used to compare the differences in area under the curve (AUC) values. A P value of less than 0.05 was considered statistically significant.
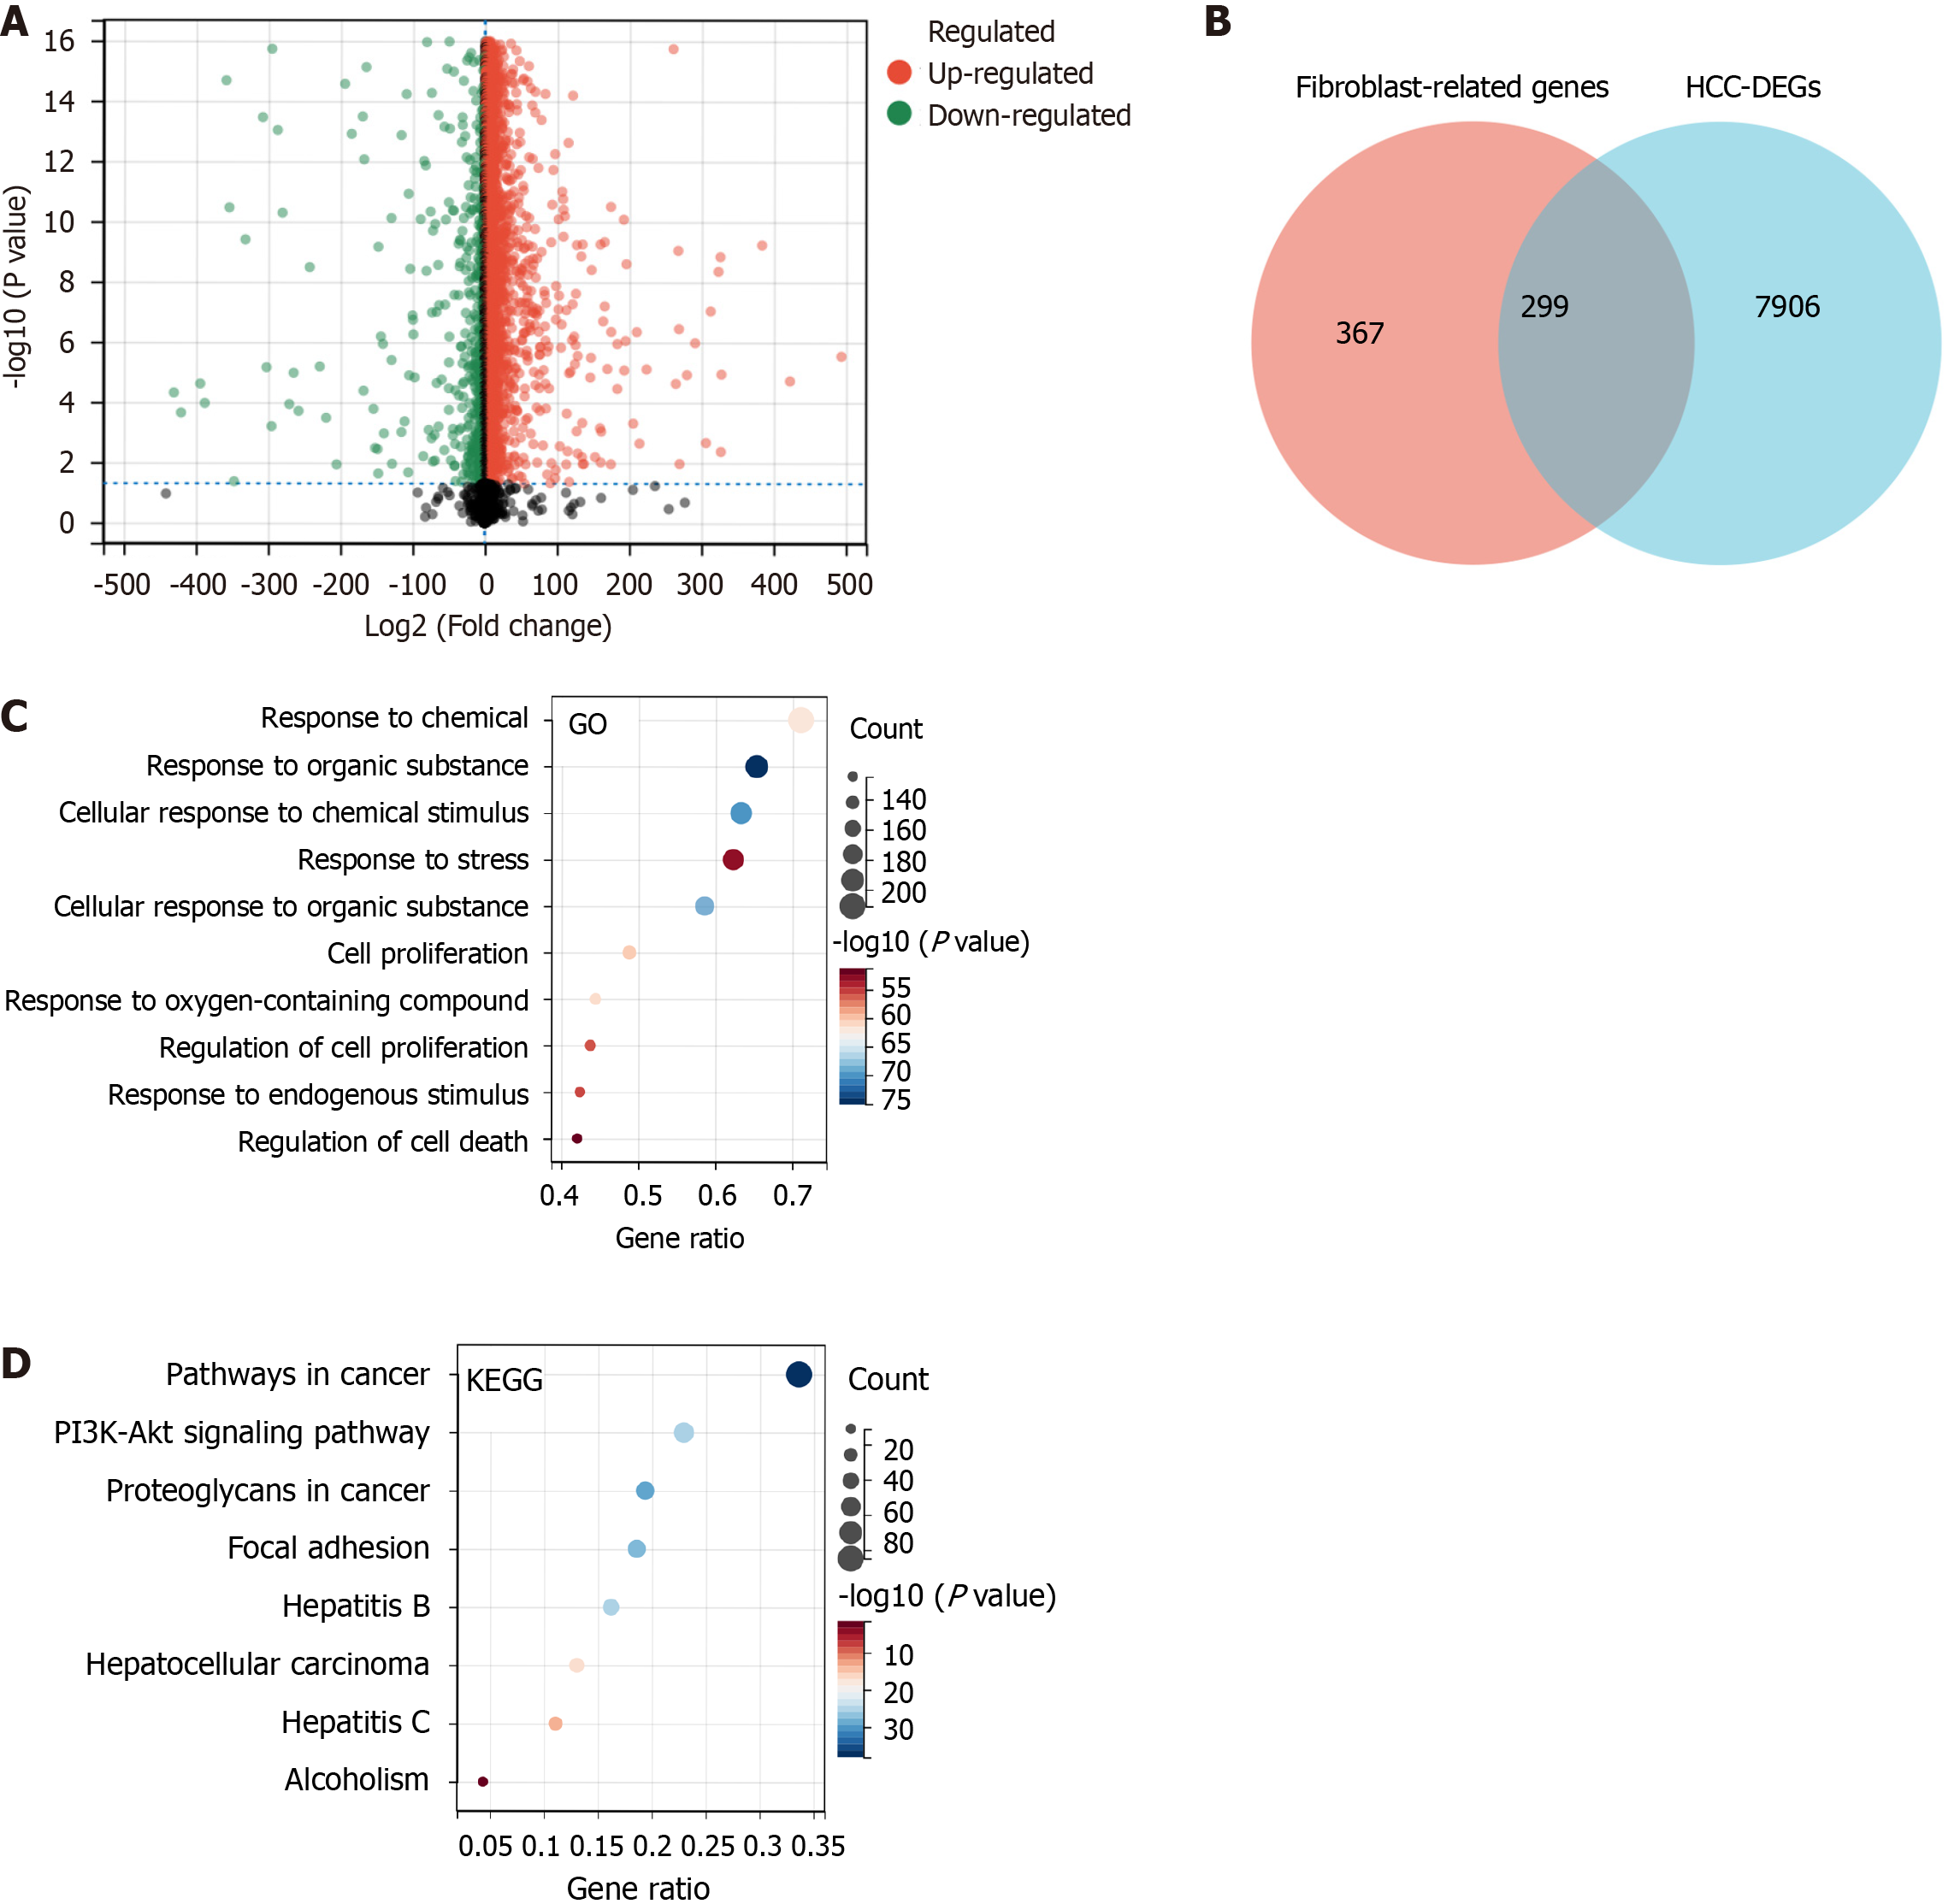
Initially, 144247 FRGs were extracted from the GeneCards database, but this was narrowed down to 666 FRGs based on a threshold score ≥ 5. A differential analysis of the HCC data revealed 8205 DEGs between HCC and normal tissues, which included 7366 upregulated genes and 839 downregulated genes (P < 0.05, Figure 2A). A total of 299 FRGs were identified to be differentially expressed in HCC (Figure 2B).
The biological processes that differentially expressed FRGs are a part of were identified by enrichment analysis in GO. The analysis revealed that these genes were primarily a part of various stimuli response pathways, such as chemicals, organic substances, and stress. Some were also involved in cell proliferation (Figure 2C). KEGG enrichment analysis revealed that the differentially expressed FRGs were primarily associated with pathways known to play a role in cancer pathogenesis and survival, such as PI3K-Akt signaling pathway, proteoglycans in cancer, focal adhesion, hepatitis B, HCC, and hepatitis C alcoholism (Figure 2D). These pathways are closely related to the onset and development of tumors.
To construct a gene model associated with HCC prognosis, a sequence of analyses was conducted, including least absolute shrinkage and selection operator regression analysis as well as univariate and multivariate Cox regression. Among the 299 differentially expressed FRGs, 7 genes were significantly associated with the OS of HCC patients (Figure 3). Furthermore, EZH2 and NRAS were found to independently predict the prognosis of HCC patients (P < 0.05, Table 1). The gene model was constructed based on the outcomes of the multivariate Cox regression analysis using the formula: Risk score = 0.083 × EZH2 + 0.03 × NRAS.
| Characteristic | Total, n | Univariate analysis | Multivariate analysis | ||
| Hazard ratio (95%CI) | P value | Hazard ratio (95%CI) | P value | ||
| ATIC | 339 | 1.042 (1.027-1.058) | < 0.001 | 1.011 (0.989-1.033) | 0.348 |
| EZH2 | 339 | 1.196 (1.128-1.269) | < 0.001 | 1.087 (1.006-1.174) | 0.035 |
| HDGF | 339 | 1.010 (1.006-1.014) | < 0.001 | 1.004 (0.999-1.026) | 0.104 |
| HEXB | 339 | 1.027 (1.014-1.039) | < 0.001 | 1.013 (0.999-1.026) | 0.060 |
| HSPA4 | 339 | 1.040 (1.023-1.058) | < 0.001 | 1.017 (0.996-1.039) | 0.117 |
| NRAS | 339 | 1.066 (1.042-1.091) | < 0.001 | 1.031 (1.003-1.059) | 0.032 |
| PPT1 | 339 | 1.030 (1.019-1.041) | < 0.001 | 1.004 (0.988-1.020) | 0.665 |
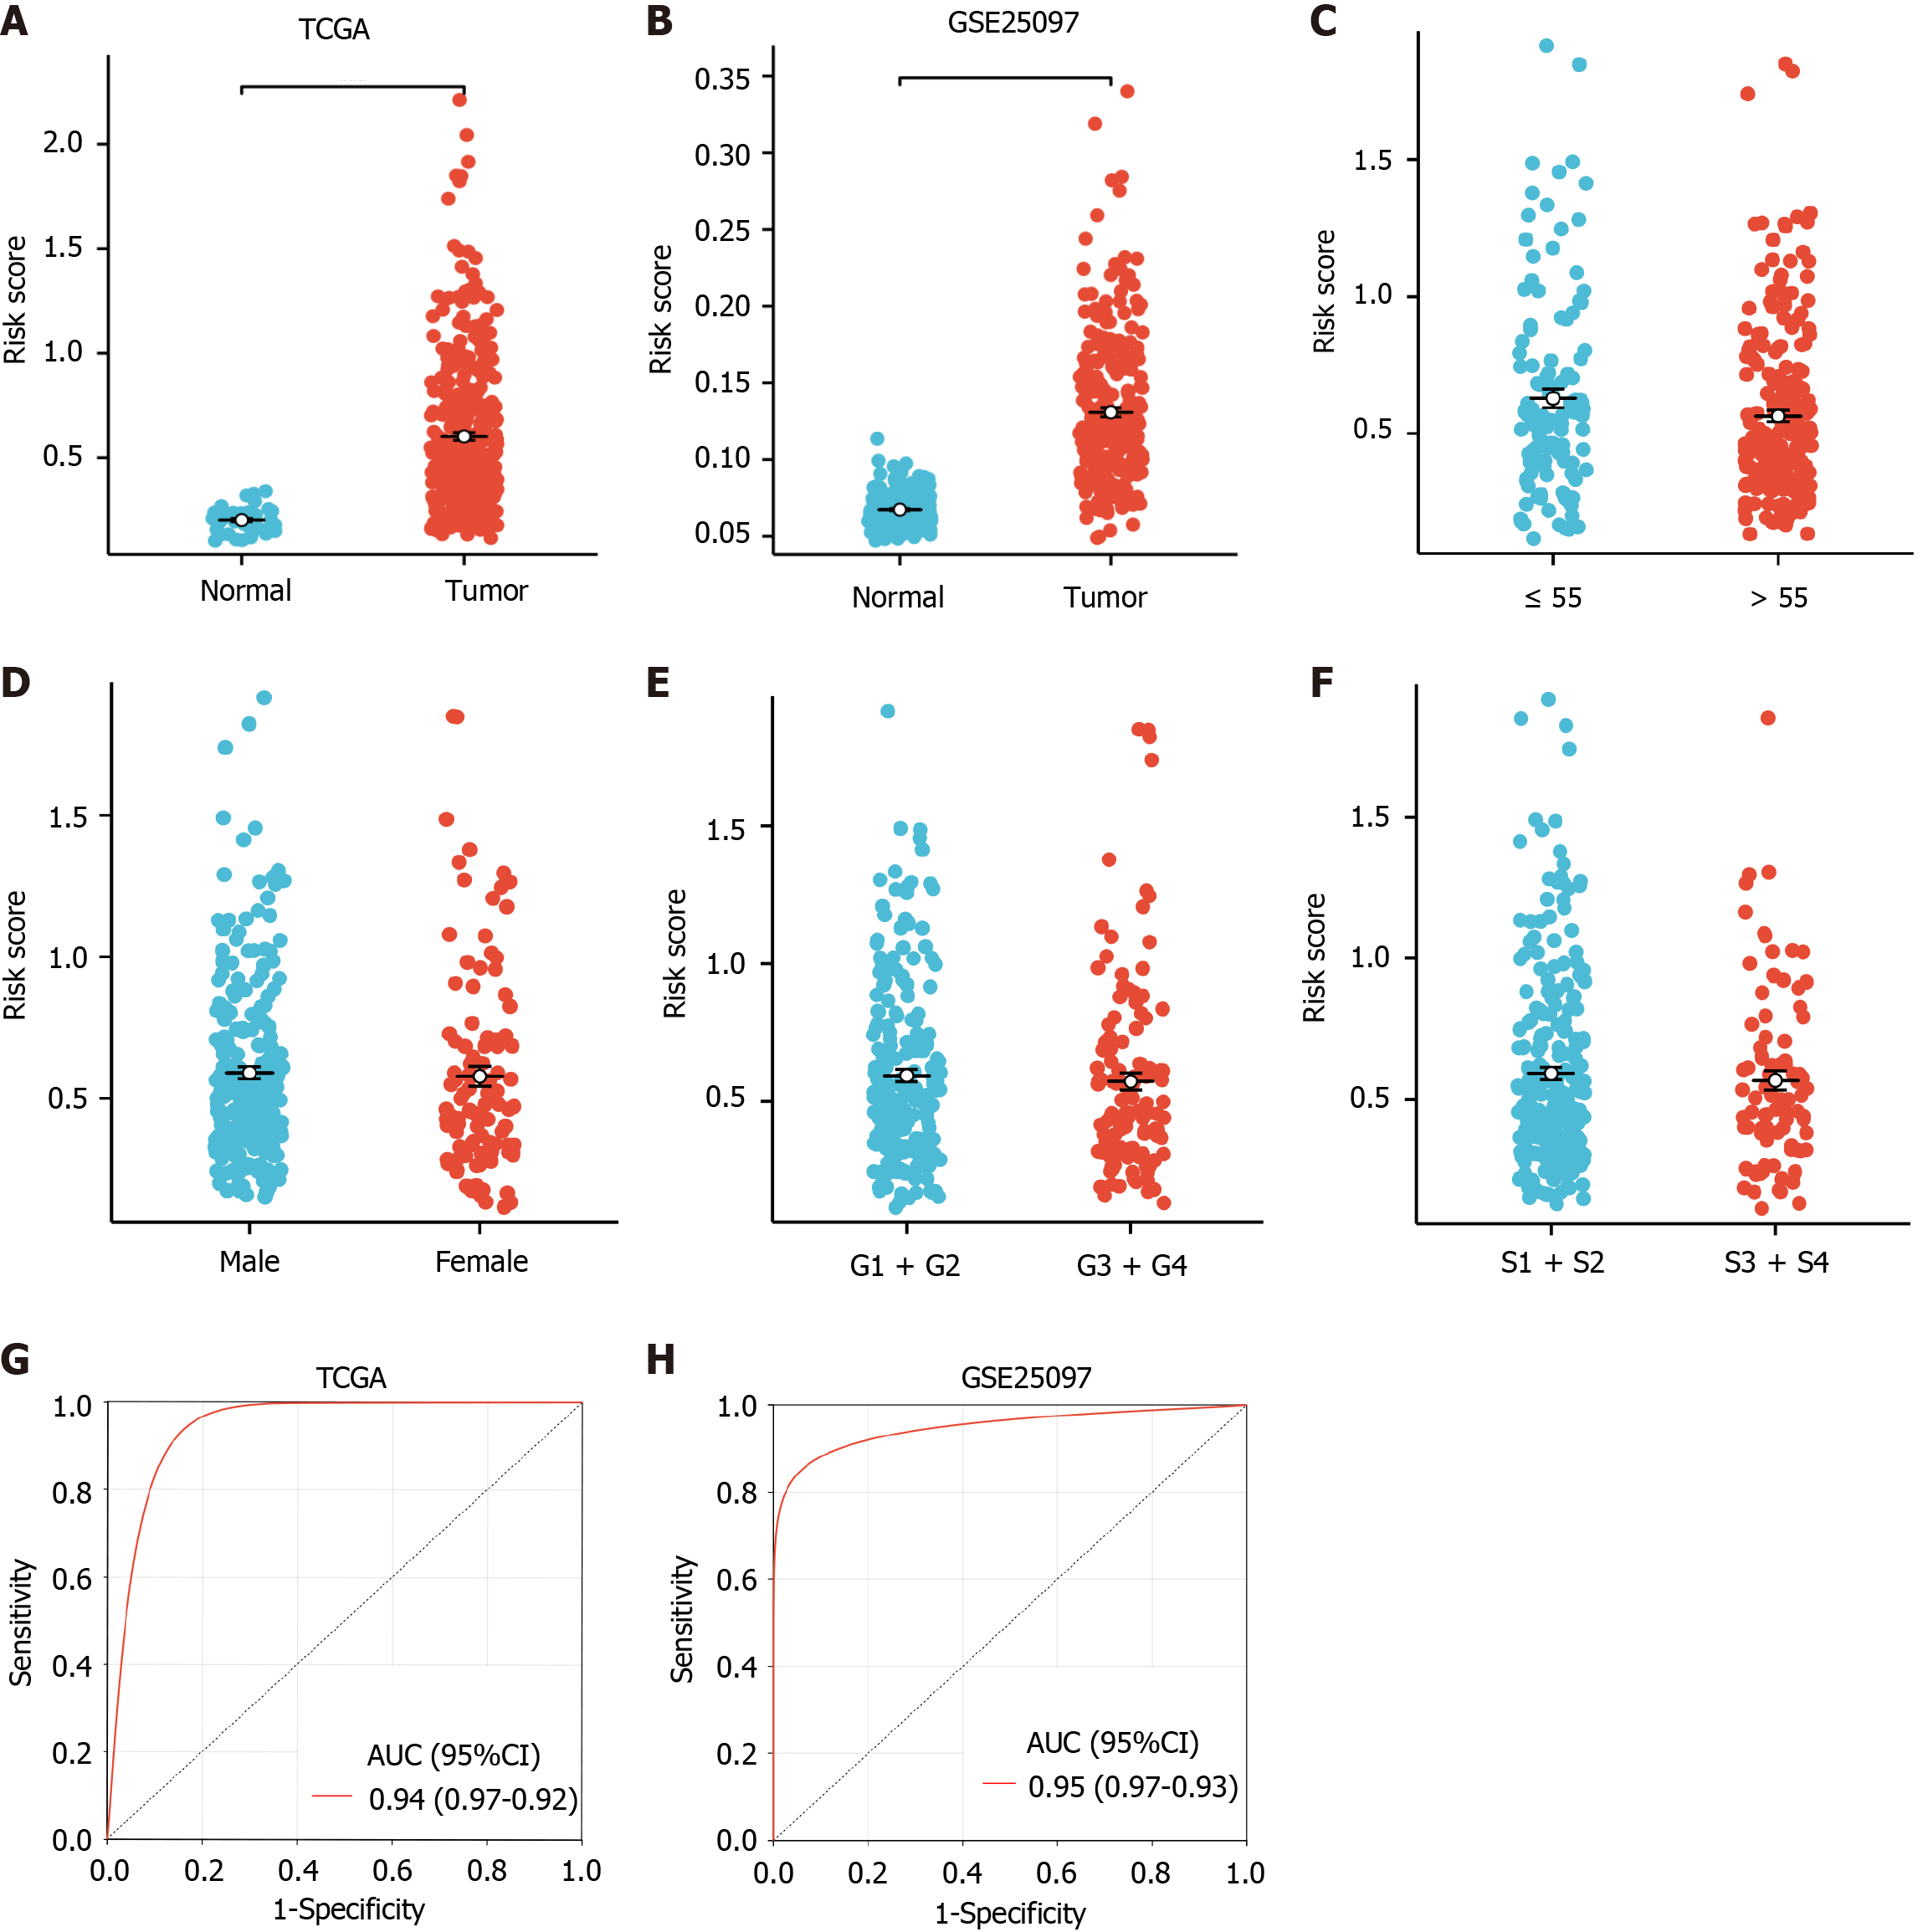
The differential expression analysis of the risk score between the HCC and normal groups was conducted. Notably, significantly higher risk scores were observed in the HCC group in the TCGA and GSE25097 HCC datasets (P < 0.05, Figure 4A and B). Additionally, the risk score as a continuous and categorical variable was found to be independent of age, sex, grade, and pathological stage (S1 + S2; stage I and stage II; S3 + S4; stage III and stage IV) (P > 0.05, Table 2 and Figure 4C-F). Subsequently, ROC analysis was performed to explore the diagnostic efficiency of the gene model. In the TCGA-HCC and GSE25097 datasets, the gene model efficiently distinguished HCC from normal samples, with an AUC value of 0.94 and 0.95, respectively (P < 0.05) (Figure 4G and H). These results indicated that the risk model was highly effective in diagnosing HCC.
| Variables | Total, n = 339 | Risk score-low, n = 170 | Risk score-high, n = 169 | P value |
| Age | 61.000 (51.000, 68.000) | 62.000 (52.000, 69.000) | 59.000 (51.000, 67.000) | 0.083 |
| Sex | 0.310 | |||
| Female | 107 (31.6%) | 58 (34.1%) | 49 (29.0%) | |
| Male | 232 (68.4%) | 112 (65.9%) | 112 (71.0%) | |
| Stage | 0.876 | |||
| S1+S2 | 252 (74.3%) | 127 (74.7%) | 125 (74.0%) | |
| S3+S4 | 87 (25.7%) | 43 (25.3%) | 44 (26.0%) | |
| Grade | 0.457 | |||
| G1+G2 | 212 (62.5%) | 103 (60.6%) | 109 (64.5%) | |
| G3+G4 | 127 (35.5%) | 67 (39.4%) | 60 (35.5%) |
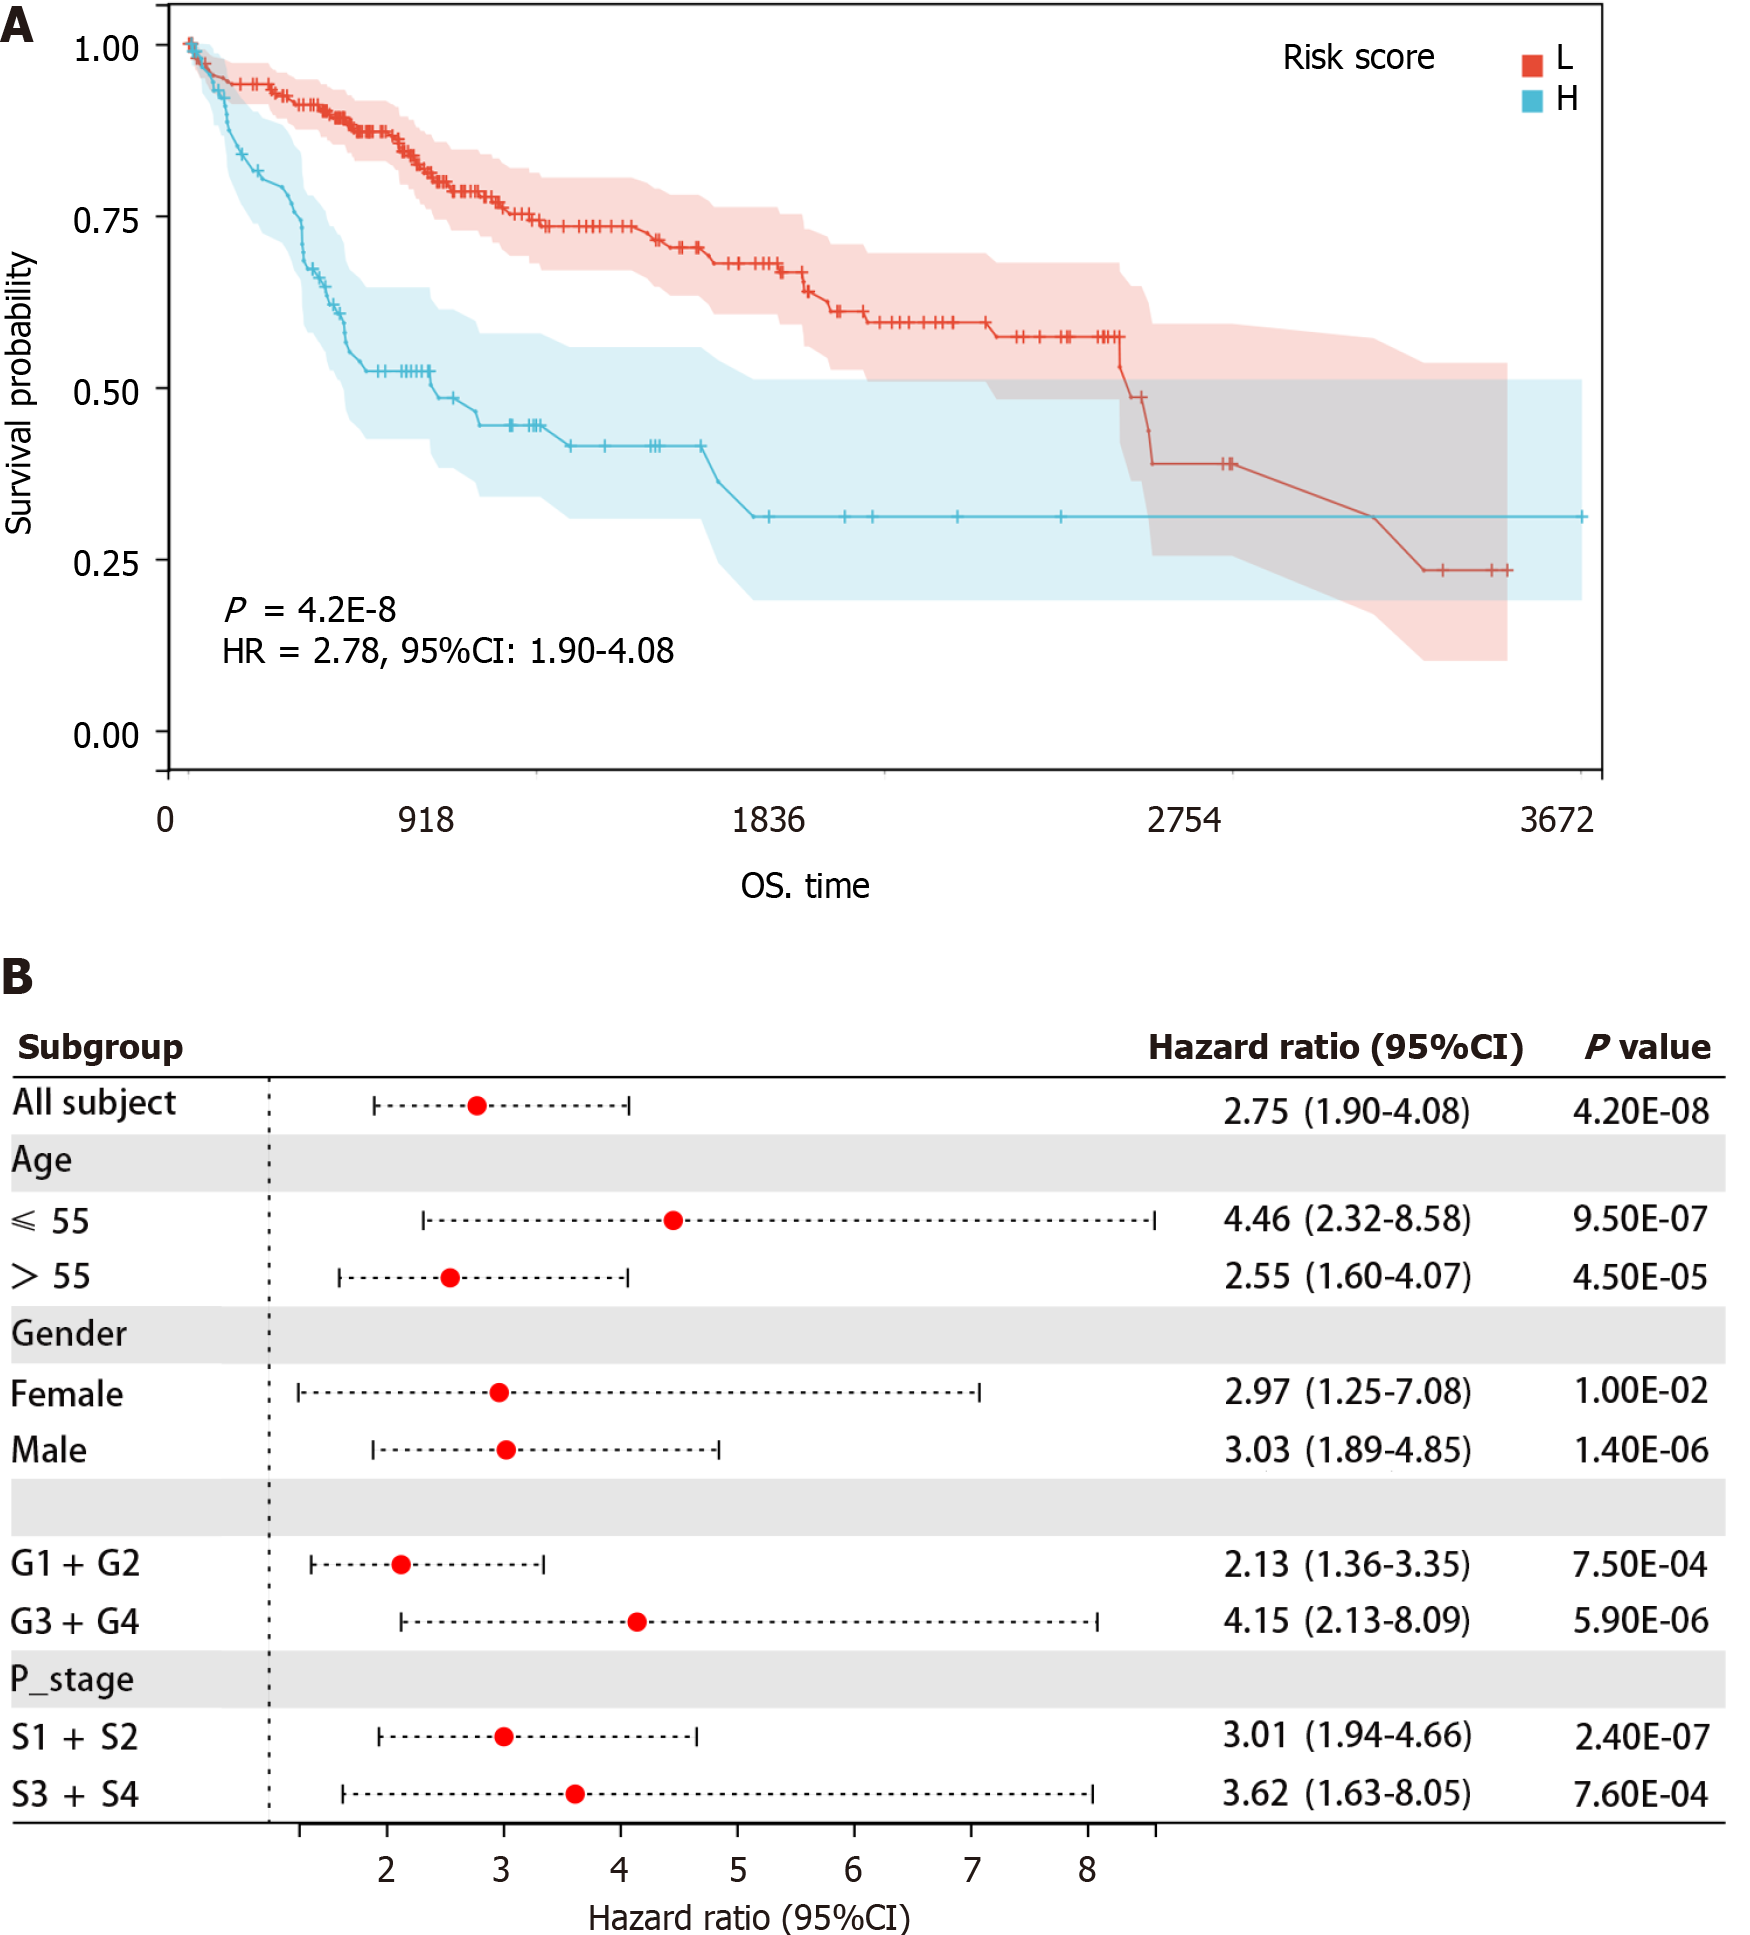
A Kaplan-Meier analysis was conducted to investigate the association of the risk score with HCC prognosis. As depicted in Figure 5A, a higher risk score indicates a poor prognosis for HCC patients. Additionally, among HCC patients aged ≤ 55 [hazard ratio (HR) = 4.46 (2.32-8.58), P < 0.05] and > 55 [HR = 2.55 (1.60-4.07), P < 0.05], female [HR = 2.97 (1.25-7.08), P < 0.05] and male [HR = 3.03 (1.89-4.85), P < 0.05], G1 + G2 [HR = 2.13 (1.36-3.35), P < 0.05] and G3 + G4 [HR = 4.15 (2.13-8.09), P < 0.05], and S1 + S2 [HR = 3.01 (1.94-4.66), P < 0.05] and S3 + S4 [HR = 3.62 (1.63-8.05), P < 0.05], high-risk scores were associated with poorer prognosis (Figure 5B). These results indicated that higher risk scores were significantly related to unfavorable prognosis regardless of age, sex, grade, and stage. Furthermore, when age, sex, grade, pathological stage, and risk score were analyzed using a multivariate Cox regression analysis, the results showed that the risk score independently predicted poor prognosis in HCC patients (P < 0.05) (Table 3).
| Characteristic | Total, n | Multivariate analysis | |
| Hazard ratio (95%CI) | P value | ||
| Risk score | 339 | 5.339 (3.139-9.078) | < 0.001 |
| Age | 339 | 1.018 (1.002-1.034) | 0.028 |
| Sex | 339 | 1.010 (1.006-1.014) | 0.172 |
| Grade | 339 | 1.113 (0.744-1.664) | 0.603 |
| Stage | 339 | 0.888 (0.579-1.363) | 0.588 |
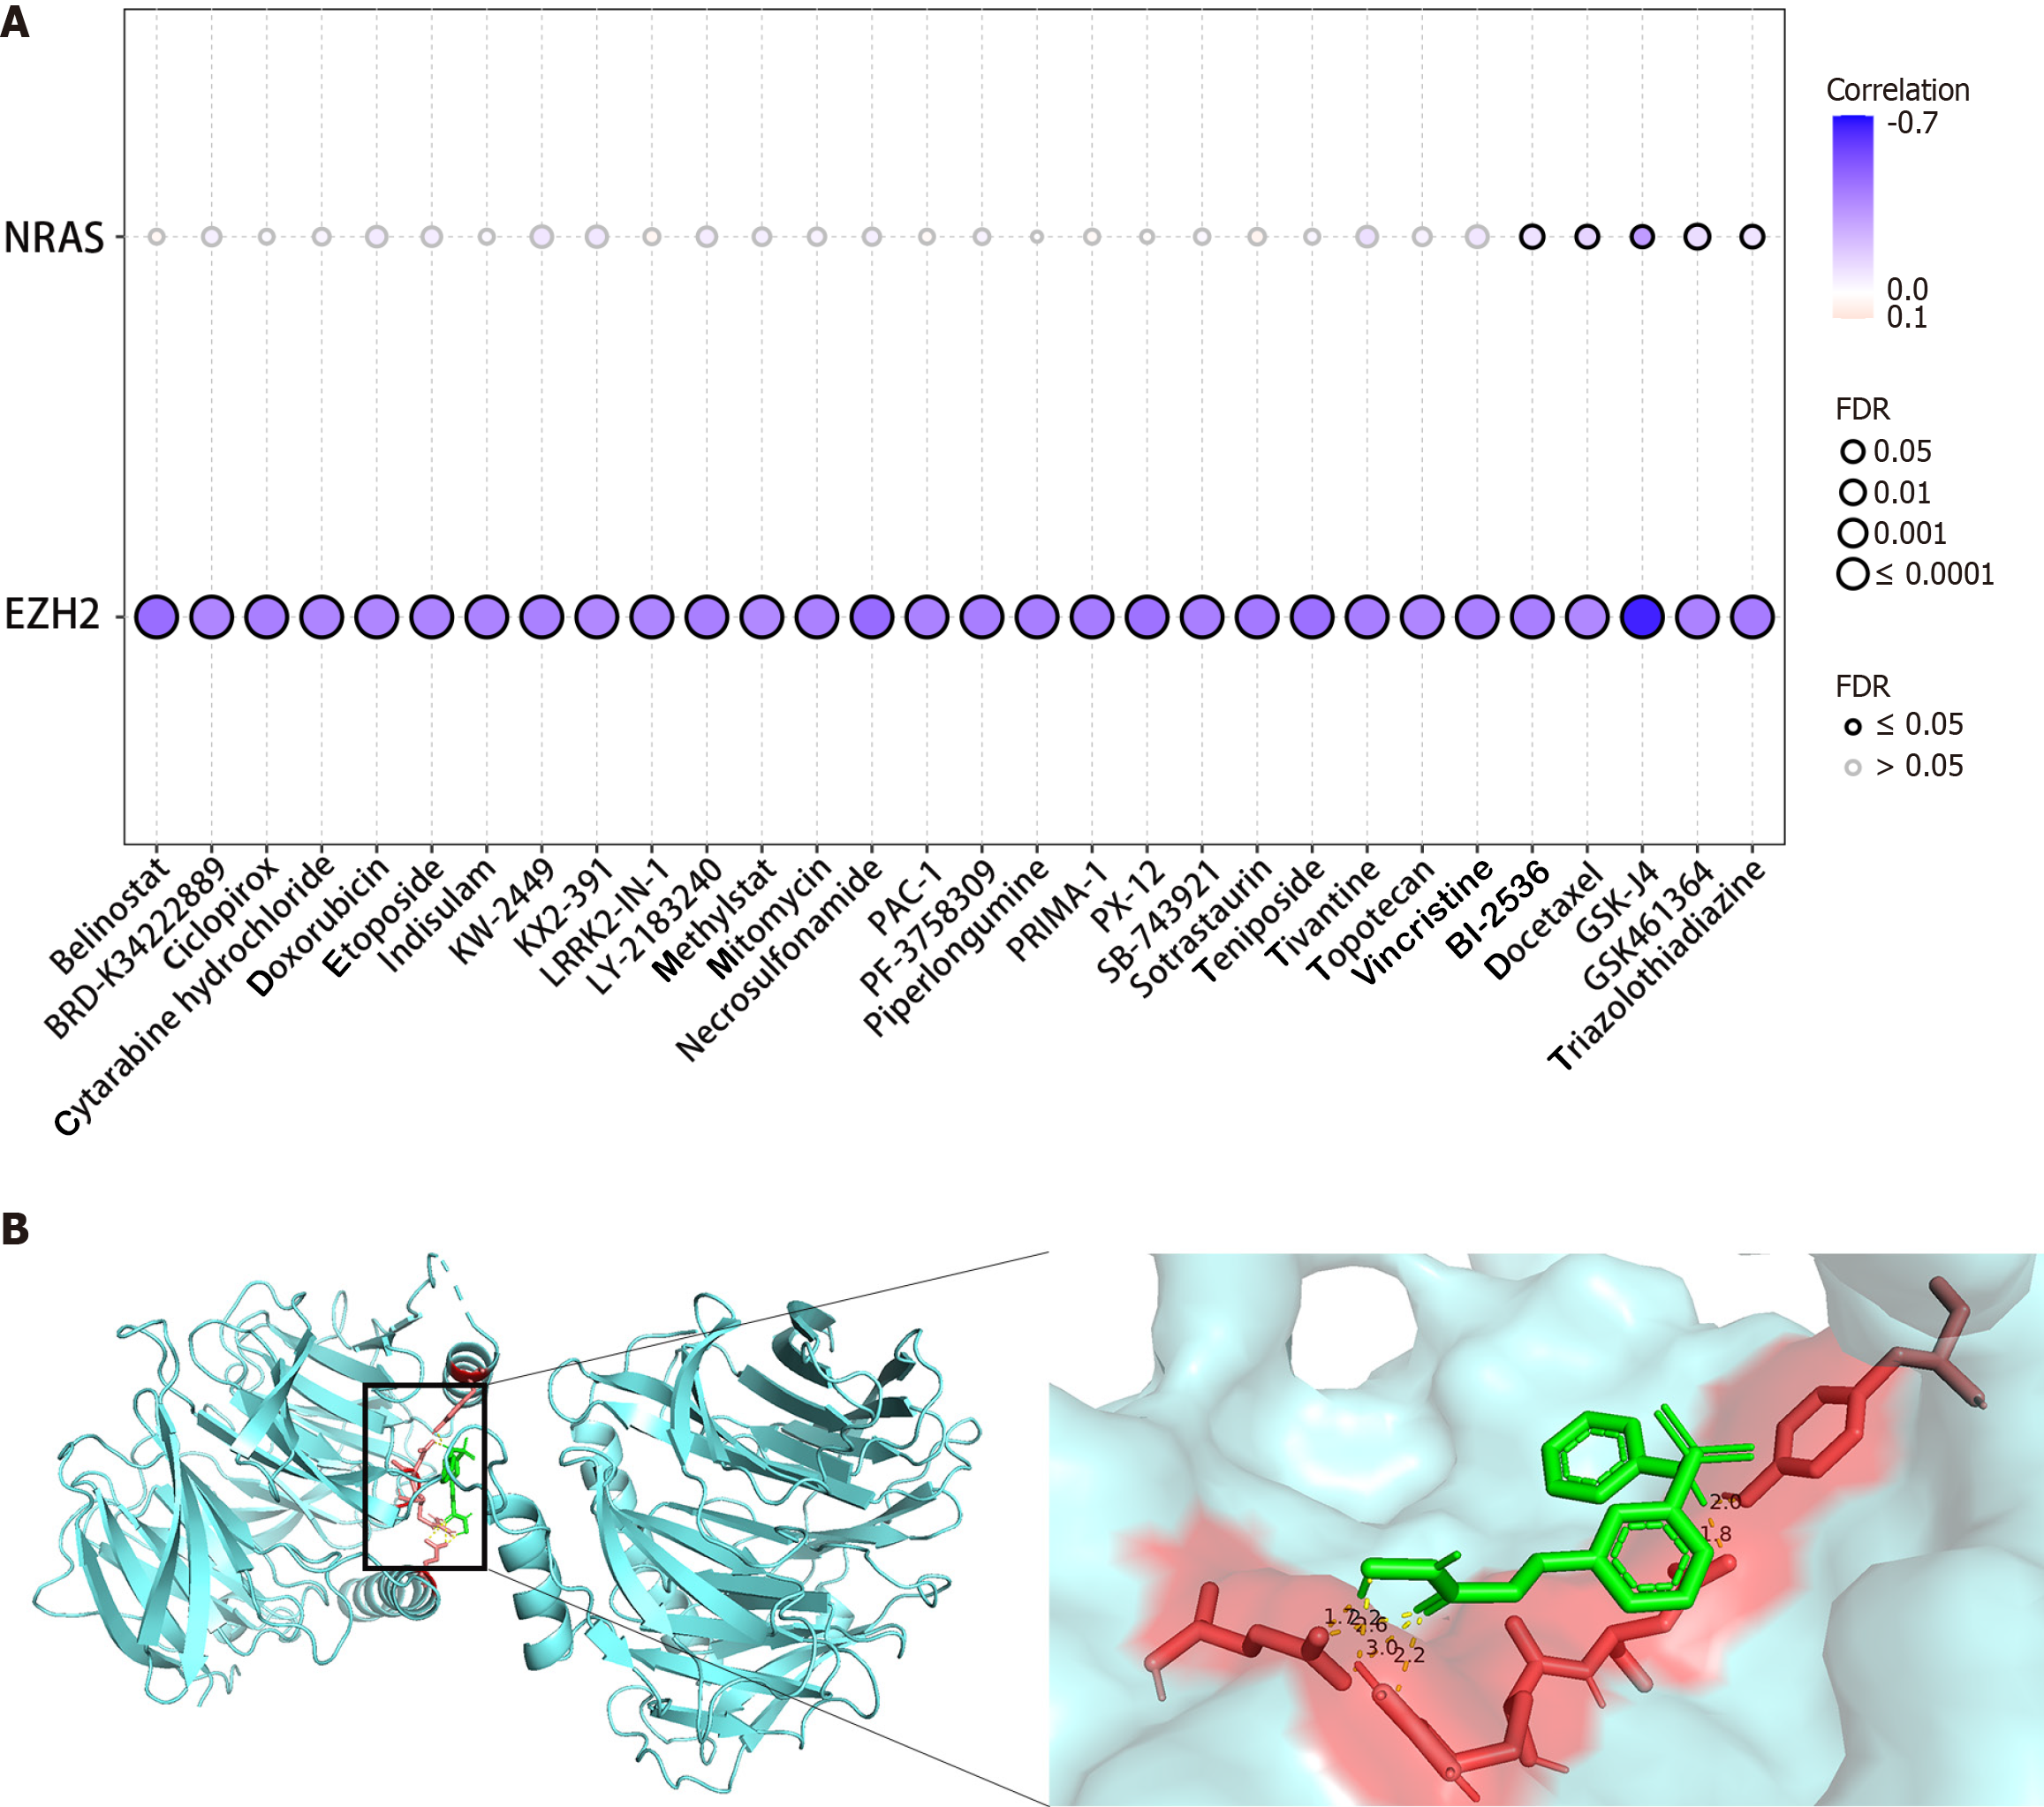
The goal was to investigate the therapeutic significance of specific genes within the gene model and identify potential therapeutic targets. To achieve this, the correlation between the expression levels of two genes, EZH2 and NRAS, and the sensitivity of commonly used chemotherapy and targeted drugs were examined. Leveraging data from the Cancer Therapeutics Response Portal database, it was found that EZH2 expression was significantly negatively correlated with drug sensitivity (Figure 6A). Subsequently, four drugs, belinostat, BRD-K34222889, ciclopirox, and cytarabine hydrochloride, were selected for molecular docking analysis. Remarkably, EZH2 exhibited favorable interactions with these drugs (Table 4). The most promising docking outcomes were visualized using the PyMOL software (P < 0.05, Figure 6B). These findings underscored the potential of EZH2 as a therapeutic target for HCC, prompting further investigation of its value in HCC treatment.
| Medicine | Hub targets (PDB ID) | Binding energy in kcal/mol |
| Belinostat | EZH2 (5h14) | -4.58 |
| BRD-K34222889 | EZH2 (5h14) | -4.23 |
| Ciclopirox | EZH2 (5h14) | -4.07 |
| Cytarabine hydrochloride | EZH2 (5h14) | -1.75 |
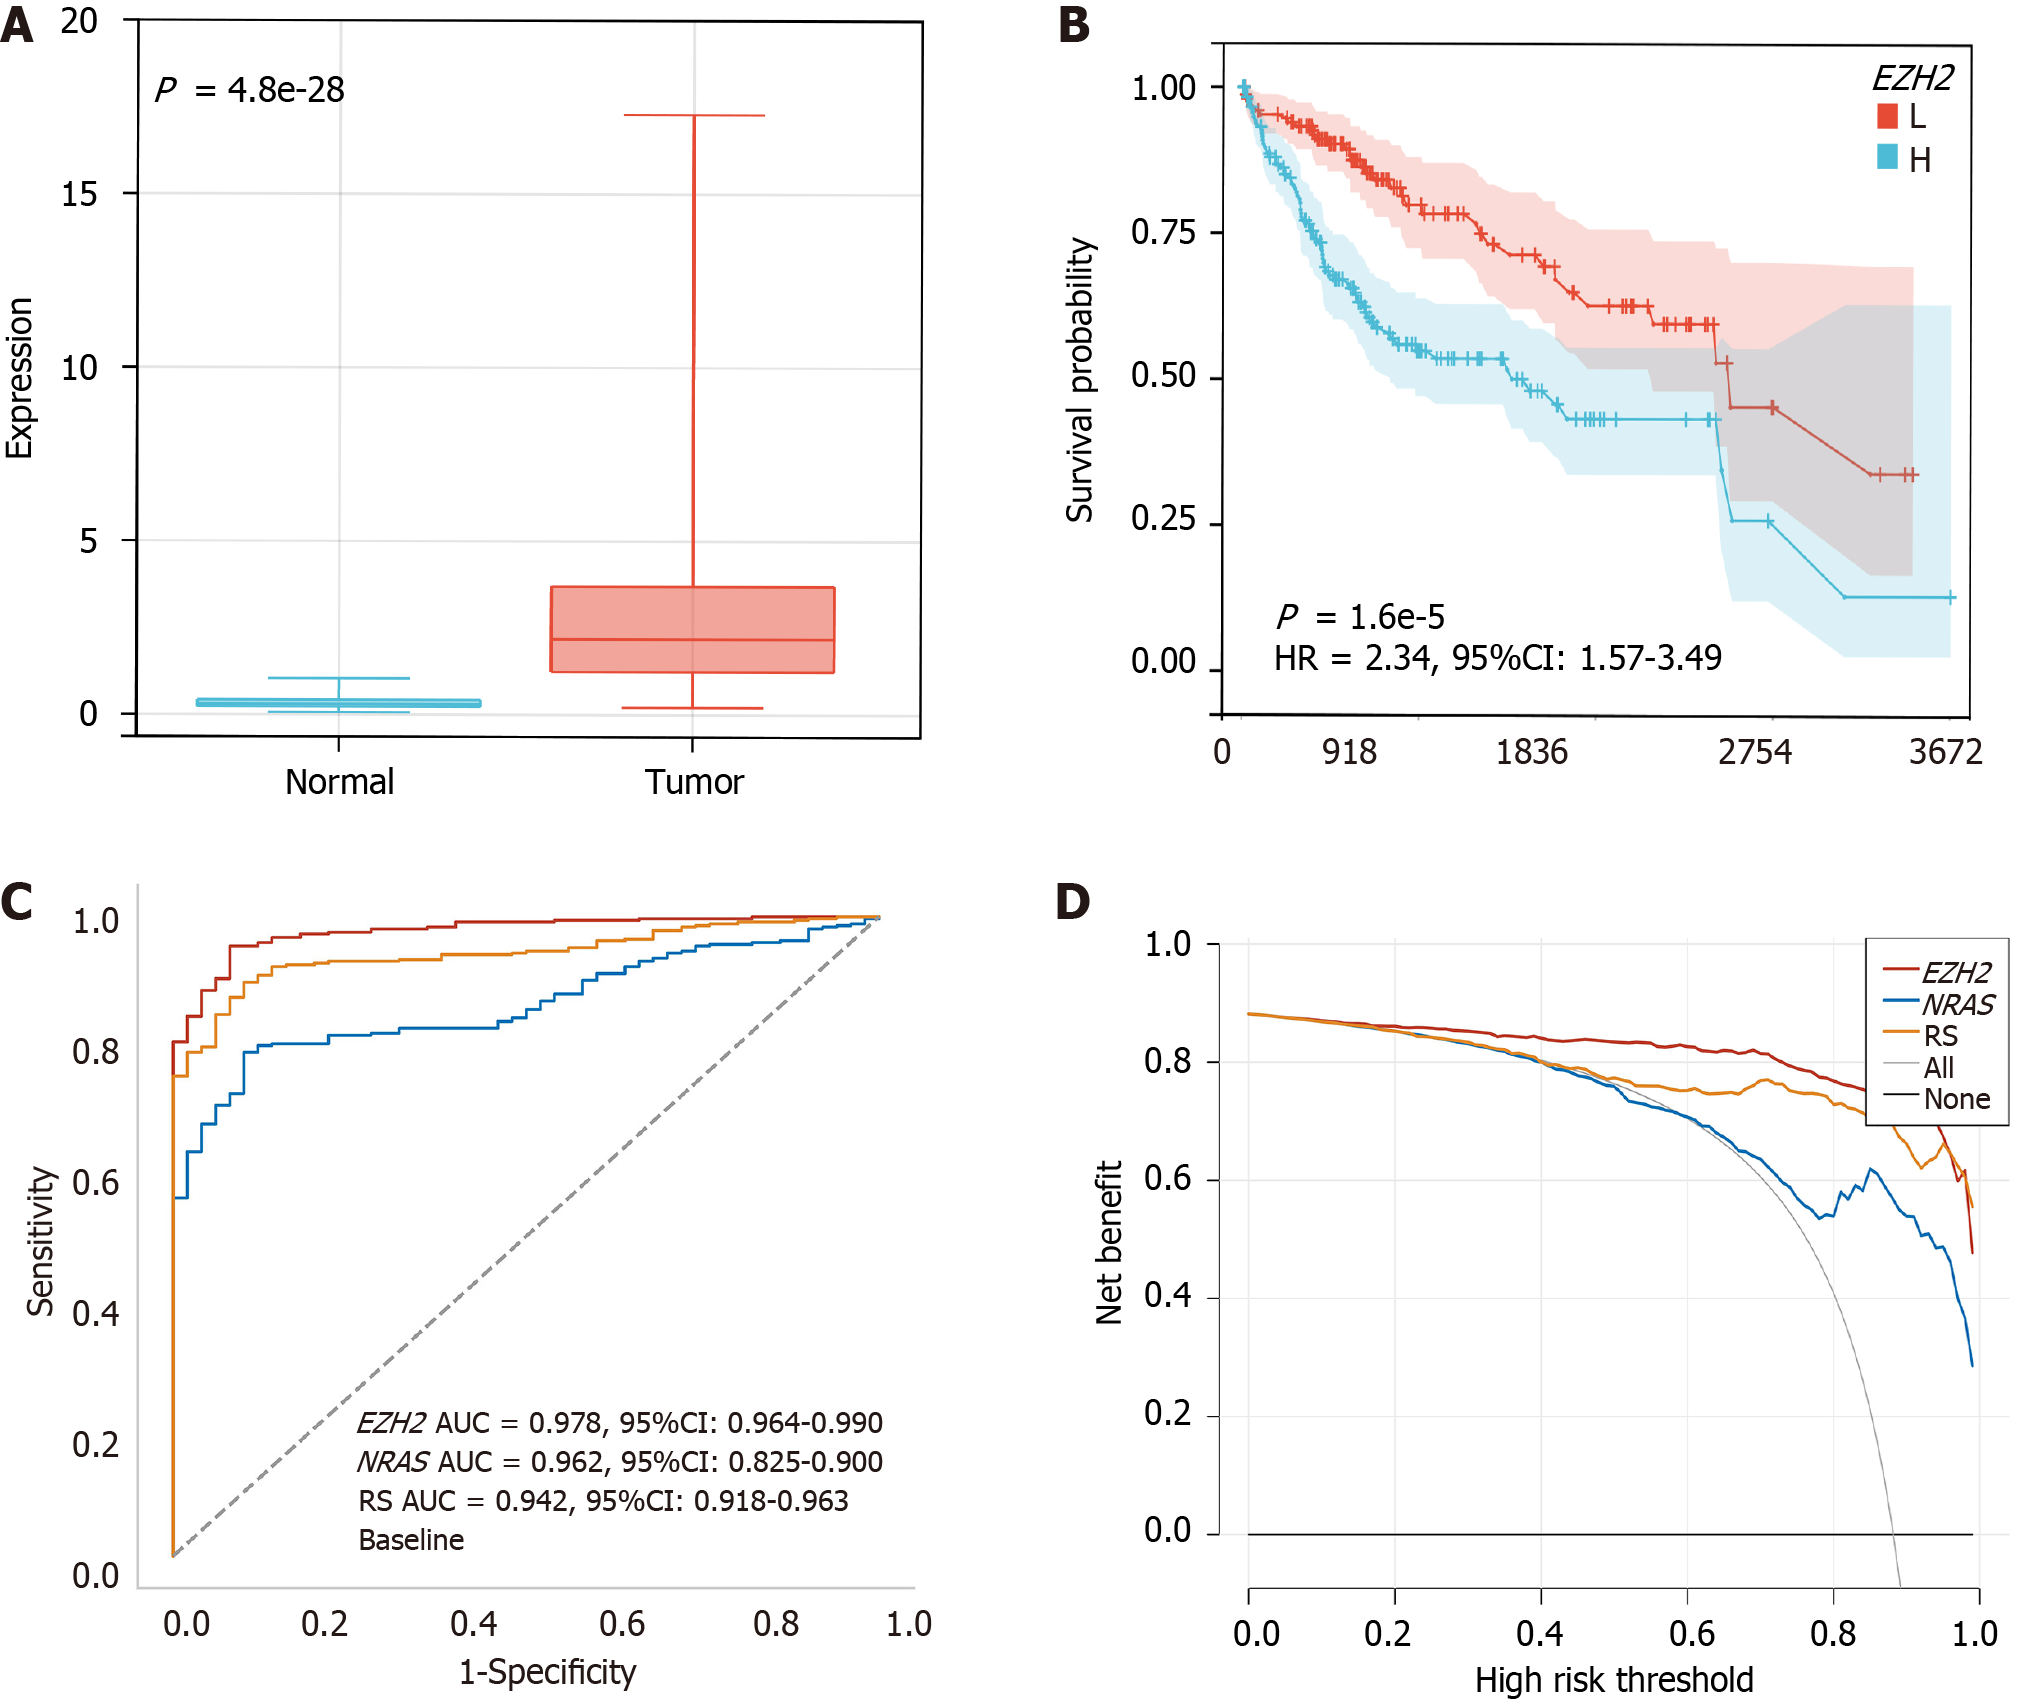
The EZH2 protein levels were significantly higher in the HCC group compared to the normal group (P < 0.05, Figure 7A). Interestingly, patients with EZH2 overexpression had significantly shorter survival (P < 0.05, Figure 7B). Furthermore, using the ROC analysis with AUC values, it was shown that EZH2 outperformed NRAS and the risk score in predicting HCC, achieving the highest AUC value of 0.978 (P < 0.05, Figure 7C and Table 5). The clinical efficacy of EZH2, NRAS, and the risk score was compared using the decision curve analysis (Figure 7D). These results confirmed the significance of EZH2 in HCC and its potential as a diagnostic marker.
| Name | EZH2 | NRAS | Risk score |
| EZH2 | / | < 0.05 | < 0.05 |
| NRAS | < 0.05 | / | < 0.05 |
| Risk score | < 0.05 | < 0.05 | / |
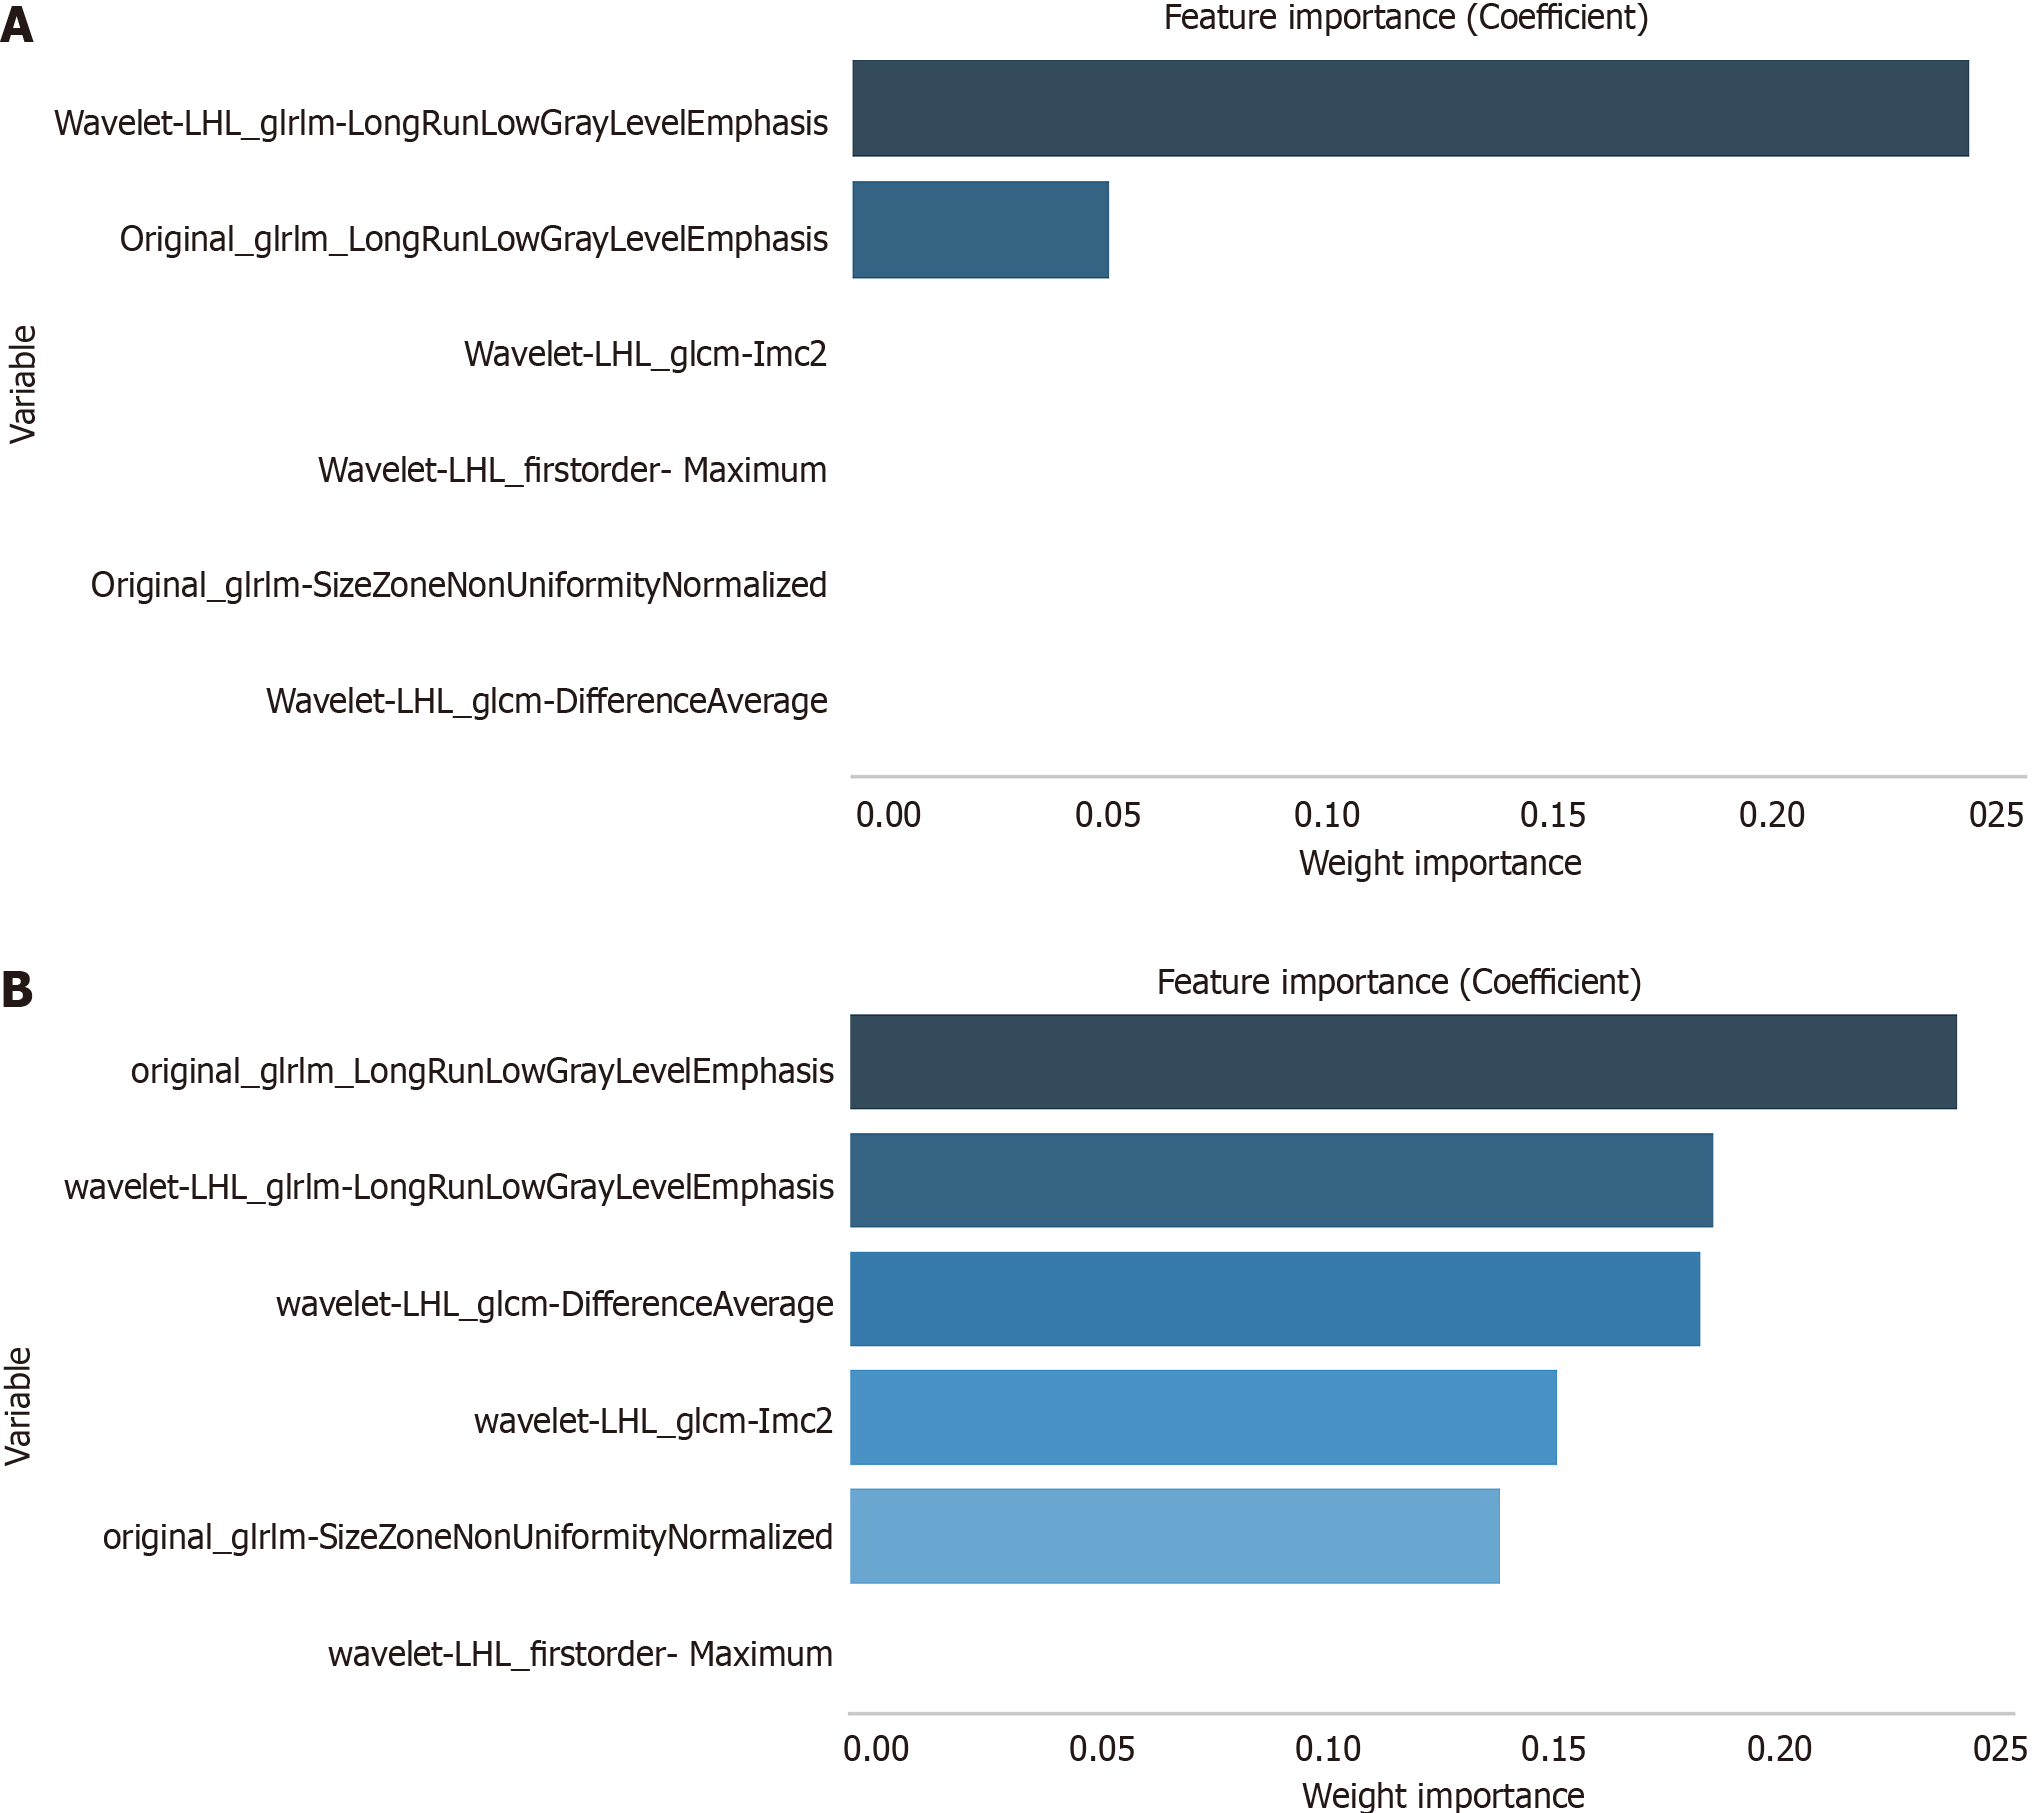
The XGBoost-RFE algorithm was used to screen the radiomics features related to EZH2. The six features included original_glrlm_LongRunLowGrayLevelEmphasis, original_glrlm-SizeZoneNonUniformityNormalized, wavelet-LHL_glcm-DifferenceAverage, wavelet-LHL_glcm-Imc2, wavelet-LHL_firstorder- Maximum, and wavelet-LHL_glrlm-LongRunLowGrayLevelEmphasis. Both logistic and random forest algorithms were used to assess feature importance. Notably, original_glrlm- LongRunLowGrayLevelEmphasis and wavelet-LHL_glrlm-LongRunLowGrayLevelEmphasis were closely related to EZH2 (Figure 8). Based on these findings, we selected original_glrlm- LongRunLowGrayLevelEmphasis and wavelet-LHL_glrlm-LongRunLowGrayLevelEmphasis to construct the EZH2 prediction-related radiomics model. These steps ensured a comprehensive understanding of the EZH2 radiomics signature and its potential implications for HCC prediction.
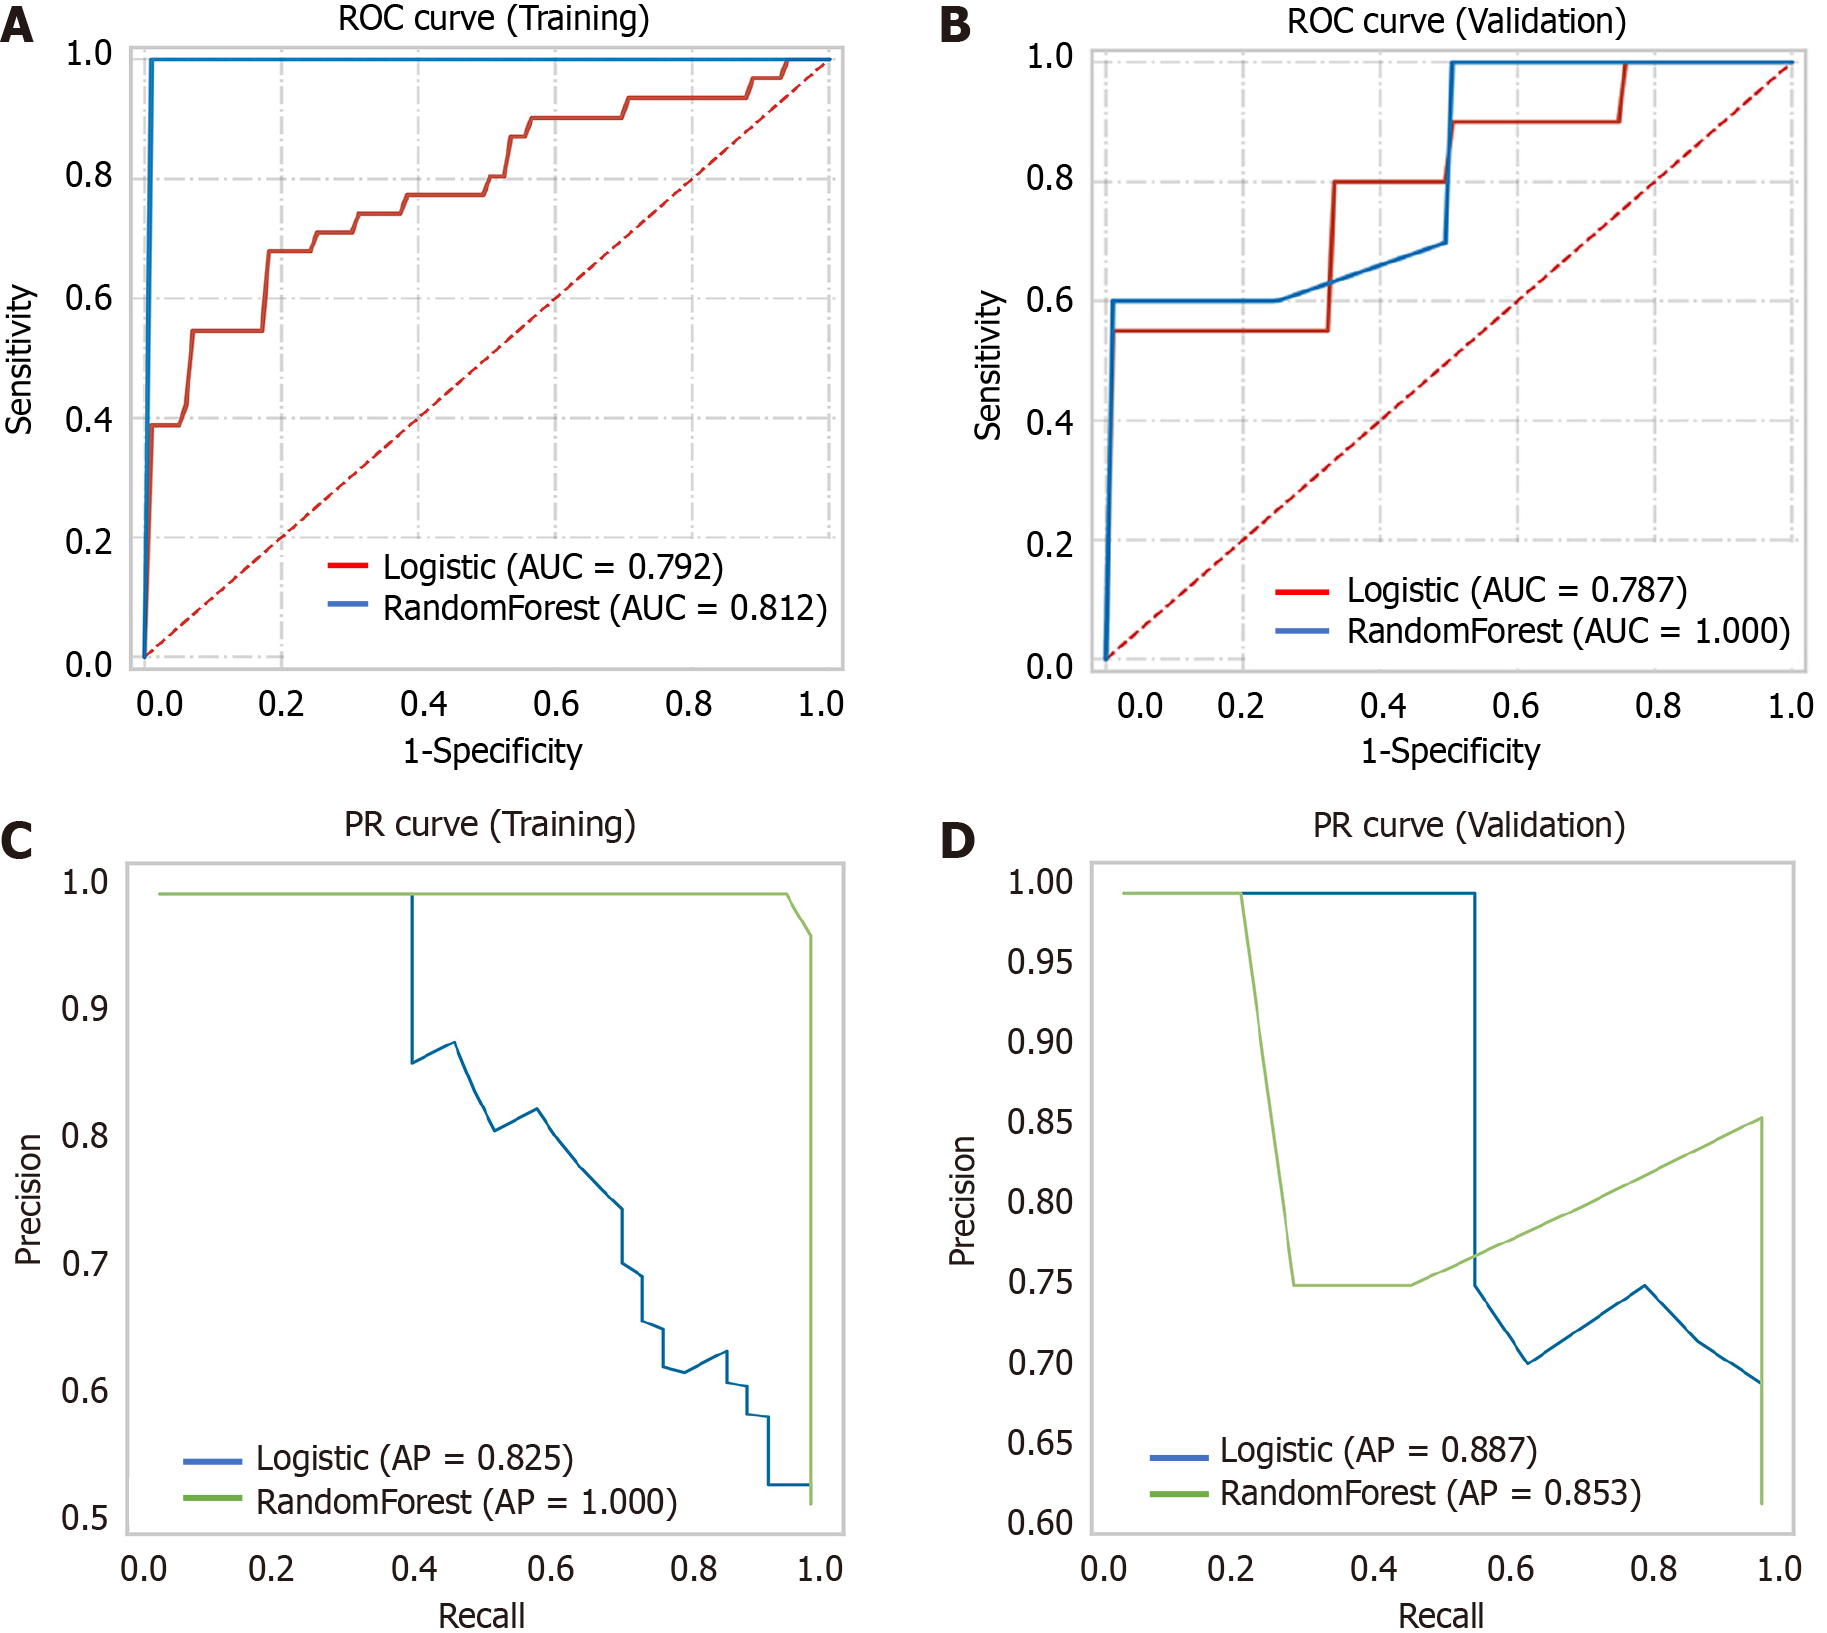
A comprehensive multimodel analysis was conducted to construct the optimal radiomics model for predicting EZH2. The results revealed that the model built using the logistic algorithm not only exhibited better prediction capabilities but also demonstrated greater stability (Table 6 and Figure 9). Consequently, the Radscore was calculated based on the logistic algorithm as follows: Radscore = 0.095 × original_glrlm- LongRunLowGrayLevelEmphasis + 0.671 × wavelet-LHL_glrlm-LongRunLowGrayLevelEmphasis. This approach ensured a robust and accurate prediction of EZH2 status using radiomics features.
| Classification model | AUC | Accuracy | Sensitivity | Specificity | F1 score | |
| Validation | Logistic | 0.792 | 0.667 | 0.800 | 0.833 | 0.833 |
| Random Forest | 0.812 | 0.750 | 1.000 | 0.750 | 0.833 | |
| Training | Logistic | 0.787 | 0.750 | 0.679 | 0.881 | 0.744 |
| Random Forest | 1.000 | 0.938 | 1.000 | 1.000 | 1.000 | |
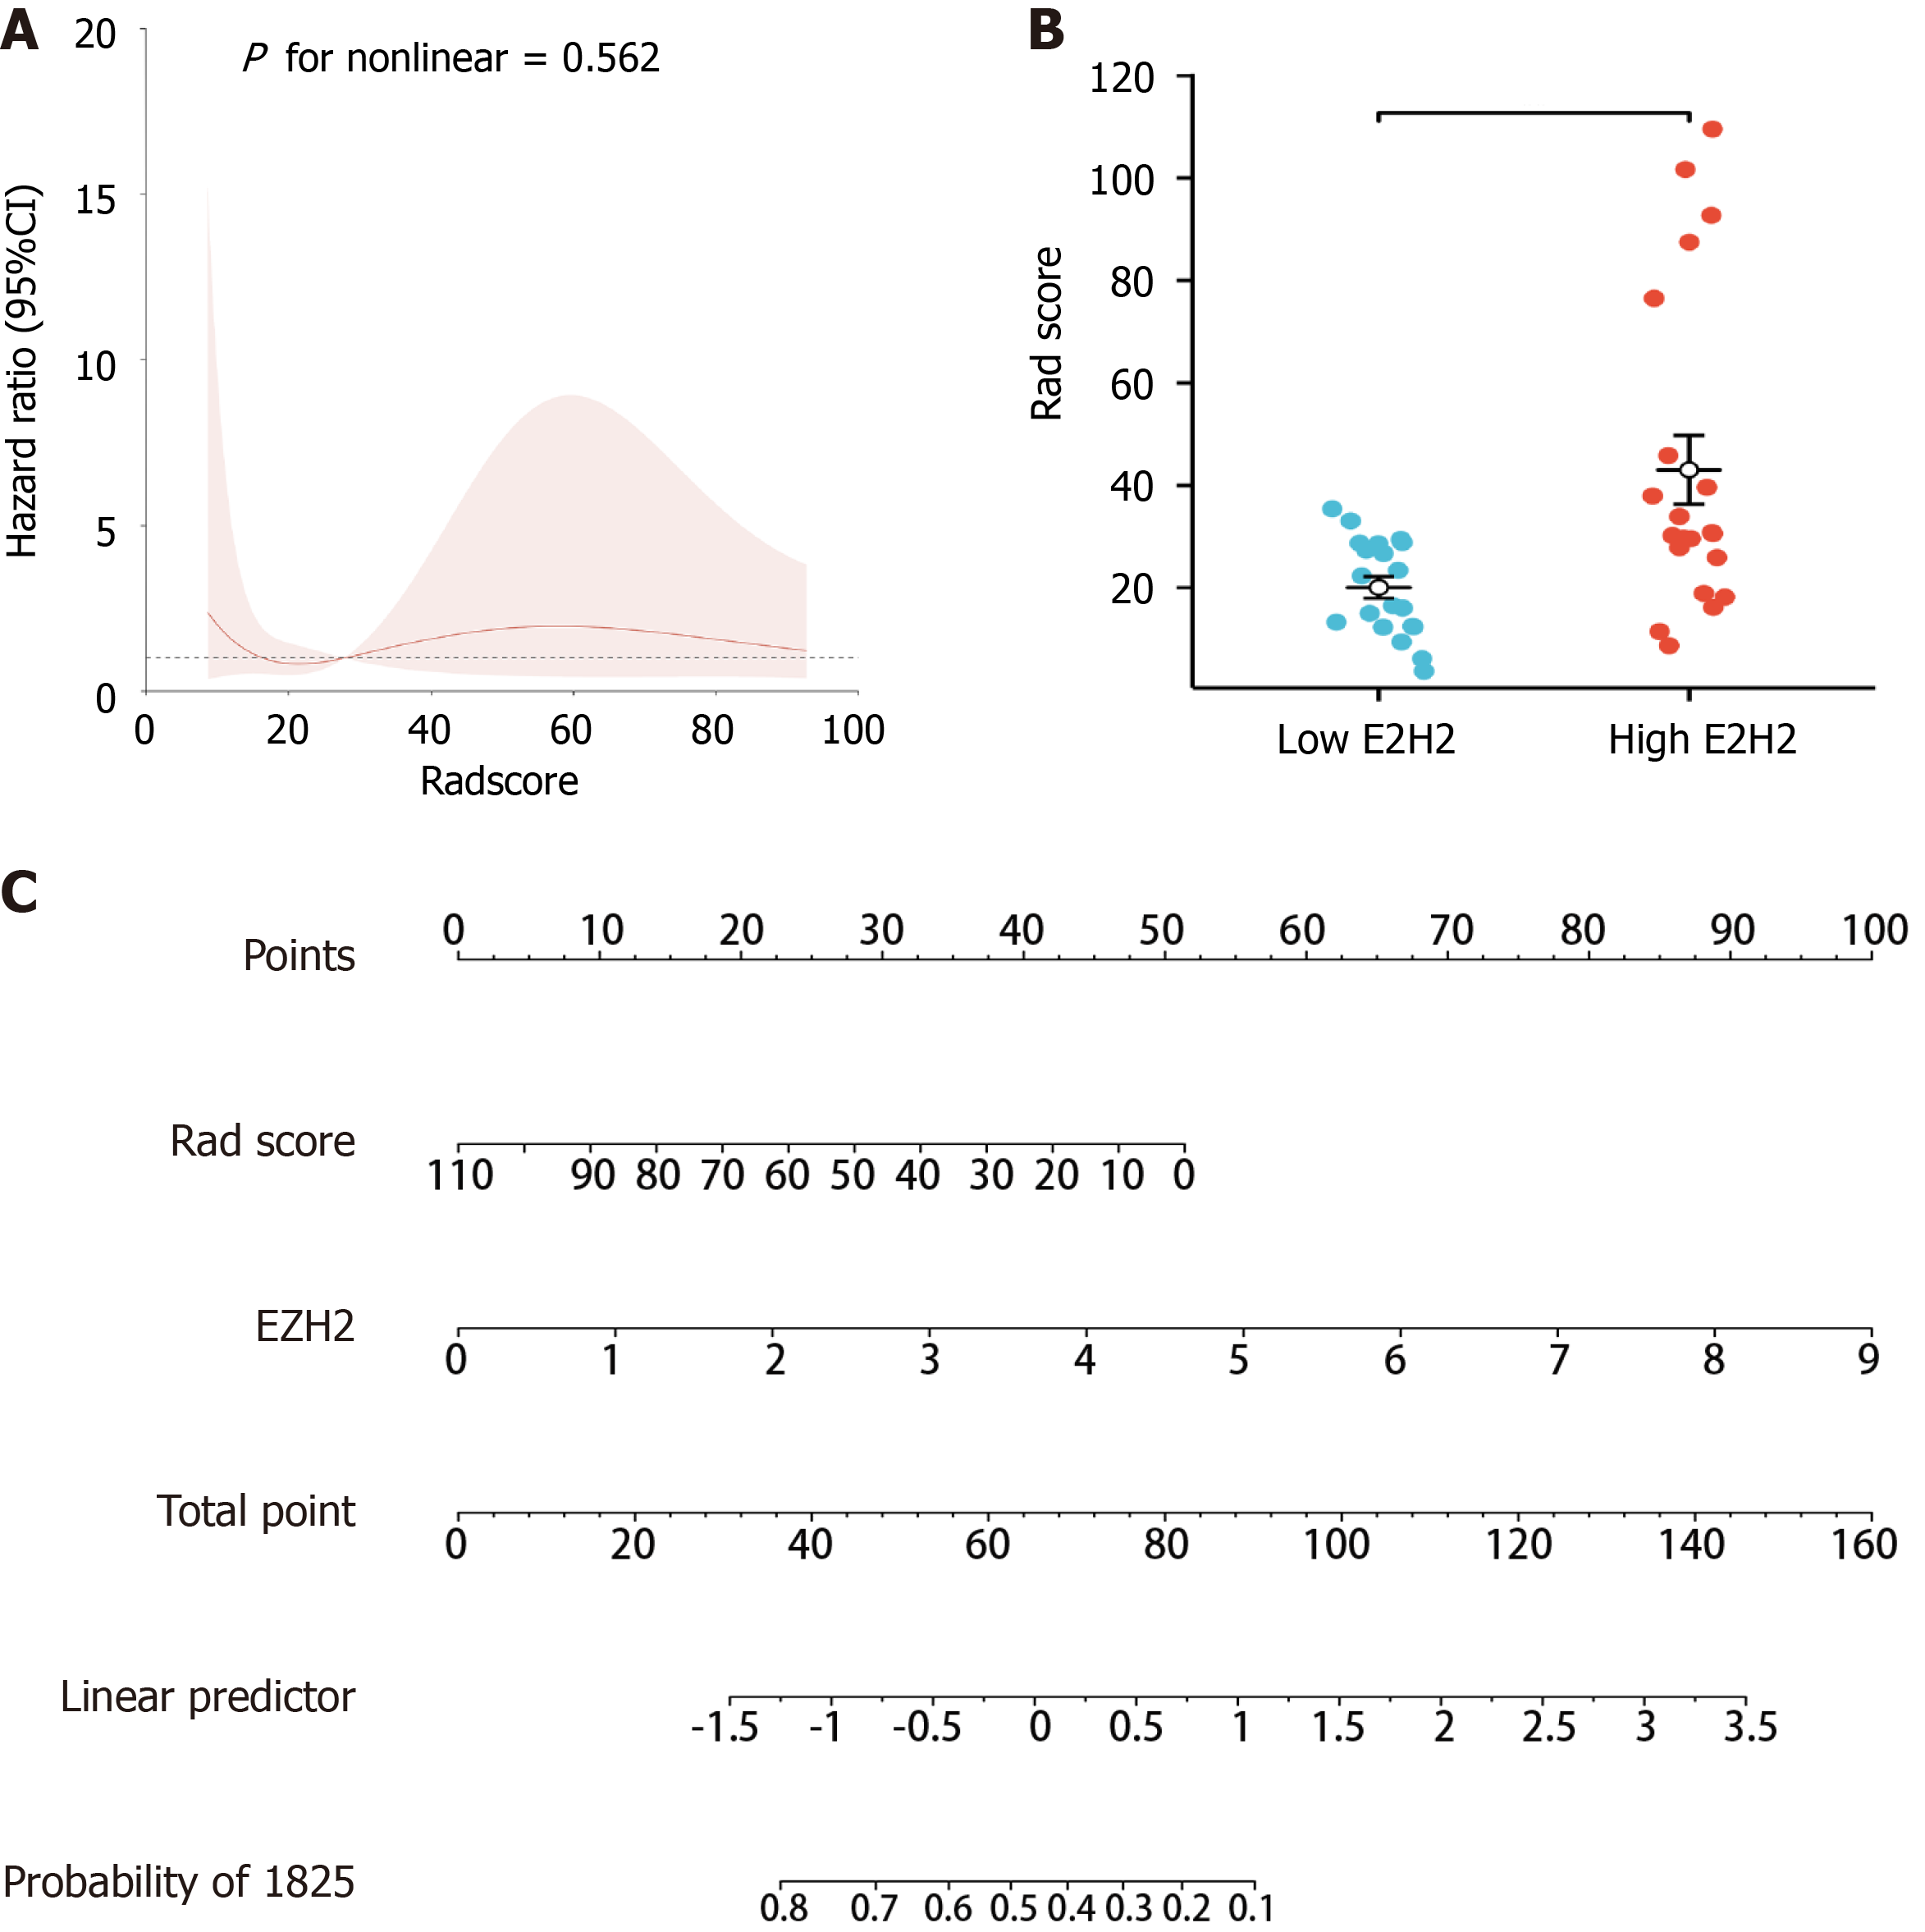
The restricted cubic spline revealed a linear relationship between EZH2 and Radscore (Figure 10A). Specifically, the Radscore was higher in the EZH2 high expression group than in the EZH2 low expression group (Figure 10B). Moreover, the Radscore and EZH2 played a crucial role in predicting the OS of HCC patients (Figure 10C). These findings emphasized the significance of EZH2 and its association with patient outcomes in HCC.
This study combined radiomics and molecular analyses based on CT images to identify important molecular biomarkers associated with HCC, particularly EZH2. The study also aimed to establish a radiomics model that can predict EZH2 expression and determine its association with HCC prognosis. Consequently, a significant correlation was observed between the radiomics model, EZH2 expression, and HCC patient prognosis. This finding suggests that radiomics analysis can provide additional molecular information and offer a new approach to the clinical treatment of HCC.
The incidence rate of HCC is increasing globally, and it is generally associated with poor prognosis. Increasing evidence suggests that crosstalk between tumor cells, including HCC, and stromal cells promotes tumor progression[19]. Additionally, CAFs are the predominant stromal cells in the TME of HCC[20]. Liver cirrhosis with a significant number of activated fibroblasts typically predates HCC[21]. Venn diagram analysis identified 299 differentially expressed FRGs in HCC, which are primarily involved in biological processes related to stimuli response pathways including chemical, organic substance, and stress. These pathways are known to participate in tumor development. Through multiple analyses, we established a risk model related to the prognosis of HCC patients composed of two genes, EZH2 and NRAS.
Drug sensitivity analysis revealed a significant negative correlation between EZH2 and select chemotherapeutic and targeted drugs, while NRAS showed no significant correlation. Molecular docking results showed that the EZH2 (5h14) protein exhibited the strongest binding affinity with the small molecule ligand, belinostat, with a binding energy of -4.58 kcal/mol. In studies with human acute early granulocytic leukemia cells, belinostat independently depleted the histone EZH2, leading to the modification of H3 and H4 histones and ultimately achieving therapeutic effects[22]. This suggests that EZH2 may be a potential therapeutic target for HCC, and belinostat may exert its therapeutic effect by reducing EZH2 expression levels in HCC.
Further analysis revealed a significant association between EZH2 expression and poor prognosis in HCC patients. EZH2 also displayed significant HCC diagnostic capabilities. Therefore, EZH2 was selected as the primary gene for subsequent analysis. Previous studies have shown that EZH2 plays an important role in cell lineage determination and related signaling pathways, serving as a major regulator of DNA damage repair, autophagy, cell cycle progression, and cell senescence suppression[23]. The oncogenic mechanism of EZH2 is primarily by suppressing the expression of tumor suppressor genes in cancer cells[24].
In gliomas, EZH2 can suppress the differentiation of astrocytes by inhibiting the expression of BMPR1B, resulting in increased tumorigenicity in gliomas[25]. EZH2 also promotes cancer metastasis by silencing E-cadherin and inducing epithelial-mesenchymal transition[26]. In scar research, RUNX3 mediates the proliferation of fibroblasts by deacetylating EZH2 through SIRT1[27]. In pulmonary fibrosis research, EZH2 negatively regulates autophagy in the fibrosis through the lncAPE-ELAVL1 complex[28]. Additionally, CAFs can promote angiogenesis through the VEGF-mediated EZH2 pathway, and overexpression of EZH2 is strongly associated with tumor invasion and reduced survival in liver cancer patients[29-31]. In conclusion, EZH2 is not only important for fibroblasts but also plays a significant role in tumor initiation and progression. This is consistent with the results of this study, which found a significant correlation between high EZH2 expression and poor prognosis in HCC patients.
Radiomics is typically used for diagnosis and postoperative treatment efficacy assessment in HCC[14]. Using the data from preoperative liver-enhanced CT, Feng et al[32] constructed a radiomics model to predict the macro trabecular-massive subtype of HCC. Additionally, Xia et al[33] were able to predict microvascular invasion in HCC using extracted radiomics features from the preoperative registration or subtraction CT images. This study innovatively linked the radiomics features with EZH2 expression to use EZH2 expression to predict the OS of HCC patients from CT image data. A radiomics model related to EZH2 expression was constructed, and the radiomics features included original_glrlm-LongRunLowGrayLevelEmphasis and wavelet-LHL_glrlm-LongRunLowGrayLevelEmphasis. Gray-Level Run-Length Matrix quantifies gray-level runs, defined as consecutive pixels with the same gray level value[34]. LongRunLowGrayLevelEmphasis is one of the 16 features of Gray-Level Run-Length Matrix, which is a measure of image texture, specifically the roughness. In tendinopathy imaging studies, GLLM-LongRunLowGrayLevelEmphasis can determine tissue changes longitudinally[35]. The higher the value, the rougher the texture. Aside from analyzing the distribution of the gray level of an image, it can also extract representative texture features[31]. In this study, the Radscore was higher in the EZH2 high expression group, and the radiomics model was efficient in predicting EZH2 in HCC. The nomogram demonstrated the importance of the Radscore and EZH2 in predicting the OS of HCC patients. Thus, the radiomics model infers an association with EZH2 and correlates with the prognosis of HCC patients.
This study leverages advanced imaging and bioinformatics tools to bridge the gap between macroscopic imaging features and microscopic genetic alterations. However, the radiomics and genomics data were obtained from public databases. Additionally, the scarcity of information on the CT images of HCC patients in the TCIA database made it impossible to divide the data into training and validation sets. Lastly, the analytical methods employed in the study primarily consisted of bioinformatics and statistics, lacking relevant experimental validation.
In conclusion, the gene model developed in this study, specifically related to fibroblasts in HCC, exhibited a strong association with HCC prognosis. Furthermore, the study identified EZH2 as a potential therapeutic target linked to the prognosis of HCC patients. Additionally, a radiomics model associated with EZH2 can predict EZH2 expression using CT features, which contributes to the diagnosis and treatment of HCC patients. By combining radiomics with molecular profiling in HCC, this study opens up new avenues for personalized and more effective treatment strategies.
| 1. | Wang T, Dai L, Shen S, Yang Y, Yang M, Yang X, Qiu Y, Wang W. Comprehensive Molecular Analyses of a Macrophage-Related Gene Signature With Regard to Prognosis, Immune Features, and Biomarkers for Immunotherapy in Hepatocellular Carcinoma Based on WGCNA and the LASSO Algorithm. Front Immunol. 2022;13:843408. [RCA] [PubMed] [DOI] [Full Text] [Full Text (PDF)] [Cited by in Crossref: 4] [Cited by in RCA: 47] [Article Influence: 15.7] [Reference Citation Analysis (0)] |
| 2. | Peng X, Zhu J, Liu S, Luo C, Wu X, Liu Z, Li Y, Yuan R. Signature construction and molecular subtype identification based on cuproptosis-related genes to predict the prognosis and immune activity of patients with hepatocellular carcinoma. Front Immunol. 2022;13:990790. [RCA] [PubMed] [DOI] [Full Text] [Full Text (PDF)] [Cited by in Crossref: 5] [Cited by in RCA: 32] [Article Influence: 10.7] [Reference Citation Analysis (0)] |
| 3. | Bray F, Ferlay J, Soerjomataram I, Siegel RL, Torre LA, Jemal A. Global cancer statistics 2018: GLOBOCAN estimates of incidence and mortality worldwide for 36 cancers in 185 countries. CA Cancer J Clin. 2018;68:394-424. [RCA] [PubMed] [DOI] [Full Text] [Cited by in Crossref: 53206] [Cited by in RCA: 55806] [Article Influence: 7972.3] [Reference Citation Analysis (132)] |
| 4. | Liu X, Li J, Wang Q, Bai L, Xing J, Hu X, Li S, Li Q. Analysis on heterogeneity of hepatocellular carcinoma immune cells and a molecular risk model by integration of scRNA-seq and bulk RNA-seq. Front Immunol. 2022;13:1012303. [RCA] [PubMed] [DOI] [Full Text] [Full Text (PDF)] [Cited by in Crossref: 9] [Cited by in RCA: 13] [Article Influence: 4.3] [Reference Citation Analysis (0)] |
| 5. | Cheng CW, Tse E. Targeting PIN1 as a Therapeutic Approach for Hepatocellular Carcinoma. Front Cell Dev Biol. 2019;7:369. [RCA] [PubMed] [DOI] [Full Text] [Full Text (PDF)] [Cited by in Crossref: 8] [Cited by in RCA: 13] [Article Influence: 2.6] [Reference Citation Analysis (0)] |
| 6. | Xu Z, Peng B, Liang Q, Chen X, Cai Y, Zeng S, Gao K, Wang X, Yi Q, Gong Z, Yan Y. Construction of a Ferroptosis-Related Nine-lncRNA Signature for Predicting Prognosis and Immune Response in Hepatocellular Carcinoma. Front Immunol. 2021;12:719175. [RCA] [PubMed] [DOI] [Full Text] [Full Text (PDF)] [Cited by in Crossref: 129] [Cited by in RCA: 130] [Article Influence: 32.5] [Reference Citation Analysis (0)] |
| 7. | Ying F, Chan MSM, Lee TKW. Cancer-Associated Fibroblasts in Hepatocellular Carcinoma and Cholangiocarcinoma. Cell Mol Gastroenterol Hepatol. 2023;15:985-999. [RCA] [PubMed] [DOI] [Full Text] [Full Text (PDF)] [Cited by in Crossref: 28] [Cited by in RCA: 50] [Article Influence: 25.0] [Reference Citation Analysis (0)] |
| 8. | El-Serag HB. Hepatocellular carcinoma: recent trends in the United States. Gastroenterology. 2004;127:S27-S34. [RCA] [PubMed] [DOI] [Full Text] [Cited by in Crossref: 738] [Cited by in RCA: 723] [Article Influence: 34.4] [Reference Citation Analysis (0)] |
| 9. | Zhang J, Gu C, Song Q, Zhu M, Xu Y, Xiao M, Zheng W. Identifying cancer-associated fibroblasts as emerging targets for hepatocellular carcinoma. Cell Biosci. 2020;10:127. [RCA] [PubMed] [DOI] [Full Text] [Full Text (PDF)] [Cited by in Crossref: 22] [Cited by in RCA: 59] [Article Influence: 11.8] [Reference Citation Analysis (0)] |
| 10. | Loh JJ, Li TW, Zhou L, Wong TL, Liu X, Ma VWS, Lo CM, Man K, Lee TK, Ning W, Tong M, Ma S. FSTL1 Secreted by Activated Fibroblasts Promotes Hepatocellular Carcinoma Metastasis and Stemness. Cancer Res. 2021;81:5692-5705. [RCA] [PubMed] [DOI] [Full Text] [Cited by in Crossref: 10] [Cited by in RCA: 69] [Article Influence: 17.3] [Reference Citation Analysis (0)] |
| 11. | Affo S, Yu LX, Schwabe RF. The Role of Cancer-Associated Fibroblasts and Fibrosis in Liver Cancer. Annu Rev Pathol. 2017;12:153-186. [RCA] [PubMed] [DOI] [Full Text] [Cited by in Crossref: 263] [Cited by in RCA: 511] [Article Influence: 56.8] [Reference Citation Analysis (0)] |
| 12. | Kim KH, Roberts CW. Targeting EZH2 in cancer. Nat Med. 2016;22:128-134. [RCA] [PubMed] [DOI] [Full Text] [Cited by in Crossref: 1059] [Cited by in RCA: 1154] [Article Influence: 128.2] [Reference Citation Analysis (0)] |
| 13. | Chen S, Pu J, Bai J, Yin Y, Wu K, Wang J, Shuai X, Gao J, Tao K, Wang G, Li H. EZH2 promotes hepatocellular carcinoma progression through modulating miR-22/galectin-9 axis. J Exp Clin Cancer Res. 2018;37:3. [RCA] [PubMed] [DOI] [Full Text] [Full Text (PDF)] [Cited by in Crossref: 42] [Cited by in RCA: 61] [Article Influence: 8.7] [Reference Citation Analysis (0)] |
| 14. | Xin H, Lai Q, Zhou Y, He J, Song Y, Liao M, Sun J, Li M, Zhang M, Liang W, Bai Y, Zhang Y, Zhou Y. Noninvasive evaluation of neutrophil extracellular traps signature predicts clinical outcomes and immunotherapy response in hepatocellular carcinoma. Front Immunol. 2023;14:1134521. [RCA] [PubMed] [DOI] [Full Text] [Full Text (PDF)] [Cited by in RCA: 19] [Reference Citation Analysis (0)] |
| 15. | Chen M, Cao J, Hu J, Topatana W, Li S, Juengpanich S, Lin J, Tong C, Shen J, Zhang B, Wu J, Pocha C, Kudo M, Amedei A, Trevisani F, Sung PS, Zaydfudim VM, Kanda T, Cai X. Clinical-Radiomic Analysis for Pretreatment Prediction of Objective Response to First Transarterial Chemoembolization in Hepatocellular Carcinoma. Liver Cancer. 2021;10:38-51. [RCA] [PubMed] [DOI] [Full Text] [Cited by in Crossref: 84] [Cited by in RCA: 79] [Article Influence: 19.8] [Reference Citation Analysis (0)] |
| 16. | Shen Y, Liu J, Zhang L, Dong S, Zhang J, Liu Y, Zhou H, Dong W. Identification of Potential Biomarkers and Survival Analysis for Head and Neck Squamous Cell Carcinoma Using Bioinformatics Strategy: A Study Based on TCGA and GEO Datasets. Biomed Res Int. 2019;2019:7376034. [RCA] [PubMed] [DOI] [Full Text] [Full Text (PDF)] [Cited by in Crossref: 24] [Cited by in RCA: 40] [Article Influence: 6.7] [Reference Citation Analysis (0)] |
| 17. | Brenner RJ, Landgraf AD, Bum-Erdene K, Gonzalez-Gutierrez G, Meroueh SO. Crystal Packing Reveals a Potential Autoinhibited KRAS Dimer Interface and a Strategy for Small-Molecule Inhibition of RAS Signaling. Biochemistry. 2023;62:3206-3213. [RCA] [PubMed] [DOI] [Full Text] [Reference Citation Analysis (0)] |
| 18. | Li Q, Long X, Lin Y, Liang R, Li Y, Ge L. Computed tomography radiomics signature via machine learning predicts RRM2 and overall survival in hepatocellular carcinoma. J Gastrointest Oncol. 2023;14:1462-1477. [RCA] [PubMed] [DOI] [Full Text] [Full Text (PDF)] [Cited by in RCA: 3] [Reference Citation Analysis (0)] |
| 19. | Zhang W, Huang P. Cancer-stromal interactions: role in cell survival, metabolism and drug sensitivity. Cancer Biol Ther. 2011;11:150-156. [RCA] [PubMed] [DOI] [Full Text] [Full Text (PDF)] [Cited by in Crossref: 59] [Cited by in RCA: 58] [Article Influence: 4.1] [Reference Citation Analysis (0)] |
| 20. | Chen S, Morine Y, Tokuda K, Yamada S, Saito Y, Nishi M, Ikemoto T, Shimada M. Cancerassociated fibroblastinduced M2polarized macrophages promote hepatocellular carcinoma progression via the plasminogen activator inhibitor1 pathway. Int J Oncol. 2021;59. [RCA] [PubMed] [DOI] [Full Text] [Full Text (PDF)] [Cited by in Crossref: 14] [Cited by in RCA: 112] [Article Influence: 28.0] [Reference Citation Analysis (0)] |
| 21. | Tahmasebi Birgani M, Carloni V. Tumor Microenvironment, a Paradigm in Hepatocellular Carcinoma Progression and Therapy. Int J Mol Sci. 2017;18. [RCA] [PubMed] [DOI] [Full Text] [Full Text (PDF)] [Cited by in Crossref: 98] [Cited by in RCA: 138] [Article Influence: 17.3] [Reference Citation Analysis (0)] |
| 22. | Savickiene J, Treigyte G, Valiuliene G, Stirblyte I, Navakauskiene R. Epigenetic and molecular mechanisms underlying the antileukemic activity of the histone deacetylase inhibitor belinostat in human acute promyelocytic leukemia cells. Anticancer Drugs. 2014;25:938-949. [RCA] [PubMed] [DOI] [Full Text] [Cited by in Crossref: 26] [Cited by in RCA: 27] [Article Influence: 2.7] [Reference Citation Analysis (0)] |
| 23. | Wu SY, Xie ZY, Yan LY, Liu XF, Zhang Y, Wang DA, Dong J, Sun HT. The correlation of EZH2 expression with the progression and prognosis of hepatocellular carcinoma. BMC Immunol. 2022;23:28. [RCA] [PubMed] [DOI] [Full Text] [Full Text (PDF)] [Cited by in RCA: 4] [Reference Citation Analysis (0)] |
| 24. | Han Li C, Chen Y. Targeting EZH2 for cancer therapy: progress and perspective. Curr Protein Pept Sci. 2015;16:559-570. [RCA] [PubMed] [DOI] [Full Text] [Full Text (PDF)] [Cited by in Crossref: 45] [Cited by in RCA: 56] [Article Influence: 6.2] [Reference Citation Analysis (0)] |
| 25. | Lee J, Son MJ, Woolard K, Donin NM, Li A, Cheng CH, Kotliarova S, Kotliarov Y, Walling J, Ahn S, Kim M, Totonchy M, Cusack T, Ene C, Ma H, Su Q, Zenklusen JC, Zhang W, Maric D, Fine HA. Epigenetic-mediated dysfunction of the bone morphogenetic protein pathway inhibits differentiation of glioblastoma-initiating cells. Cancer Cell. 2008;13:69-80. [RCA] [PubMed] [DOI] [Full Text] [Full Text (PDF)] [Cited by in Crossref: 358] [Cited by in RCA: 346] [Article Influence: 20.4] [Reference Citation Analysis (0)] |
| 26. | Cao Q, Yu J, Dhanasekaran SM, Kim JH, Mani RS, Tomlins SA, Mehra R, Laxman B, Cao X, Yu J, Kleer CG, Varambally S, Chinnaiyan AM. Repression of E-cadherin by the polycomb group protein EZH2 in cancer. Oncogene. 2008;27:7274-7284. [RCA] [PubMed] [DOI] [Full Text] [Full Text (PDF)] [Cited by in Crossref: 472] [Cited by in RCA: 457] [Article Influence: 26.9] [Reference Citation Analysis (0)] |
| 27. | Liu H, Yan G, Li L, Wang D, Wang Y, Jin S, Jin Z, Li L, Zhu L. RUNX3 mediates keloid fibroblast proliferation through deacetylation of EZH2 by SIRT1. BMC Mol Cell Biol. 2022;23:52. [RCA] [PubMed] [DOI] [Full Text] [Reference Citation Analysis (0)] |
| 28. | Zhang J, Wang H, Chen H, Li H, Xu P, Liu B, Zhang Q, Lv C, Song X. ATF3 -activated accelerating effect of LINC00941/lncIAPF on fibroblast-to-myofibroblast differentiation by blocking autophagy depending on ELAVL1/HuR in pulmonary fibrosis. Autophagy. 2022;18:2636-2655. [RCA] [PubMed] [DOI] [Full Text] [Full Text (PDF)] [Cited by in Crossref: 4] [Cited by in RCA: 68] [Article Influence: 22.7] [Reference Citation Analysis (0)] |
| 29. | Huang B, Huang M, Li Q. Cancer-Associated Fibroblasts Promote Angiogenesis of Hepatocellular Carcinoma by VEGF-Mediated EZH2/VASH1 Pathway. Technol Cancer Res Treat. 2019;18:1533033819879905. [RCA] [PubMed] [DOI] [Full Text] [Full Text (PDF)] [Cited by in Crossref: 25] [Cited by in RCA: 56] [Article Influence: 11.2] [Reference Citation Analysis (0)] |
| 30. | Zhang L, Li HT, Shereda R, Lu Q, Weisenberger DJ, O'Connell C, Machida K, An W, Lenz HJ, El-Khoueiry A, Jones PA, Liu M, Liang G. DNMT and EZH2 inhibitors synergize to activate therapeutic targets in hepatocellular carcinoma. Cancer Lett. 2022;548:215899. [RCA] [PubMed] [DOI] [Full Text] [Cited by in Crossref: 14] [Cited by in RCA: 37] [Article Influence: 12.3] [Reference Citation Analysis (0)] |
| 31. | Yang Y, Zhang Y, Cao J, Su Z, Li F, Zhang P, Zhang B, Liu R, Zhang L, Xie J, Li J, Zhang J, Chen X, Hong A. FGFR4 and EZH2 inhibitors synergistically induce hepatocellular carcinoma apoptosis via repressing YAP signaling. J Exp Clin Cancer Res. 2023;42:96. [RCA] [PubMed] [DOI] [Full Text] [Cited by in RCA: 10] [Reference Citation Analysis (0)] |
| 32. | Feng Z, Li H, Liu Q, Duan J, Zhou W, Yu X, Chen Q, Liu Z, Wang W, Rong P. CT Radiomics to Predict Macrotrabecular-Massive Subtype and Immune Status in Hepatocellular Carcinoma. Radiology. 2023;307:e221291. [RCA] [PubMed] [DOI] [Full Text] [Cited by in RCA: 71] [Reference Citation Analysis (0)] |
| 33. | Xia TY, Zhou ZH, Meng XP, Zha JH, Yu Q, Wang WL, Song Y, Wang YC, Tang TY, Xu J, Zhang T, Long XY, Liang Y, Xiao WB, Ju SH. Predicting Microvascular Invasion in Hepatocellular Carcinoma Using CT-based Radiomics Model. Radiology. 2023;307:e222729. [RCA] [PubMed] [DOI] [Full Text] [Cited by in RCA: 103] [Reference Citation Analysis (1)] |
| 34. | van Griethuysen JJM, Fedorov A, Parmar C, Hosny A, Aucoin N, Narayan V, Beets-Tan RGH, Fillion-Robin JC, Pieper S, Aerts HJWL. Computational Radiomics System to Decode the Radiographic Phenotype. Cancer Res. 2017;77:e104-e107. [RCA] [PubMed] [DOI] [Full Text] [Cited by in Crossref: 1922] [Cited by in RCA: 3897] [Article Influence: 487.1] [Reference Citation Analysis (0)] |
| 35. | Pintaric K, Salapura V, Snoj Z, Vovk A, Mijovski MB, Vidmar J. Assessment of short-term effect of platelet-rich plasma treatment of tendinosis using texture analysis of ultrasound images. Radiol Oncol. 2023;57:465-472. [RCA] [PubMed] [DOI] [Full Text] [Reference Citation Analysis (0)] |


