Published online Feb 6, 2023. doi: 10.12998/wjcc.v11.i4.738
Peer-review started: October 12, 2022
First decision: December 13, 2022
Revised: December 13, 2022
Accepted: January 3, 2023
Article in press: January 3, 2023
Published online: February 6, 2023
Processing time: 116 Days and 15.9 Hours
The tumor microenvironment (TME) plays an important role in the growth and expansion of gastric cancer (GC). Studies have identified that CD93 is involved in abnormal tumor angiogenesis, which may be related to the regulation of the TME.
To determine the role of CD93 in GC.
Transcriptomic data of GC was investigated in a cohort from The Cancer Genome Atlas. Additionally, RNA-seq data sets from Gene Expression Omnibus (GSE118916, GSE52138, GSE79973, GSE19826, and GSE84433) were applied to validate the results. We performed the immune infiltration analyses using ESTIMATE, CIBERSORT, and ssGSEA. Furthermore, weighted gene co-exp
Compared to normal tissues, CD93 significantly enriched in tumor tissues (t = 4.669, 95%CI: 0.342-0.863, P < 0.001). Higher expression of CD93 was significantly associated with shorter overall survival (hazard ratio = 1.62, 95%CI: 1.09-2.4, P = 0.017), less proportion of CD8 T and activated natural killer cells in the TME (P < 0.05), and lower tumor mutation burden (t = 4.131, 95%CI: 0.721-0.256, P < 0.001). Genes co-expressed with CD93 were mainly enriched in angiogenesis. Moreover, 11 genes were identified with a strong relationship between CD93 and the immune microenvironment using WGCNA.
CD93 is a novel prognostic and diagnostic biomarker for GC, that is closely related to the immune infiltration in the TME. Although this retrospective study was a comprehensive analysis, the prospective cohort studies are preferred to further confirm these conclusions.
Core Tip: Gastric cancer (GC) is an aggressive malignancy, with a 5-year survival rate lower than 20%. The disease burden caused by GC remains heavy worldwide. In this study, various analyses were performed using transcriptomic profiles from the Gene Expression Omnibus databases and The Cancer Genome Atlas. Finally, enrichment analysis and protein-protein interaction network were constructed. CD93 is identified as a diagnostic and prognostic biomarker of GC, which is closely related to the immune infiltration in the tumor microenvironment. Then, Immune-related gene modules were identified to further reveal the relationship between CD93 and immune characteristics.
- Citation: Li Z, Zhang XJ, Sun CY, Fei H, Li ZF, Zhao DB. CD93 serves as a potential biomarker of gastric cancer and correlates with the tumor microenvironment. World J Clin Cases 2023; 11(4): 738-755
- URL: https://www.wjgnet.com/2307-8960/full/v11/i4/738.htm
- DOI: https://dx.doi.org/10.12998/wjcc.v11.i4.738
As a common malignancy of the digestive tract tumor, gastric cancer (GC) is the fourth leading cause of cancer-related mortality worldwide, and the 5-year survival rate of GC is lower than 20%[1]. Treatments for GC include endoscopic resection, surgery (D2 lymphadenectomy), perioperative or adjuvant chemotherapy, targeted therapy, immunotherapy, and so on. Among them, immunotherapy for GC has attracted more attention in recent years[2,3]. The tumor microenvironment (TME) refers to tumor cells and their surrounding cellular matrix, including blood vessels, and immune cells, and is an important factor influencing the effect of immunotherapy on GC[4]. Targeting and suppressing the immunosuppressive properties of the TME can enhance the overall response rate (ORR) to immunotherapy, including immune checkpoint inhibitors (ICIs)[5-7]. CD93 is known as a C1q receptor that is involved in a variety of biological processes, such as the inflammatory response, tumor angiogenesis, matrix regulation, and innate lymphoid cell function [8-10], which suggests that CD93 may participate in the regulation of the TME. A recent study has found that blocking the CD93 pathway contributes to drug transport and immunotherapy efficacy by normalizing the vasculature of tumors. CD93 pathway blockade can improve the efficacy of chemotherapy and immunotherapy[11]. Although the roleof CD93 in some tumors has been explored, the specific role of CD93 in GC is still unclear.
Given these considerations, we were deeply interested in the relationship between CD93 and immune infiltration in the TME and the value of CD93 in the diagnosis, prognosis, and immunotherapy of GC. Therefore, the RNA-seq transcriptome profiles of stomach adenocarcinoma (STAD) within The Cancer Genome Atlas (TCGA) and Gene Expression Omnibus (GEO) were investigated. We first performed a pan-cancer analysis to identify the general significance of CD93 in cancers. Then, we divided patients with GC in this study into two groups according to the expression of CD93, and we compared the groups in terms of immune cell infiltration, gene mutation landscape, tumor mutational burden, and so on.
Gene expression RNA-seq (HTSeq-Counts, HTSeq-FPKM) and survival data in a cohort of TCGA Stomach Cancer were downloaded from UCSC Xena[12]. HTSeq-FPKM of 375 tumor samples and 32 normal samples were used for further analysis. HTSeq-Counts data were used to identify the differential expressed genes (DEGs) of low and high CD93 expression groups using the R package DESeq2[13] (|log2FoldChange| > 1 and adjusted P < 0.05). Expression profiling data in 5 datasets (GSE118916, GSE52138, GSE79973, GSE19826, and GSE84433) from GEO[14] were downloaded as validation sets.
Mutation data (MuTect2) including 414 patients with STAD from TCGA were processed using R package maftools[15]. The waterfall plot was used to show the genetic mutation using the R package ComplexHeatmap[16].
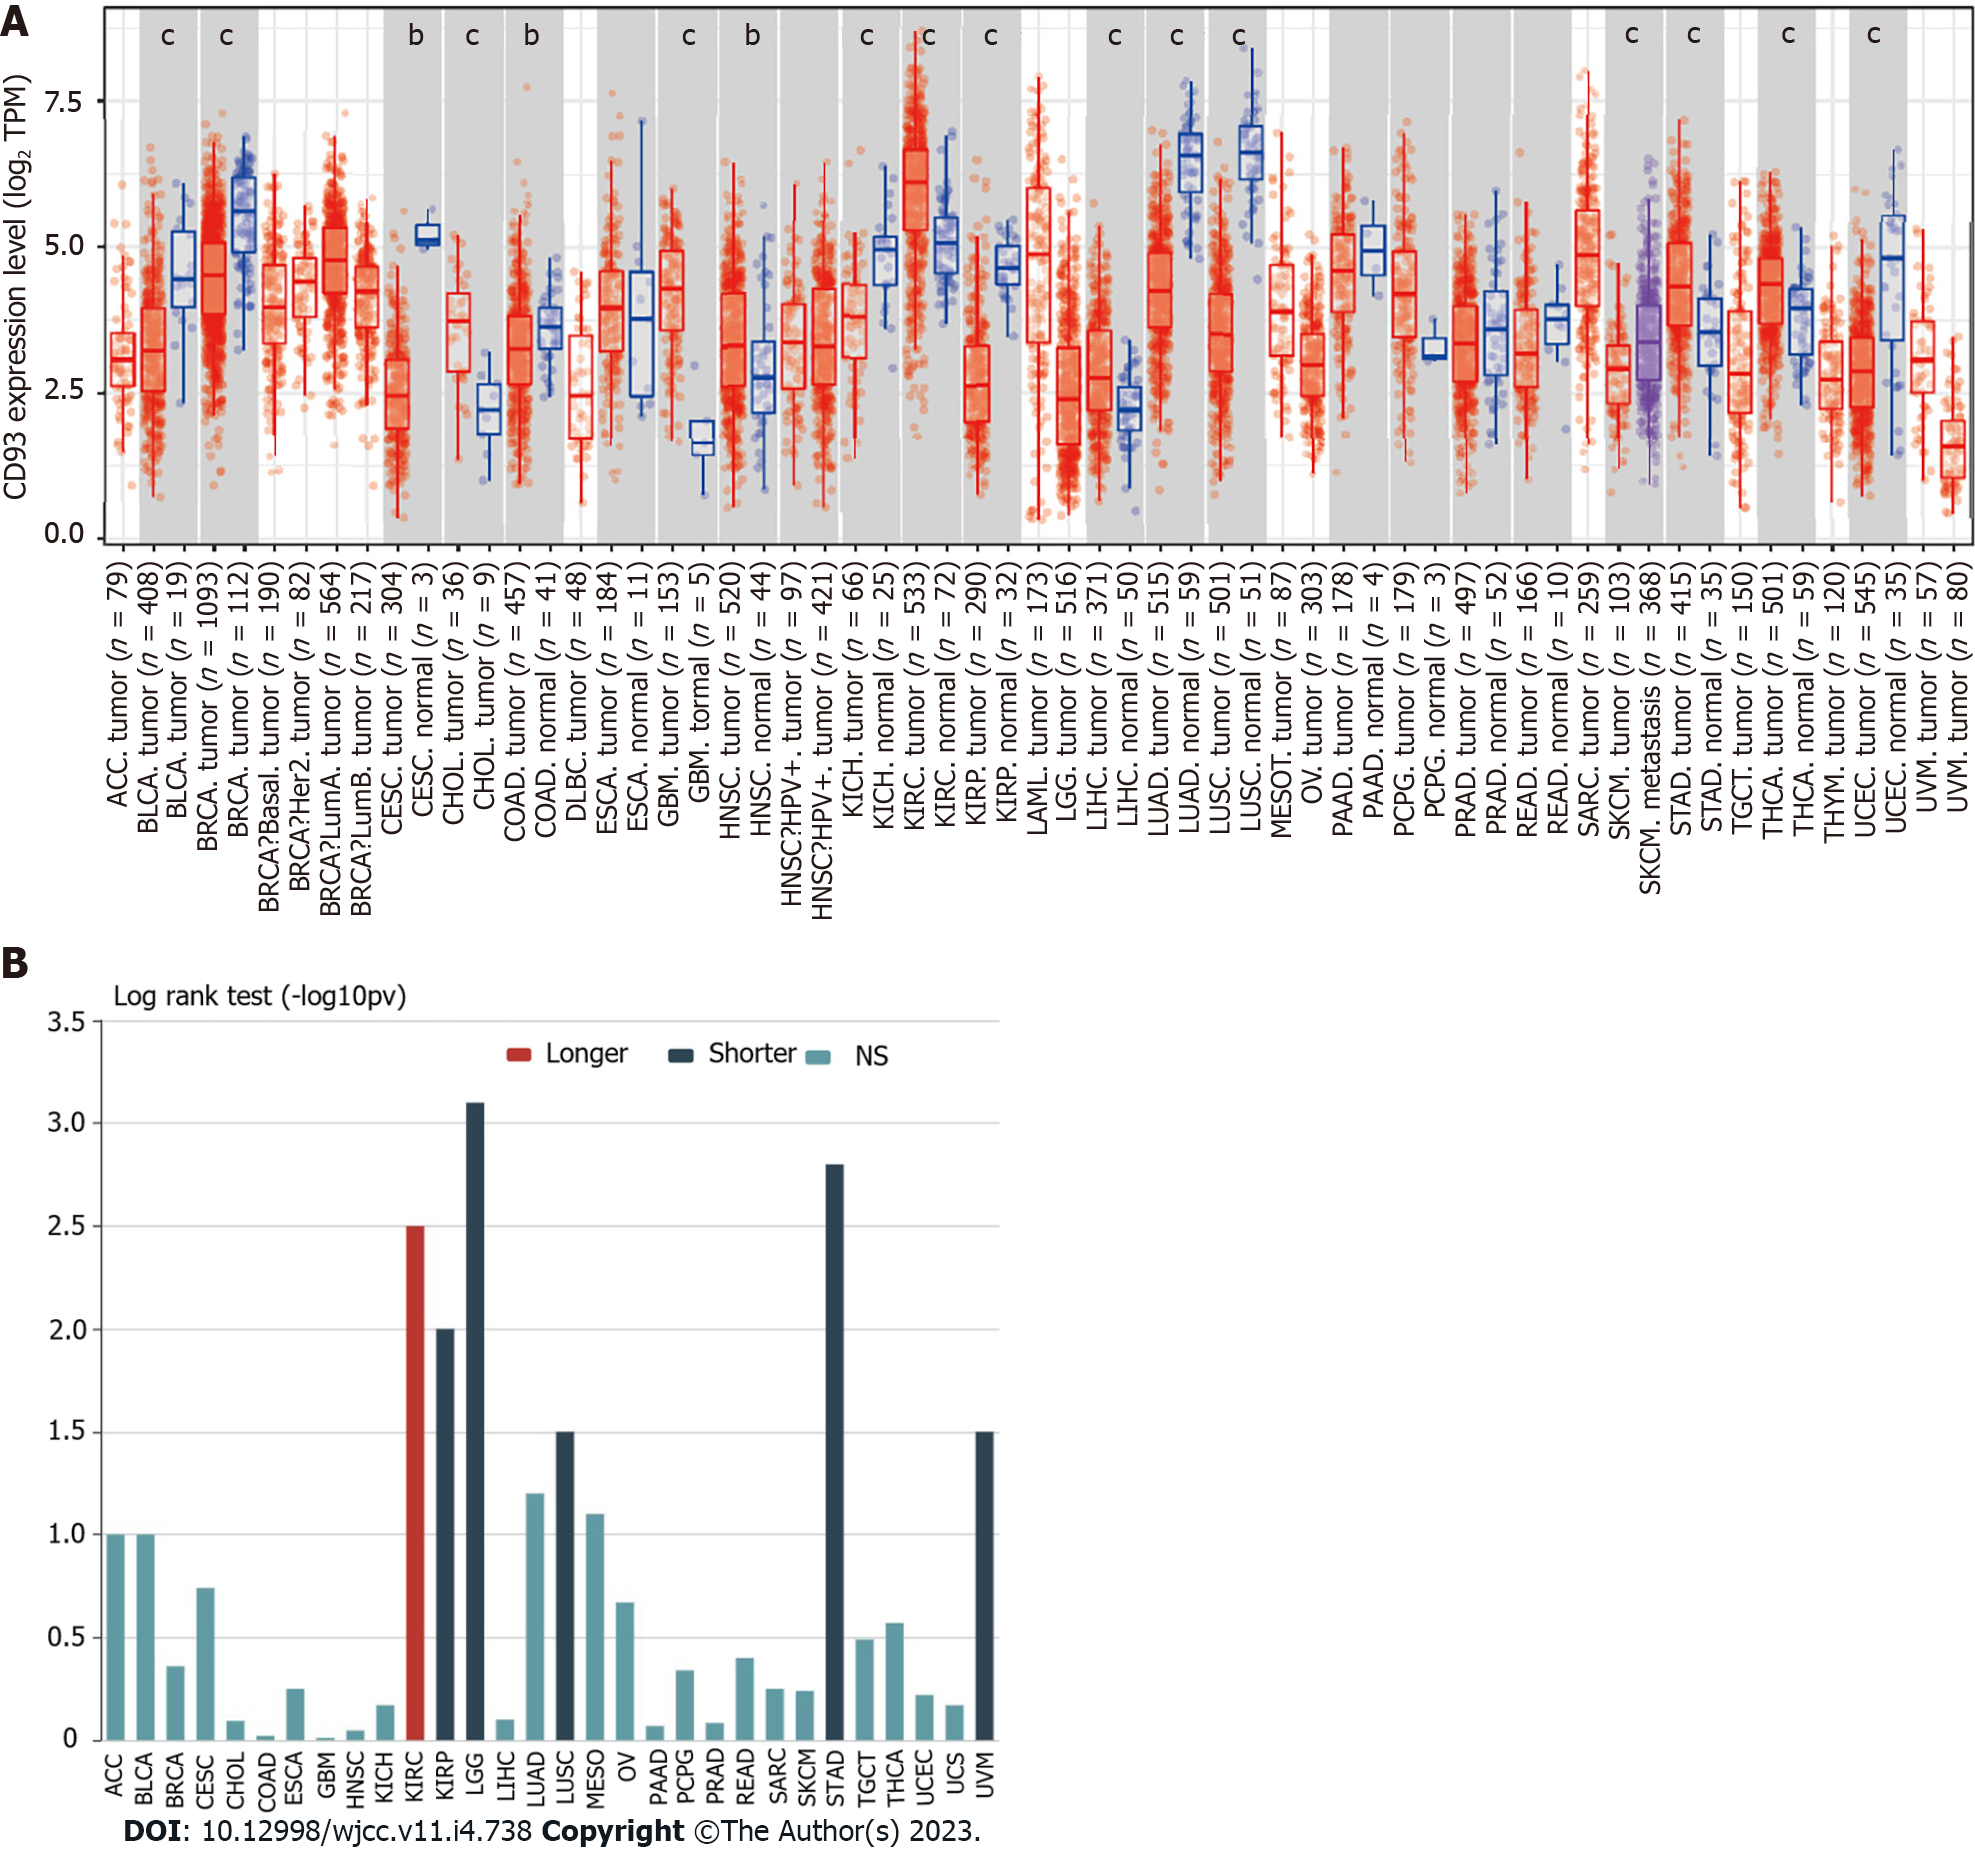
To understand the general significance of CD93 in cancers, we compared the expression levels of CD93 between tumor tissues and normal tissues in various cancer types using TIMER2.0[17]. Additionally, TISIDB[18] was also used to obtain the relationship between CD93 expression and the OS of these cancer types.
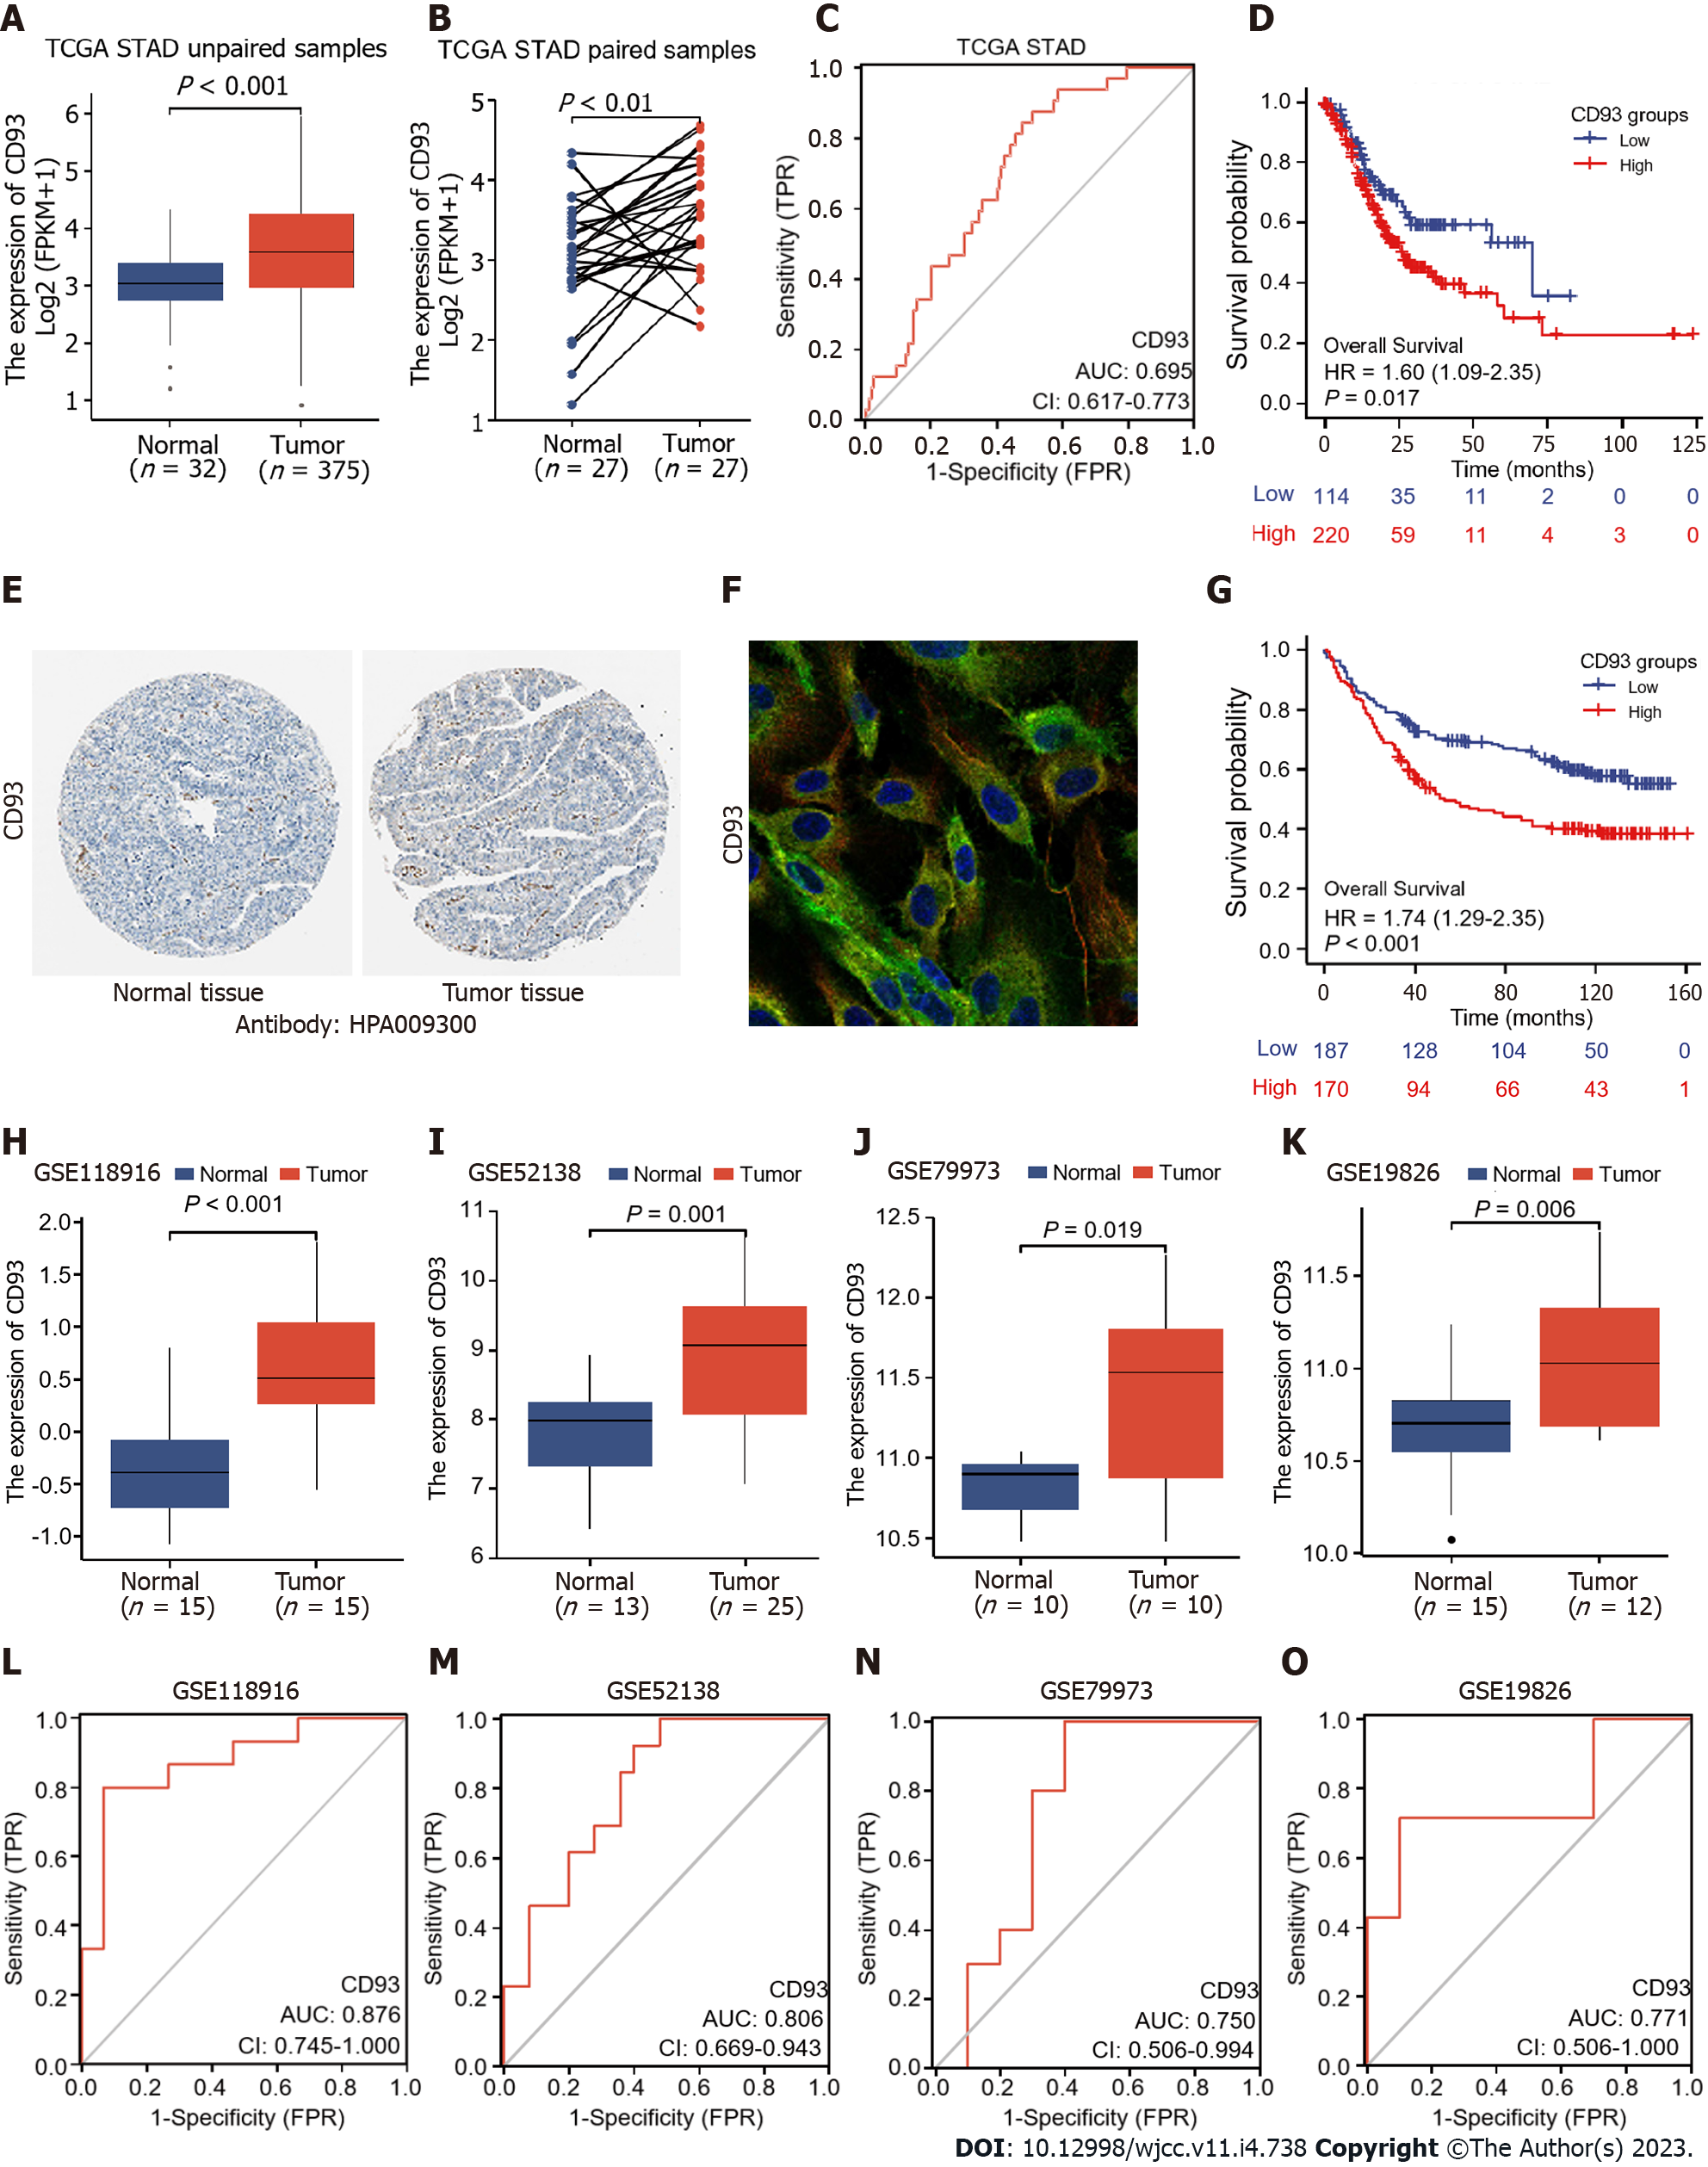
We compared CD93 expression levels of GC and normal tissues in both unpaired and paired samples and visualize outcomes using R package ggplot2. Receiver operating characteristic (ROC) curves and Kaplan-Meier survival analysis were conducted to further explore the diagnostic and prognostic value of CD93, and R packages pROC[19] and survminer were used for visualization, respectively. Univariate and multivariate COX proportional hazards models were established for better understanding. In addition, Immunohistochemistry and Immunofluorescence of CD93 were obtained from Human Protein Atlas[20].
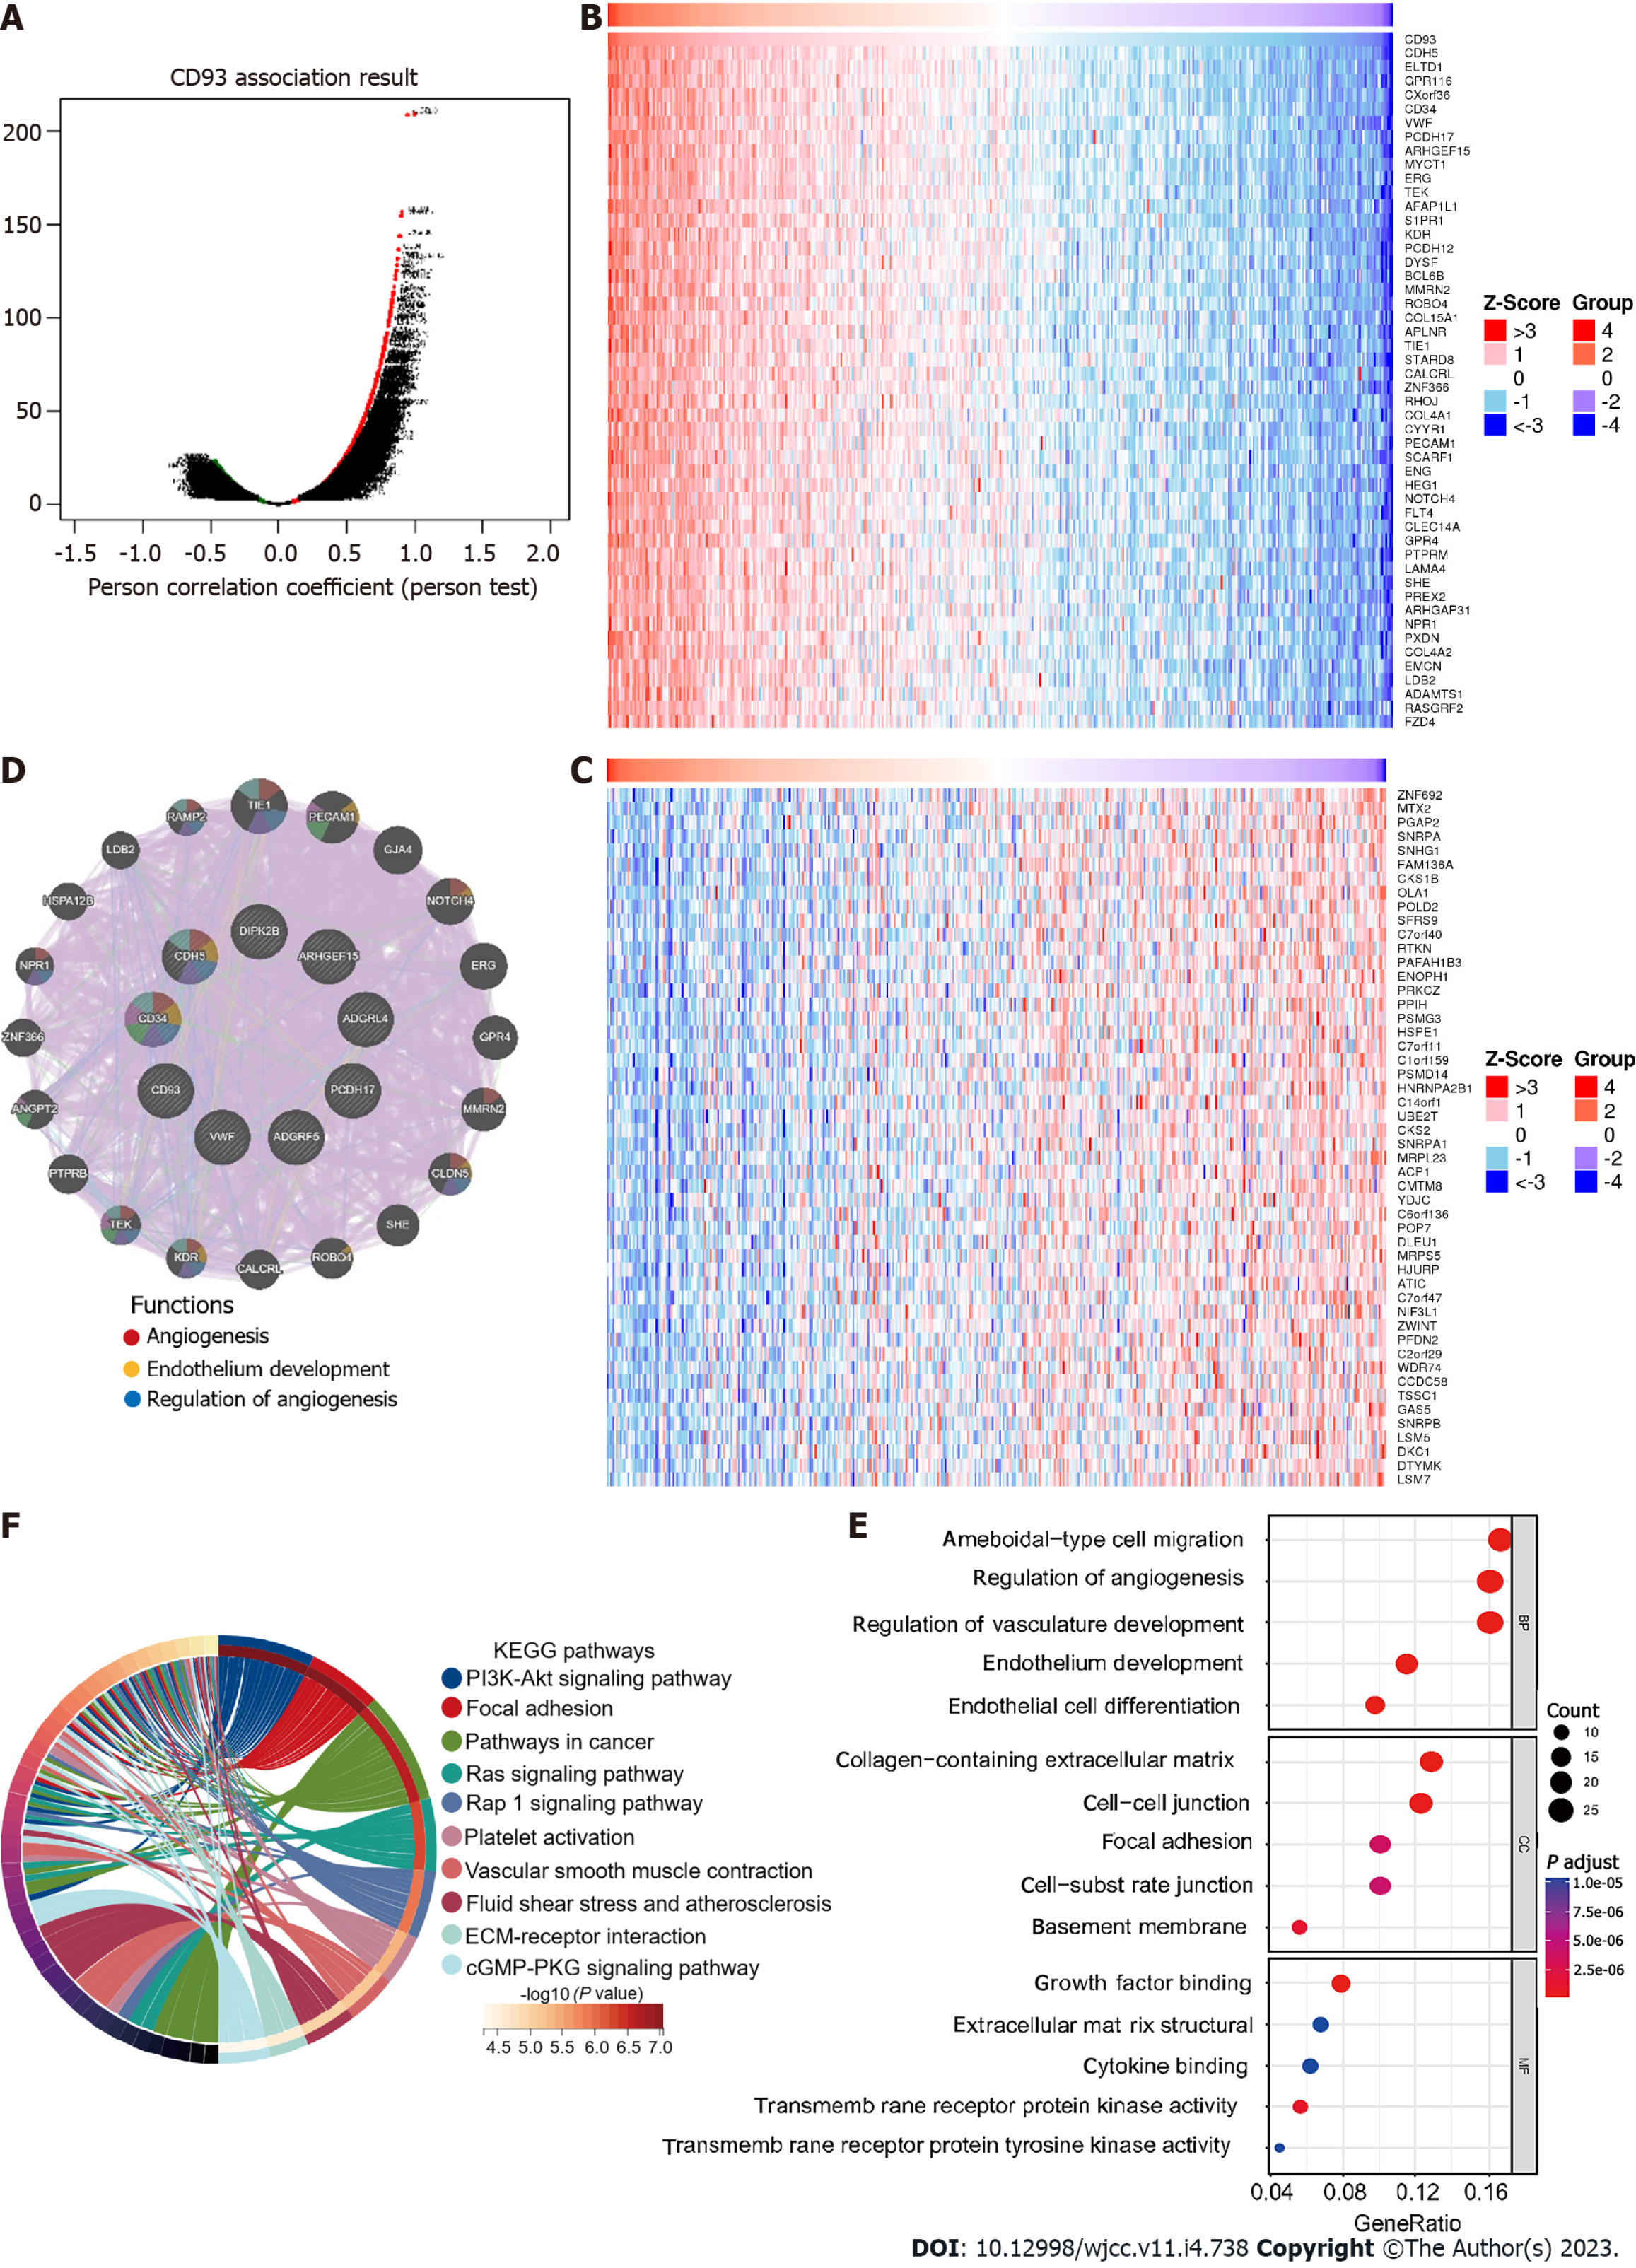
Genes that were significantly positively or negatively related to CD93 were identified using LinkedOmics[21]. Heatmaps were used to show the top 50 positively and the top 50 negatively correlated genes. Then, we constructed a protein-protein interaction (PPI) network of positively correlated genes via GeneMANIA[22]. Gene Ontology (GO) and Kyoto Encyclopedia of Genes and Genomes (KEGG) enrichment analyses of these genes were performed using the R package clusterProfiler[23].
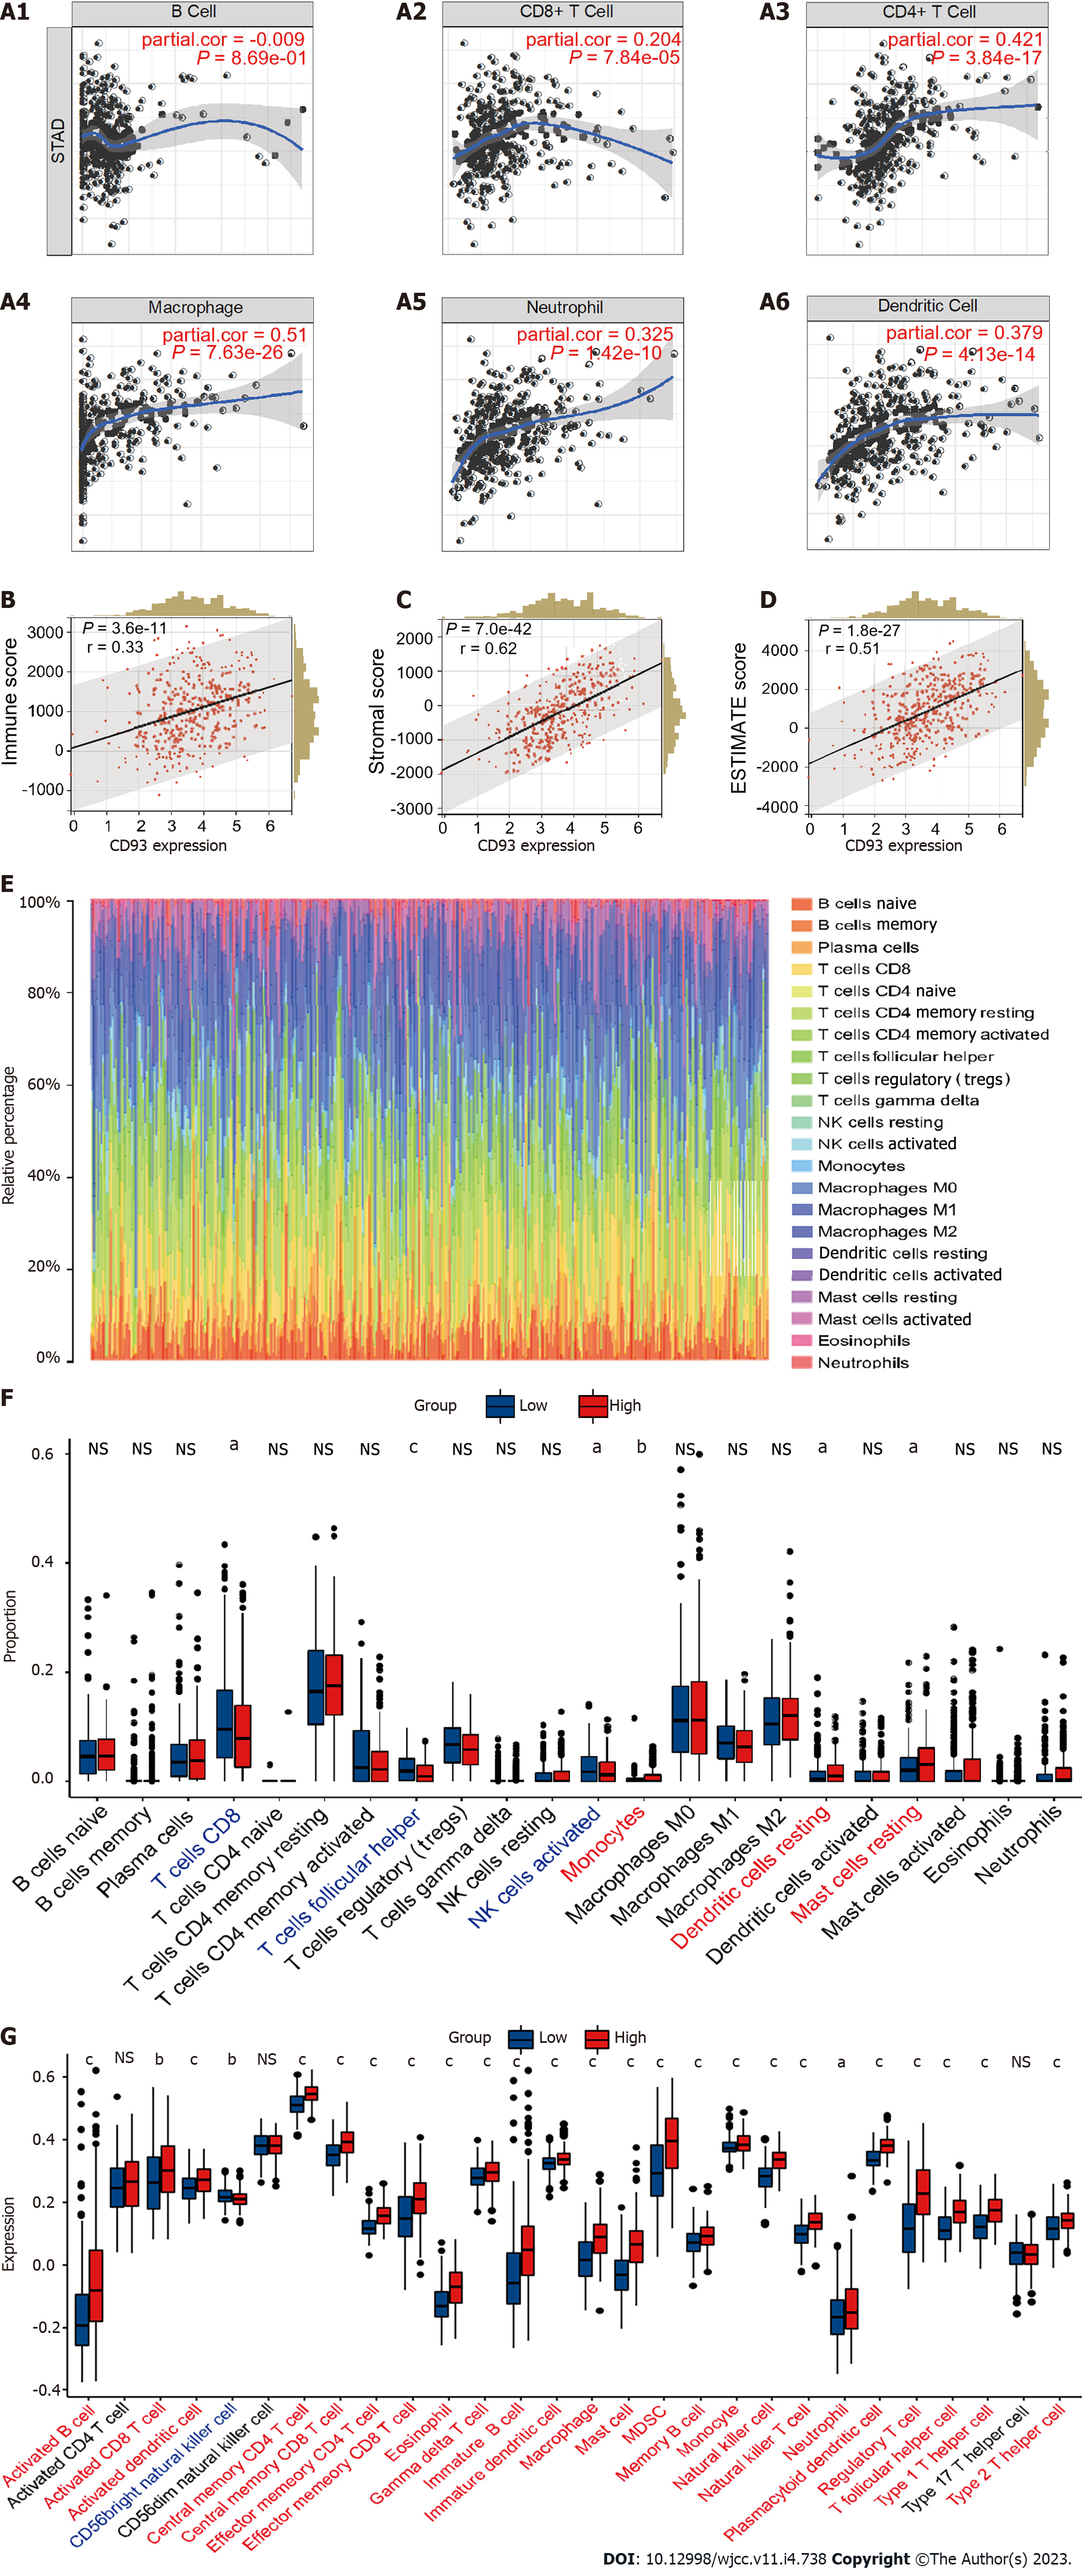
A plot from the TIMER[24] was used to show the correlations between the CD93 expression level and B cell, CD8+T Cell, CD4+T cell, macrophage, neutrophil, and dendritic cell. ESTIMATE is a method to identify the proportions of stromal and immune cells, which can bring the in-depth exploration of TME. We evaluated the immune score (immune component), stromal score (stromal component), and ESTIMATE score (comprehensive score of immunity and matrix) of each sample from TCGA and GEO using the R package estimate[25]. CIBERSORT[26] is a tool to characterize the cell composition of various tissues. We calculate the proportion of 22 immune cells in each sample with STAD using this method. Then, we conducted the ssGSEA to evaluate the infiltration level of 28 immune cell types based on the published immune gene sets[27] using the R package GSVA[28].
Weighted gene co-expression network analysis (WGCNA) was applied to identify the module genes related to CD93 and the immunity of patients with STAD using the R package WGCNA[29] (softPower = 4). Nine modules were obtained to calculate their relationships with stromal score, immune score, ESTIMATE score, and tumor purity. Finally, we identified 11 hub genes based on the value of module membership (MM) > 0.80 and gene significance (GS) > 0.85.
The PPI network and GO enrichment analysis of 11 hub genes were performed using the R package clusterProfiler and STRING[30], respectively. Then, we calculated Spearman’s correlation of 11 hub genes, hub gene-ESTIMATE, and hub gene-ssGSEA using the R package corrplot.
All statistical analyses mentioned in this article were conducted by R (version 4.2.0) and SPSS (version 25.0). Weltch’t test and Spearman’s coefficient were used for box plots and correlation analysis, respectively. We evaluated statistical significance using two-sided t-tests and defined it as aP < 0.05, bP < 0.01, and cP < 0.001.
The expression of CD93 between tumor and normal tissues in various cancers was compared using TIMER2.0, suggesting that CD93 expression was significantly different between tumor and normal tissues in various types of cancers (P < 0.05) (Figure 1A). We further investigated the effect of CD93 on OS across human cancers via the TISIDB. It showed that high CD93 expression led to shorter overall survival in STAD, kidney renal papillary cell carcinoma, brain lower-grade glioma, lung squamous cell carcinoma, and uveal melanoma, while leading to a longer one in kidney renal clear cell carcinoma (Figure 1B).
The CD93 expression levels of unpaired and paired samples from TCGA were both significantly higher in GC than in normal tissues (t = 4.669, 95%CI: 0.342-0.863, P < 0.001; t = 3.238, 95%CI: 0.196-0.877, P = 0.003) (Figure 2A and B). In addition, expression data obtained from GEO (GSE118916, GSE52138, GSE79973, and GSE19826) was applied for verification (Figure 2H-K). All datasets from TCGA and GEO showed a significantly higher expression of CD93 in GC tissues than in normal tissues (P < 0.05). Immunohistochemistry indicated higher CD93 expression in GC tissues than in normal tissues from the protein level (Figure 2E). Immunofluorescence indicated that CD93 mainly expressed in vesicles, plasma membrane, and toggle channels (Figure 2F). Furthermore, ROC curves were performed using the datasets mentioned above to evaluate the diagnostic value of CD93, the area under the curve was 0.695, 0.876, 0.806, 0.750, and 0.771, respectively (Figure 2C and L-O).
Samples from the TCGA STAD dataset were divided into two groups by the CD93 expression level, including the low CD93 expression group (low, n = 114) and the high CD93 expression group (high, n = 220). Kaplan-Meier analysis of two groups was conducted, suggesting that patients with high expression of CD93 had significantly shorter OS [hazard ratio (HR) = 1.60, 95%CI: 1.09-2.35, P = 0.017] (Figure 2D). In addition, we set GSE84433 with 357 GC patients as an external independent validation dataset and divided these patients into low-CD93 (low, n = 178) and high-CD93 (high, n = 179) expression groups. A similar result could be drawn from the Kaplan–Meier analysis that patients in the high-CD93 expression group had a shorter OS (HR: 1.74, 95%CI: 1.29-2.35, P < 0.001) (Figure 2G). Univariate and multivariate COX regression analysis were conducted as Table 1, indicating CD93 was a significant independent prognostic risk factor for GC (HR = 1.62, 95%CI: 1.09-2.40, P = 0.017). The baseline patient characteristics were summarized in Table 2.
| Characteristics | Univariate analysis | Multivariate analysis | ||||
| HR | 95%CI | P value | HR | 95%CI | P value | |
| Age | 1.02 | 1.01-1.04 | 0.002 | 1.03 | 1.02-1.05 | < 0.001 |
| Grade | ||||||
| G1 | Reference | |||||
| G2 | 2.64 | 0.36-19.18 | 0.337 | |||
| G3 | 3.53 | 0.49-25.38 | 0.209 | |||
| G4 | 3.54 | 0.37-34.07 | 0.274 | |||
| Gender | 1.31 | 0.91-1.9 | 0.145 | |||
| Stage | ||||||
| I | Reference | Reference | ||||
| II | 1.45 | 0.75-2.8 | 0.268 | 1.41 | 0.73-2.74 | 0.307 |
| III | 2.11 | 1.14-3.91 | 0.018 | 1.99 | 1.07-3.71 | 0.03 |
| IV | 3.65 | 1.81-7.39 | < 0.001 | 4.97 | 2.41-10.22 | < 0.001 |
| CD93 (high vs low) | 1.6 | 1.09-2.35 | 0.017 | 1.62 | 1.09-2.4 | 0.017 |
| Characteristics | high-CD93 (n = 220) | low-CD93 (n = 114) | Overall (n = 334) |
| Age, yr (mean ± SD) | 64.8 ± 12.8 | 64.1 ± 10.3 | 64.5 ± 12.0 |
| Gender, n (%) | |||
| Female | 72 (32.7) | 48 (42.1) | 120 (35.9) |
| Male | 148 (67.3) | 66 (57.9) | 214 (64.1) |
| Grade, n (%) | |||
| G1 | 4 (1.8) | 4 (3.5) | 8 (2.4) |
| G2 | 66 (30.0) | 50 (43.9) | 116 (34.7) |
| G3 | 143 (65.0) | 59 (51.8) | 202 (60.5) |
| GX | 7 (3.2) | 1 (0.9) | 8 (2.4) |
| pT, n (%) | |||
| T1 | 5 (2.3) | 10 (8.8) | 15 (4.5) |
| T2 | 45 (20.5) | 25 (21.9) | 70 (21.0) |
| T3 | 103 (46.8) | 53 (46.5) | 156 (46.7) |
| T4 | 67 (30.5) | 26 (22.8) | 93 (27.8) |
| pN, n (%) | |||
| N0 | 63 (28.6) | 40 (35.1) | 103 (30.8) |
| N1 | 62 (28.2) | 24 (21.1) | 86 (25.7) |
| N2 | 43 (19.5) | 26 (22.8) | 69 (20.7) |
| N3 | 48 (21.8) | 22 (19.3) | 70 (21.0) |
| NX | 4 (1.8) | 2 (1.8) | 6 (1.8) |
| pM, n (%) | |||
| M0 | 194 (88.2) | 105 (92.1) | 299 (89.5) |
| M1 | 17 (7.7) | 4 (3.5) | 21 (6.3) |
| MX | 9 (4.1) | 5 (4.4) | 14 (4.2) |
| Stage, n (%) | |||
| Stage I | 24 (10.9) | 22 (19.3) | 46 (13.8) |
| Stage II | 75 (34.1) | 35 (30.7) | 110 (32.9) |
| Stage III | 96 (43.6) | 48 (42.1) | 144 (43.1) |
| Stage IV | 25 (11.4) | 9 (7.9) | 34 (10.2) |
Correlation analysis with CD93 based on the Pearson test was conducted using LinkedOmics. The result was visualized by a volcano plot (Figure 3A). We obtained 7026 significantly positively correlated genes (red dots) and 5308 significantly negatively ones (green dots), respectively. In addition, we showed heatmaps of the top 50 positively correlated and the top 50 negatively correlated genes (Figure 3B and C). PPI network of the top 10 positive CD93 co-expressed genes was further constructed using GeneMANIA, suggesting functions of “angiogenesis”, “endothelium development”, and “regulation of angiogenesis” (Figure 3D). GO enrichment analysis of positive CD93 co-expressed genes mainly enriched in “ameboidal-type cell migration” (biological process), “collagen-containing extracellular matrix” (cell component), and “growth factor binding” (molecular function) (Figure 3E). KEGG pathway enrichment analysis indicated that these genes mainly participated in the “PI3K-Akt signaling pathway”, “Focal adhesion”, and “Pathways in cancer” (Figure 3F).
The expression of CD93 was positively proportional to CD8+T Cell, CD4+T cell, macrophage, neutrophil, and dendritic cell (P < 0.05) (Figure 4A). Furthermore, CD93 expression tended to have a positive correlation with ESTIMATE results (immune score, stromal score, and ESTIMATE score) (P < 0.05) (Figure 4B-D). Then, we performed the CIBERSORT for determining the proportion of 22 immune cells in each sample with STAD (Figure 4E). The proportion of 22 immune cells in two groups was compared using CIBERSORT, suggesting the proportion of CD8 T cells, follicular helper T cells, and activated NK cells in the high CD93 expression group was significantly lower than that in the low CD93 expression group, whereas Monocytes, Dendritic cells resting, and Mast cells resting had just the reverse (P < 0.05) (Figure 4F). ssGSEA showed that 24 types of immune cell (such as activated B cell, activated CD8 T cell, activated dendritic cell, central memory CD4 T cell, and central memory CD8 T cell) had a significantly higher expression in the high CD93 expression group, while CD56 bright natural killer (NK) cell had a lower expression in this group (P < 0.05) (Figure 4G).
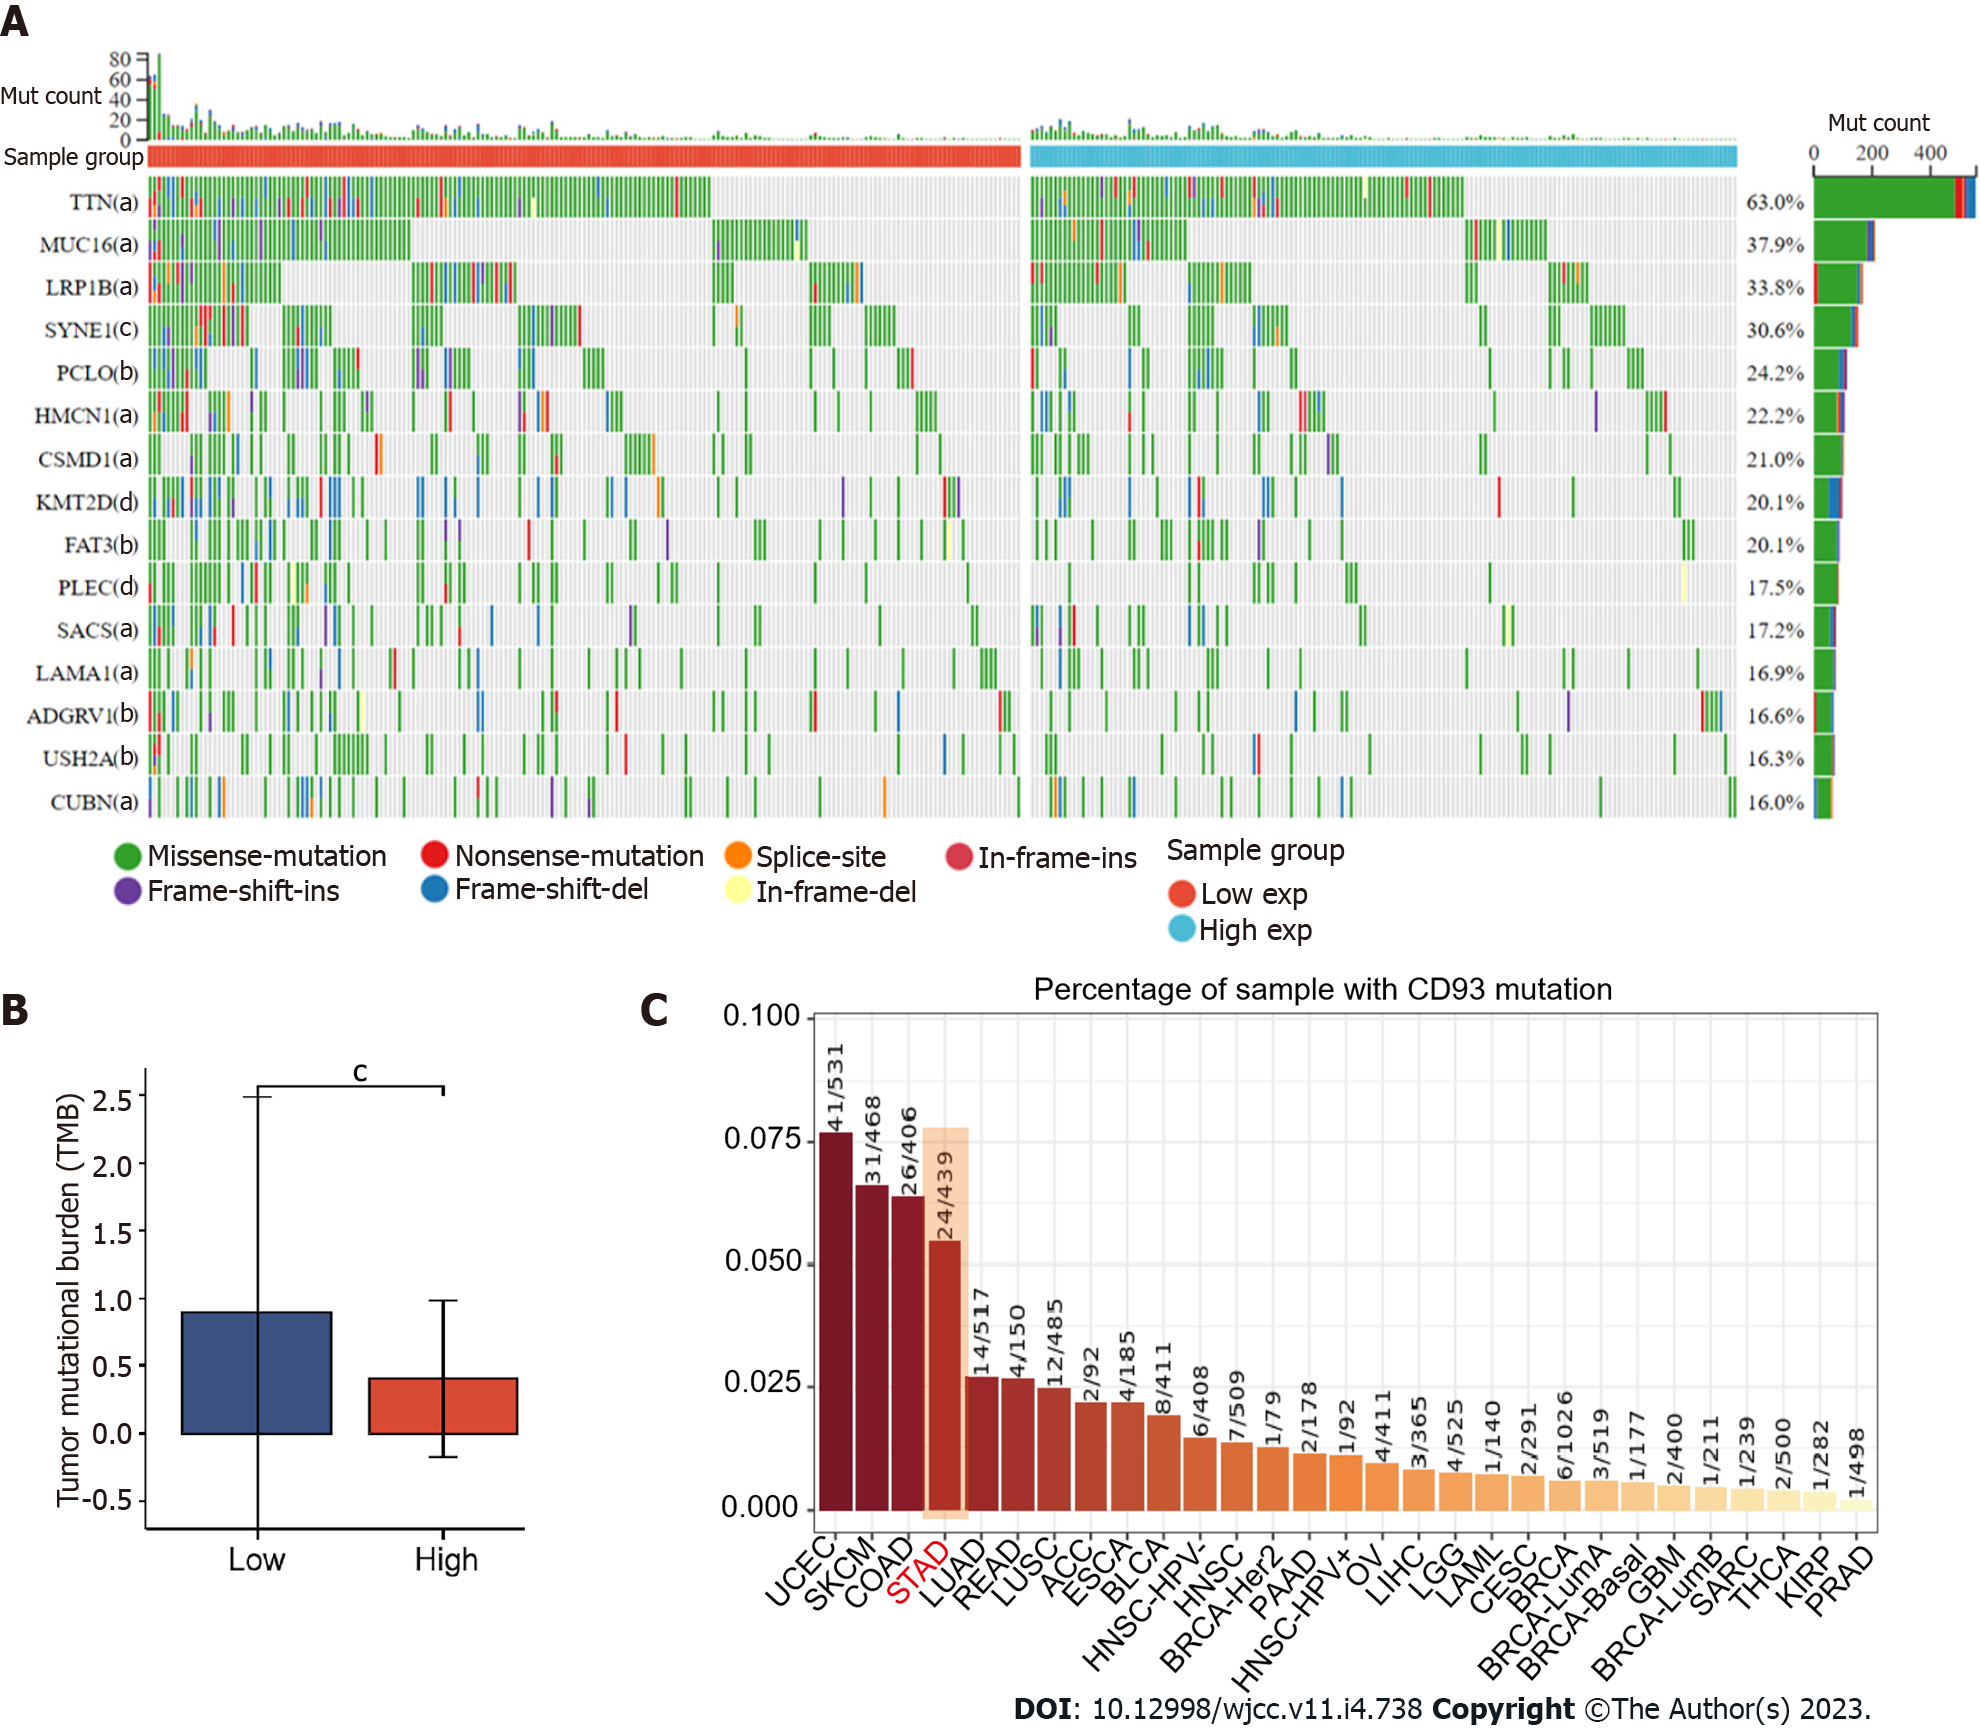
Gene mutation of GC is closely related to its therapeutic efficacy. Accordingly, a waterfall plot was used to identify the top 15 significant gene mutations (such as TTN, MUC16, and LRP1B) between two groups (P < 0.05) (Figure 5A). Furthermore, we made a comparison of tumor mutation burden (TMB) between low and high CD93 expression groups, which indicated that patients with high CD93 expression had a lower TMB (t = 4.131, 95%CI: 0.721-0.256, P < 0.001) (Figure 5B). The mutation rate of CD93 in GC ranked fourth in pan-cancer (Figure 5C).
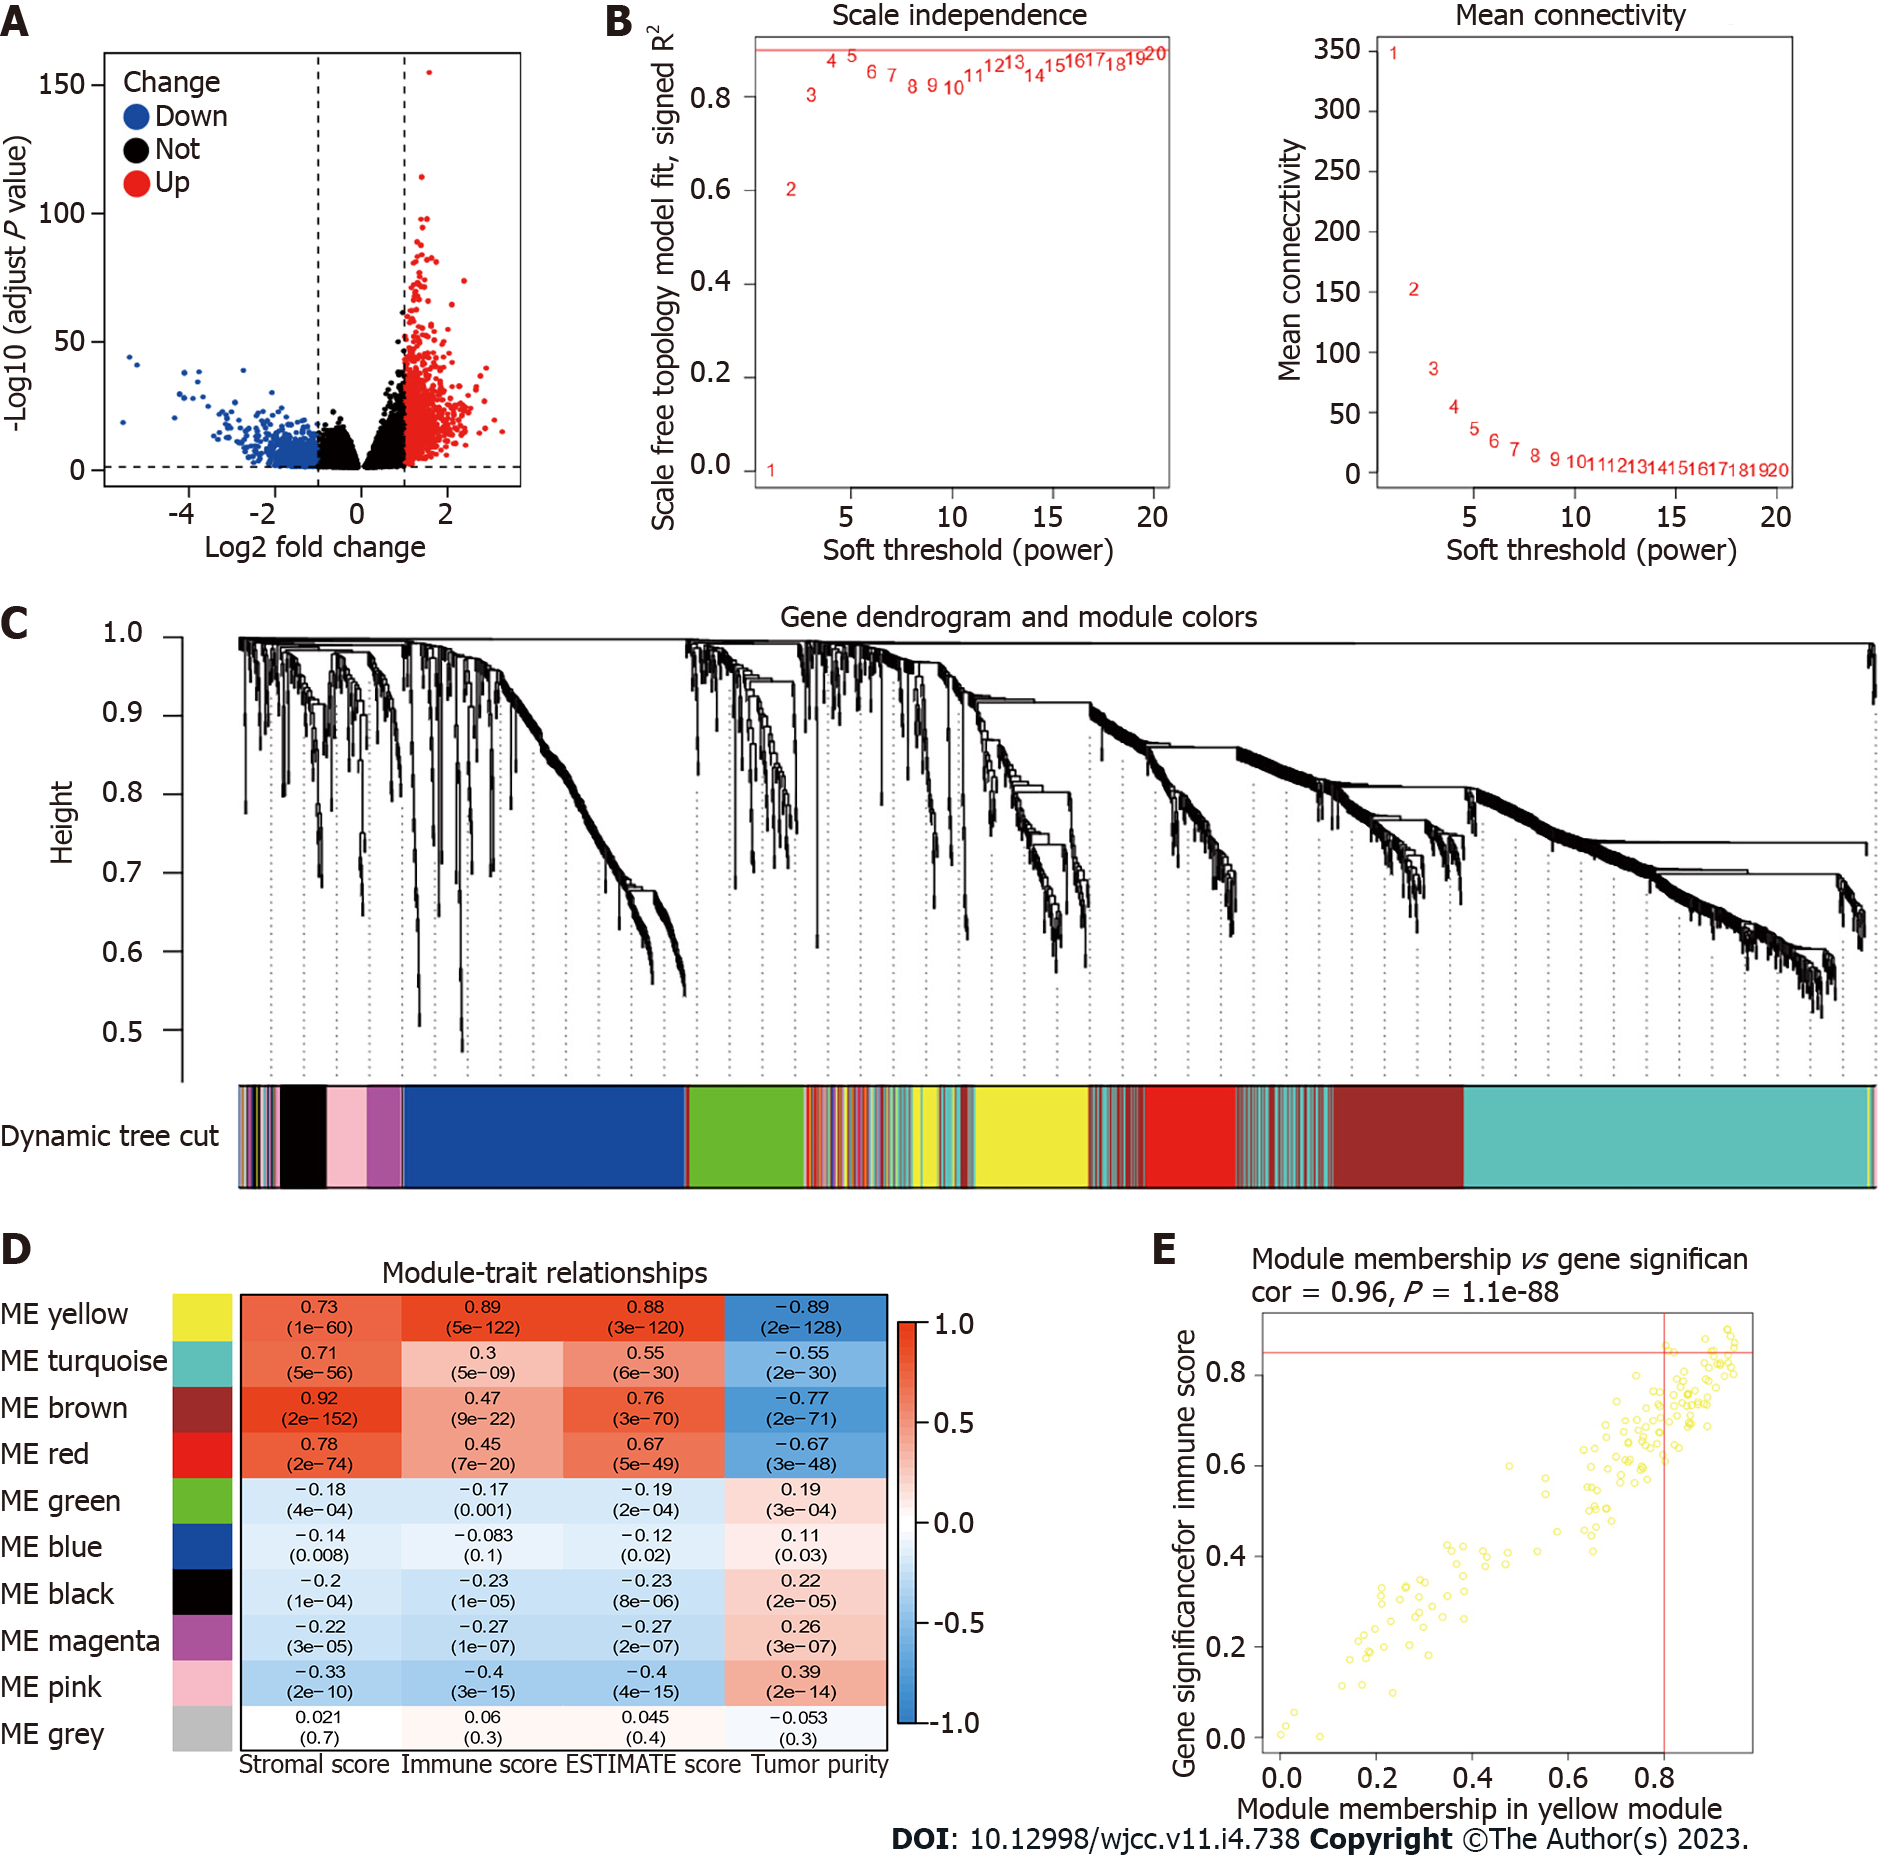
A total of 1679 DEGs (966 upregulated and 713 downregulated) were obtained between low and high CD93 expression groups. Then, we visualize the results using a volcano plot (Figure 6A). WGCNA was conducted to identify a module related to CD93 expression and immune infiltration (Figure 6B-D). The Yellow module was screened out because of its high correlation with immunity (r = 0.89, P = 5 × 10-122), hence we acquired 11 hub genes (MPEG1, IL10RA, SRGN, SLA, DOCK2, NCKAP1L, IKZF1, PTPRC, SIGLEC10, PLEK, P2RY10) from the yellow module based on MM > 0.80 and GS > 0.85 (Figure 6E).
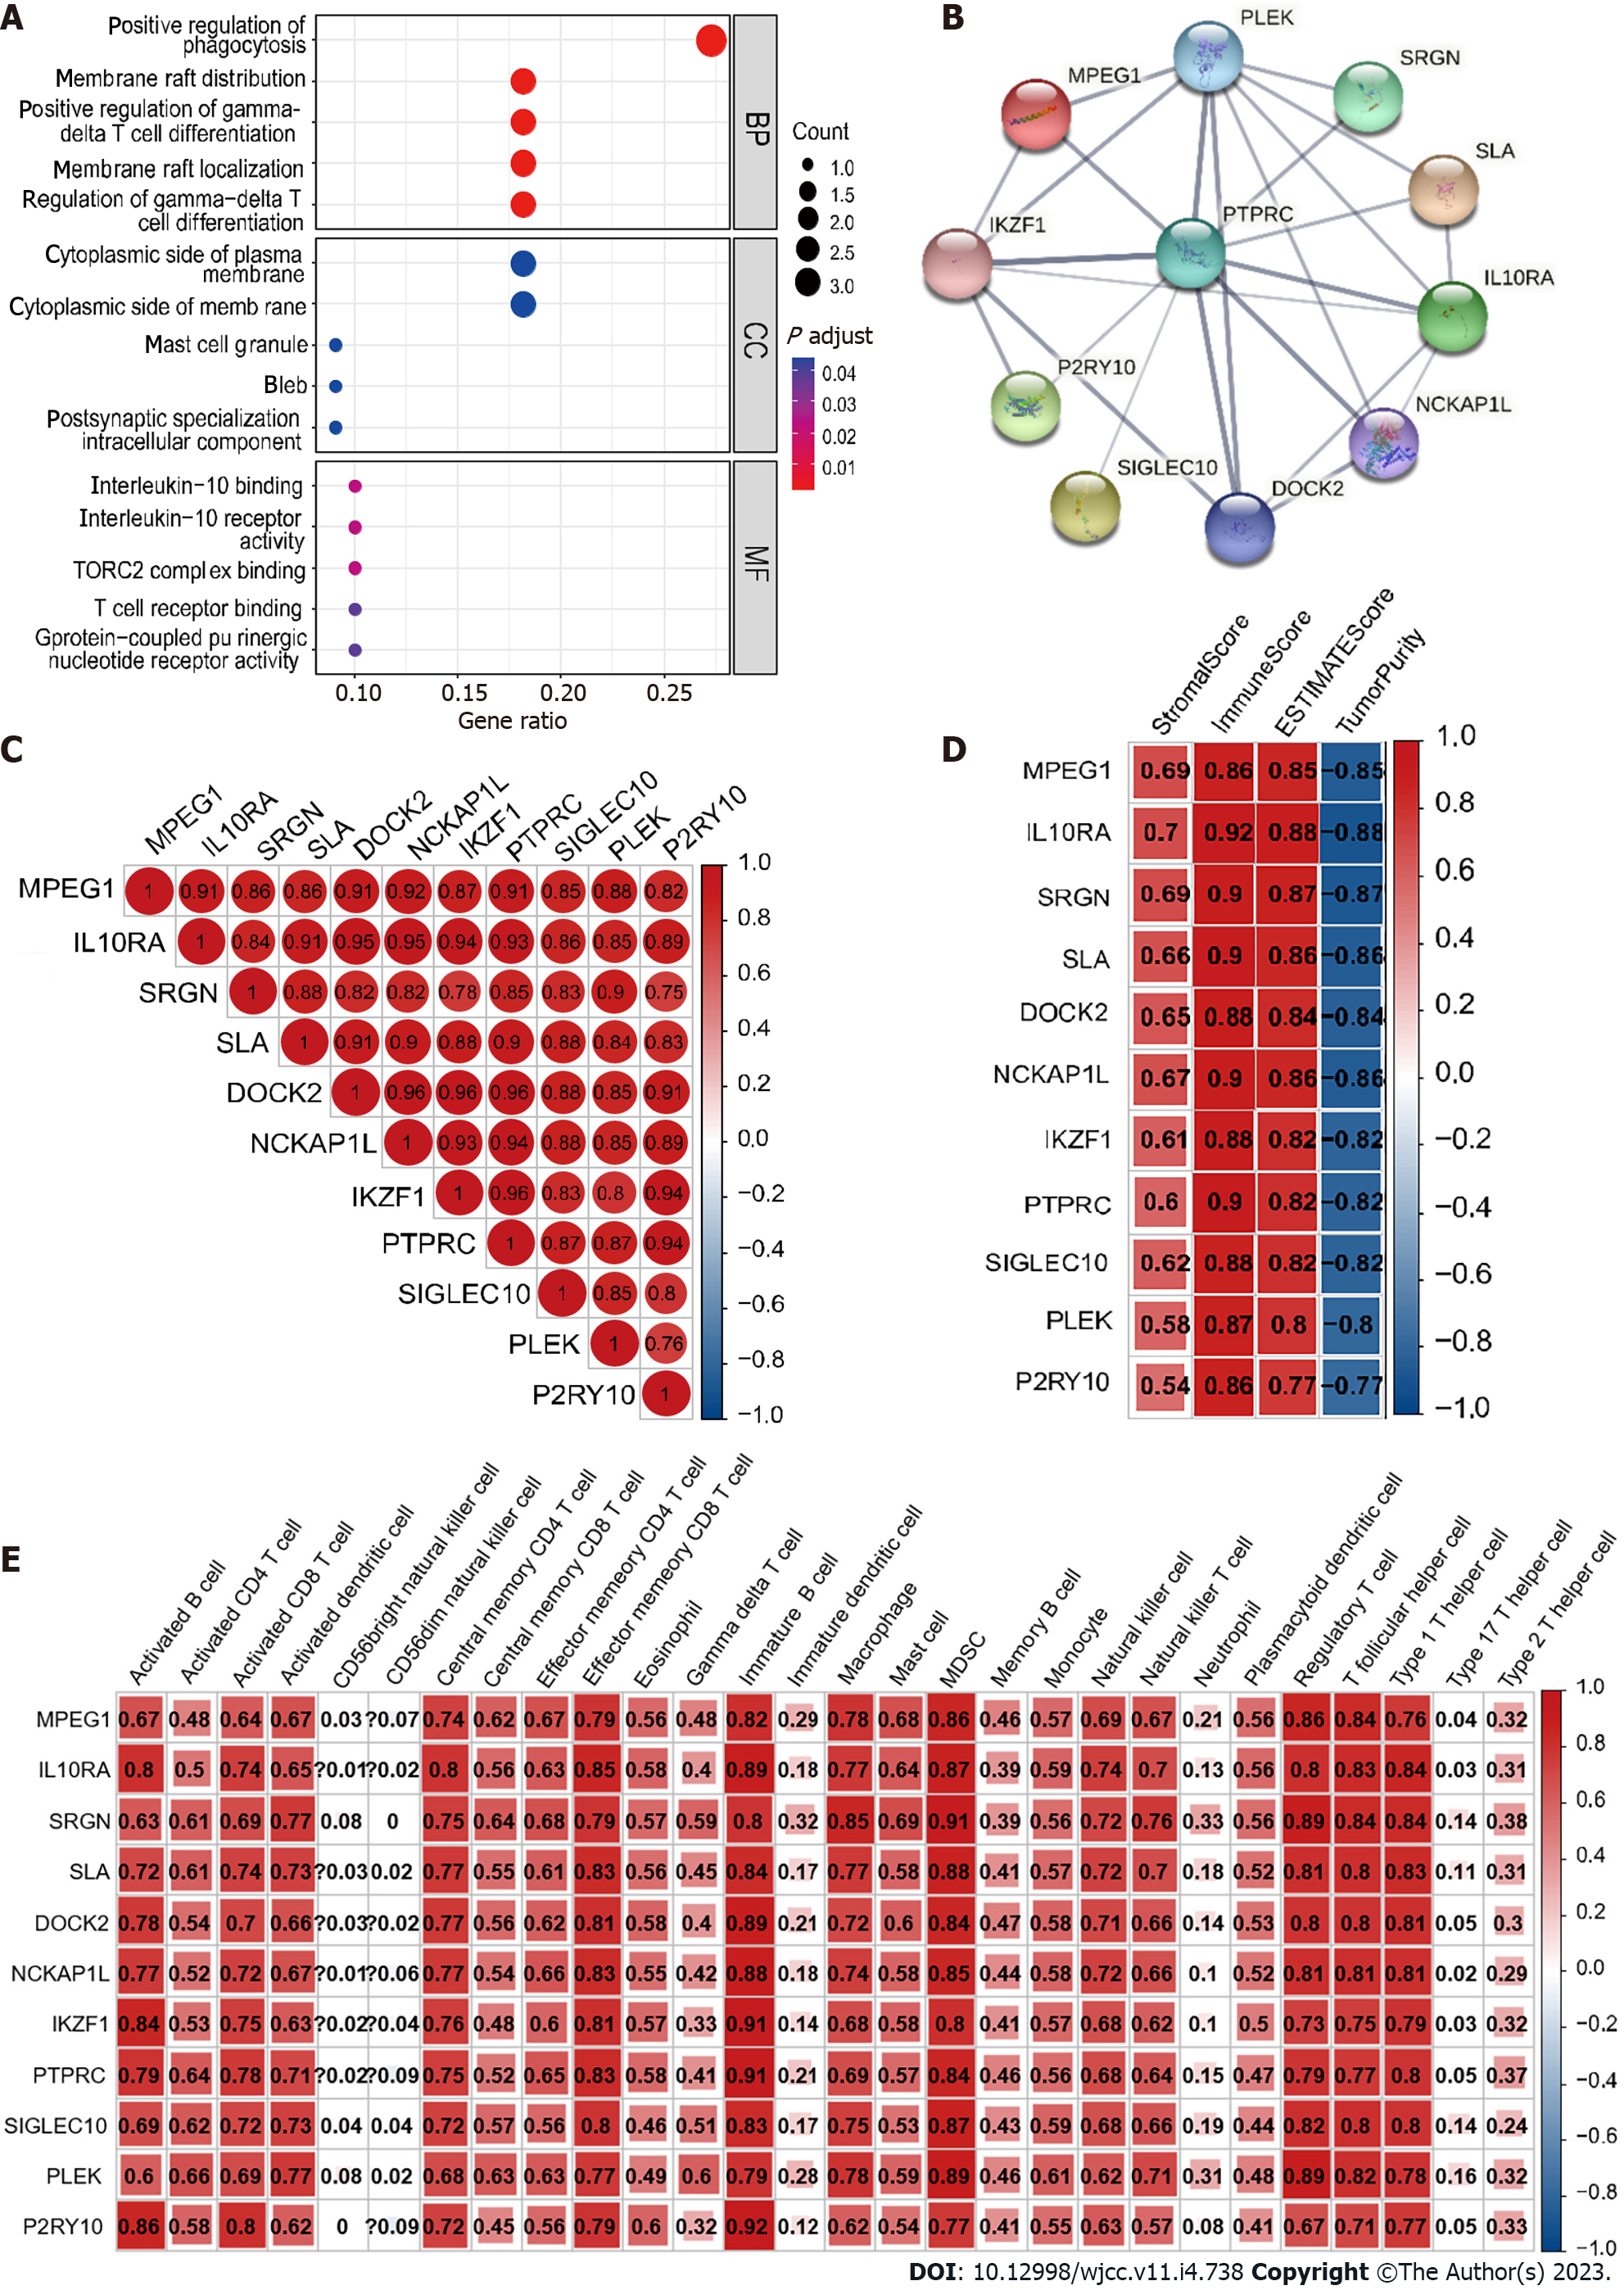
GO enrichment analysis identified these genes were mainly enriched in “positive regulation of phagocytosis” (biological process), “cytoplasmic side of plasma membrane” (cell component), and “interleukin-10 binding” (molecular function) (Figure 7A). Furthermore, we constructed a PPI network and made a correlation analysis of these genes (Figure 7B and C). Correlation analysis between these genes and TME (ESTIMATE and ssGSEA) suggested that these genes were closely related to both stromal components and immune infiltration in GC (Figure 7D and E).
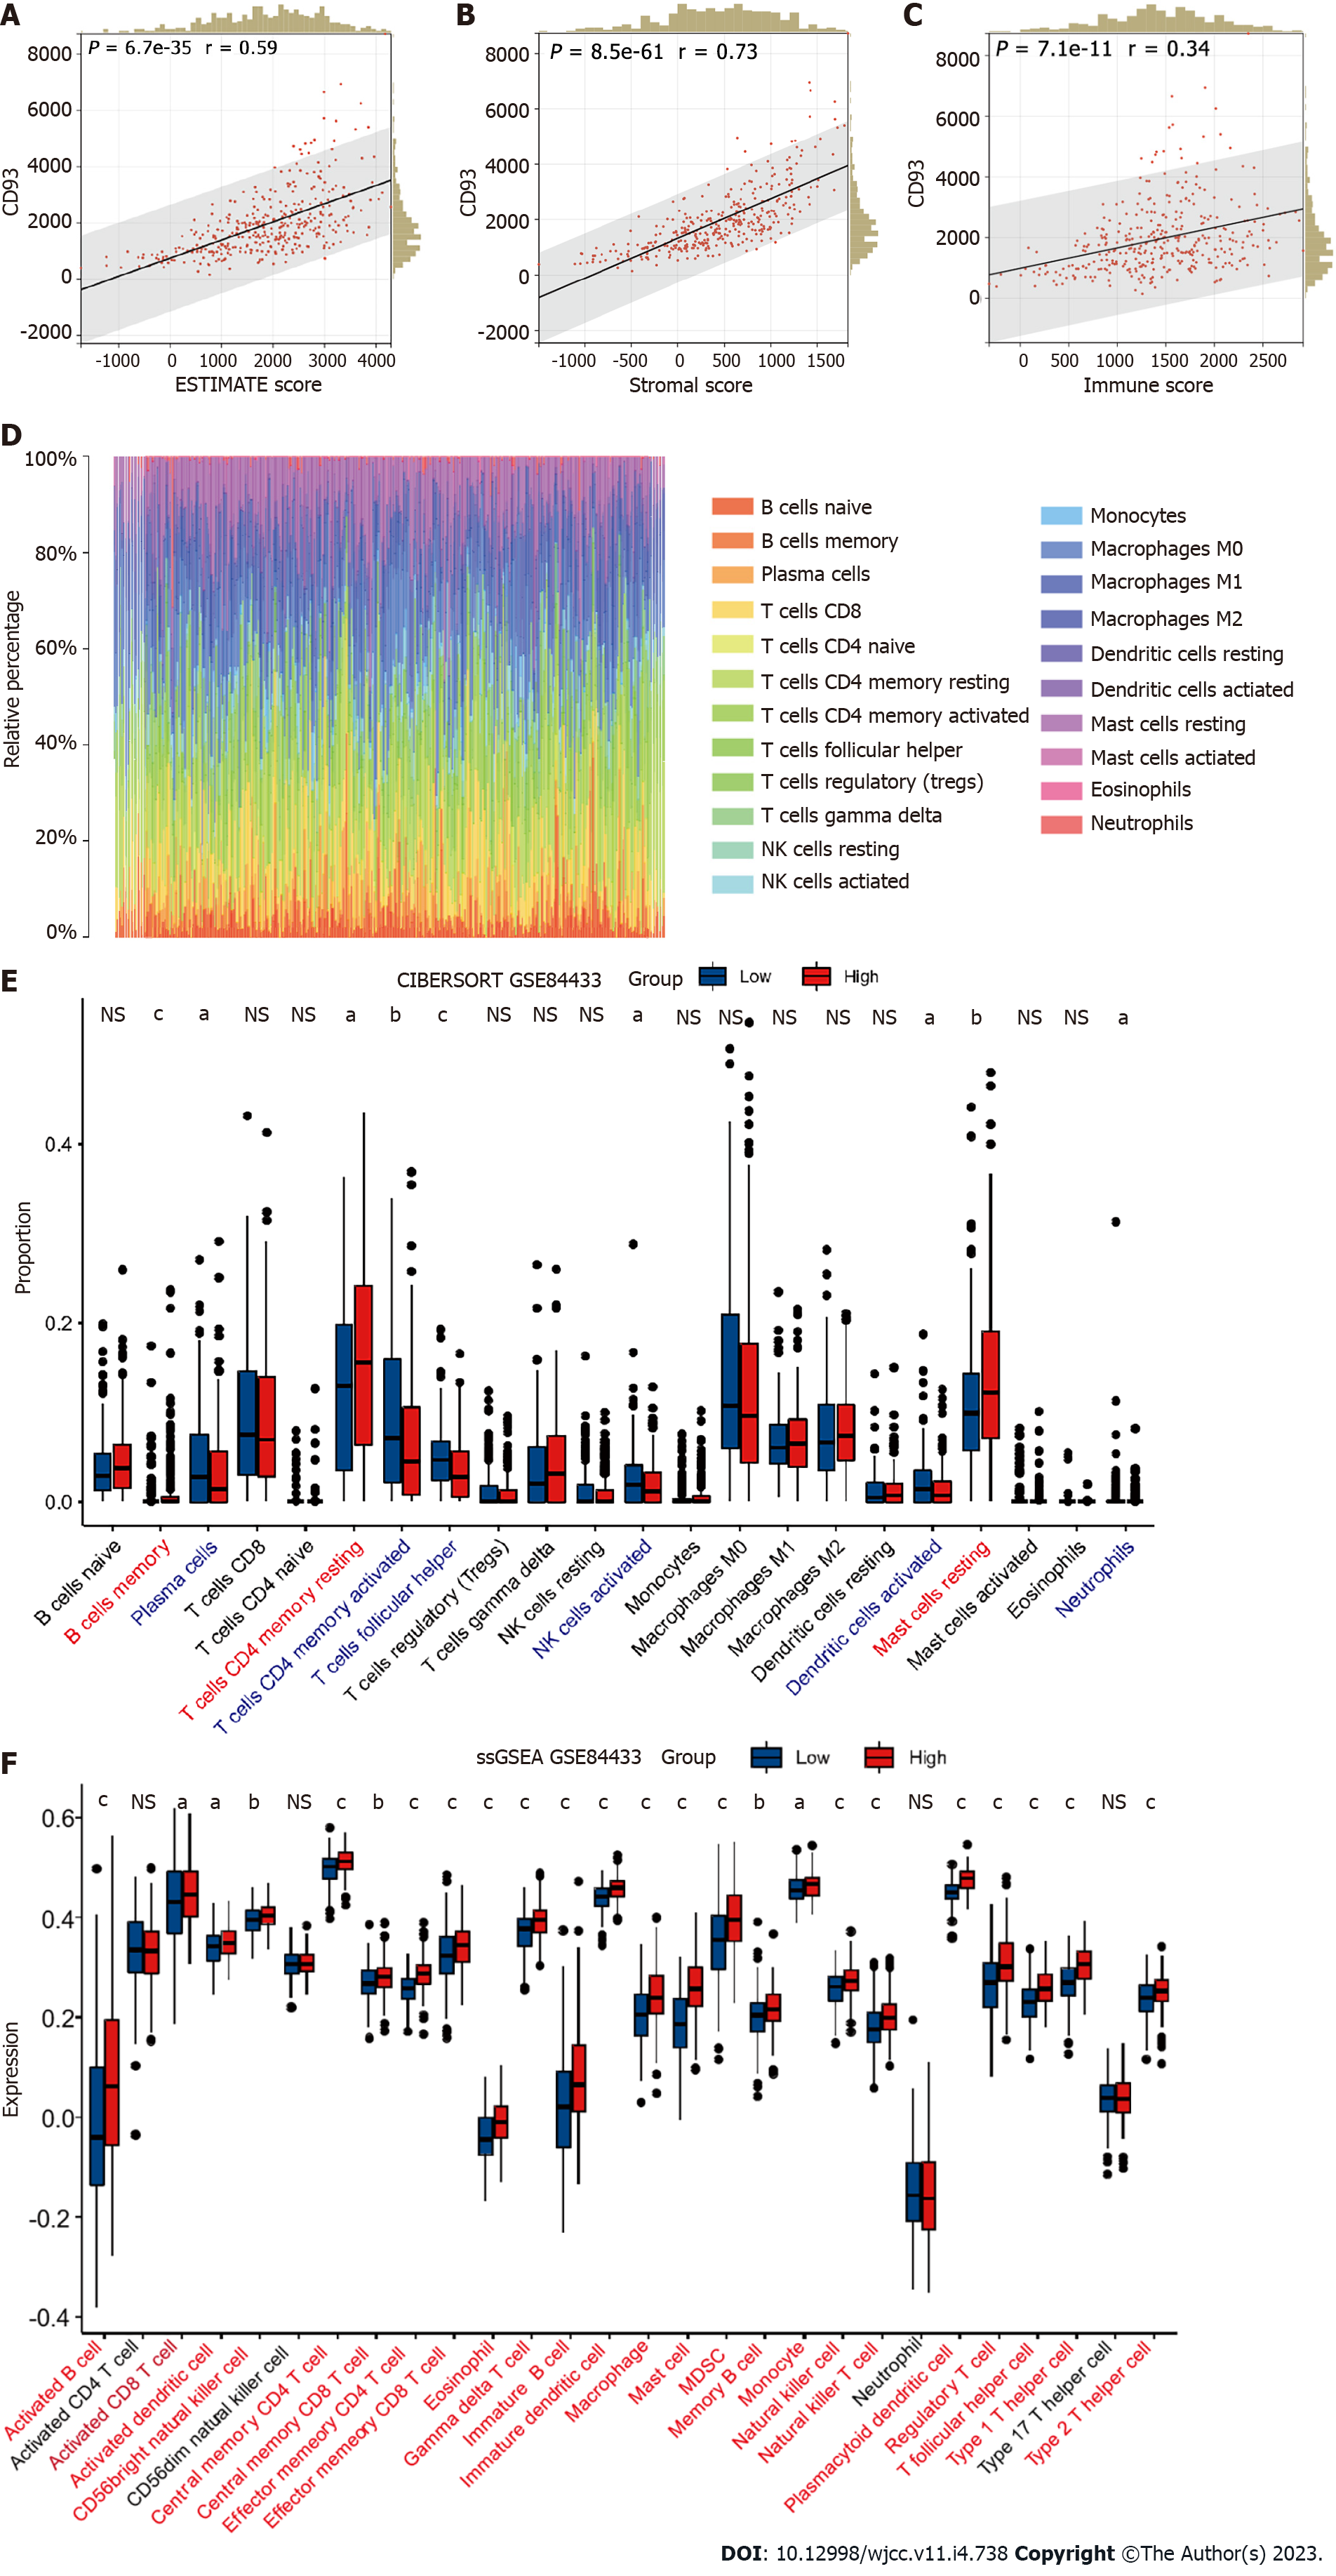
GSE84433 (357 samples) was set as an external independent validation dataset. We performed ESTIMATE, CIBERSORT, and ssGSEA to evaluate the immune-related characteristics of CD93 in TME again. Then, several similar results as before could be obtained. CD93 expression was positively correlated with the ESTIMATE results (Figure 8A-C). CIBERSORT showed the proportion of various immune cell types in each sample (Figure 8D). The proportion of follicular helper T cells and activated NK cells in the high-CD93 expression group was lower compared to that in the low-CD93 expression group (Figure 8E). ssGSEA indicated that 24 immune cell types (including activated B cell, activated CD8 T cell, and activated dendritic cell) expressed significantly higher in the high-CD93 expression group (Figure 8F). Accordingly, CD93 was identified to be closely related to immune infiltration in TME of GC.
In this study, we applied bioinformatics technology to determine the specific role of CD93 in GC. Various analytical methods identified that CD93 is a biomarker for the diagnosis and prognosis of GC. Concerning the potential mechanisms of CD93, enrichment analysis was performed. Consistent with previous studies[11], CD93 was found to be involved in the formation of tumor blood vessels in GC. Such disordered, immature, and impermeable blood vessels can lead to poor tumor blood perfusion. The resulting hypoxic microenvironment can promote the production of more aggressive tumor cells and limit the killing effect of immune cells[31]. In addition to regulating angiogenesis, GO enrichment analysis suggested that CD93 is involved in matrix formation including cell junction, focal adhesion, and regulation of cytokine production, which further demonstrates the important status of CD93 in TME. Also worth noting is that CD93 plays a critical role in the PI3K-Akt signaling pathway. The PI3K-Akt pathway is constantly found to be activated in various cancers and has been considered a promising target for therapy. Multiple activators of this pathway have been proved to possess oncogenic potentials in vivo and in vitro with diverse mechanisms, including stimulation of metabolic reprogramming, proliferation, and so on[32]. These tend to be part of the reasons for the poor prognosis of patients with GC induced by CD93.
As important components of the TME, immune cells can inhibit or promote tumor progression by interacting with tumor cells[33]. The investigation of immune components in TME brings a deeper understanding of the biological characteristics, prognosis, and other information of tumors. Based on ESTIMATE, CIBERSORT, and ssGSEA, a comparison of immune cell infiltration between low and high CD93 expression groups was conducted. According to the result of ESTIMATE, we found that CD93 was significantly proportional to immunity. Previous studies could give reasonable explanations for this result. The blood vessel wall mainly consists of endothelial cells, pericytes, and smooth muscle cells. On the one hand, these cells can activate T cells by expressing MHCI, MHCII, and some costimulatory factors such as CD80, and CD86 to participate in the immune response[34]. On the other hand, a variety of immune cell subsets, including NK cells, T helper 17 cells, regulatory T lymphocytes, and functional subsets of macrophages can act as regulators of arteriogenesis[35]. The crosstalk between the vascular system and immunity explains the high correlation between CD93 and immunity.
From the proportion of immune cell expression, CD8 T cells, Follicular helper T cells, and activated NK cells showed a lower proportion in the high CD93 expression group, while monocytes, resting dendritic cells, and resting mast cells had just the reverse. This is probably caused by local microenvironment hypoxia and accumulation of metabolic end-products induced by abnormal vascular proliferation due to high expression of CD93. CD8 T cells and NK cells are important effector cells involved in anti-tumor immune response in TME and are related to tumor progression and prognosis[36,37]. At present, CD8 T cells have been described as a variety of subtypes, including Tc1, Tc2, Tc9, Tc17, and Tc22, each with different cytotoxicity and effects. Among these cell subtypes, Tc17 and Tc22 are the main T cell subtypes in gastric tissue. Tc17 has no cytotoxicity, and its high expression is negatively correlated with the survival time of GC, while Tc22 is just the opposite. Besides, follicular helper T cells are the key to the production of germinal center formation[38]. They interact with tumor-specific B cells to enhance the anti-tumor effect of CD8 T cells. In summary, the reduced proportion of these important immune cells in the TME may be the main reason for the poor prognosis caused by CD93. However, analysis of the expression of immune cells in two groups suggested that various types of immune cells were highly expressed in the high CD93 expression group. Although blood vessels are conducive to tissue growth and immune response, they can contribute to inflammation and malignant diseases. Abnormal angiogenesis induced by CD93 in TME can promote tumor growth and form an immune-hostile microenvironment[39], and this effect exceeds its immune enhancement effect, which makes the prognosis of the high CD93 expression group with high immune infiltration still poor.
In recent years, the ICIs represented by PD-1, PD-L1, and CTLA-4 bring considerable disease relief to tumor patients, playing an important role in tumor immunotherapy. However, not all patients can benefit from ICIs. A series of studies have shown that TMB is a potential biomarker for predicting the response to ICIs and patients with high TMB possess a better immunotherapeutic effect of ICIs[40,41]. In this study, we made a comparison of gene mutational landscape and TMB between two groups. The results showed that GC patients with high expression of CD93 had a lower TMB, indicating that the effect of immunotherapy in GC patients with high expression of CD93 is poor. Then, we performed WGCNA to identify the key genes related to CD93 in the tumor immune microenvironment of GC. We obtained 11 genes from the yellow module. Among them, SRGN overexpression has been previously shown to promote colorectal cancer metastasis and predict a poor prognosis of hepatocellular carcinoma[42,43]. This time, the identification of these 11 genes can help us further understand the immune microenvironment of GC and suggest potential methods for immunotherapy of GC in the future.
Although we have taken a variety of methods to obtain a comprehensive understanding of the relationship between CD93 and GC, we use 5 cohorts (GSE118916, GSE52138, GSE79973, GSE19826, and GSE84433) as external validation sets, some limitations of this study should be recognized. First, this is a retrospective study. Selection bias, loss of follow-up bias, recall bias, and other biases exist in the study. Thus, a prospective study is required to avoid these biases. Furthermore, limited by TCGA and GEO, we only performed research and analysis from the genetic level. A study that can demonstrate CD93 expression from the protein level or reveal the direct mechanism needs to be conducted in the future.
All in all, comprehensive analyses were applied using transcriptomic profiles and survival information from the GEO and TCGA databases, suggesting that CD93 is a biomarker of diagnosis and prognosis for GC, which closely correlates with immune infiltration in TME. These data help us further comprehend the role of CD93 in the immune microenvironment and may suggest potential strategies for immunotherapy of GC in the future.
Gastric cancer (GC) is a common malignancy with poor 5-year survival rate. Tumor microenvironment (TME) containing intricate interaction between immune and non-immune cells produces significant impact of the survival of GC. Additionally, CD93 was proved to be associated with abnormal angiogenesis, which could be involved in TME of GC.
This study was conducted to determine the specific role of CD93 in GC in order to provide insights for the discovery of novel therapeutic target of GC in the feature.
Cohorts data of GC patients was investigated from The Cancer Genome Atlas and Gene Expression Omnibus (GSE118916, GSE52138, GSE79973, GSE19826, and GSE84433).
We performed a series of immune infiltration analyses using ESTIMATE, CIBERSORT, and ssGSEA. Furthermore, weighted gene co-expression network analysis was conducted to identify the immune-related genes.
CD93 significantly enriched in tumor tissues. Additionally, higher expression of CD93 was significantly associated with shorter overall survival, less proportion of CD8 T and activated nature killer cells in the TME, and lower tumor mutational burden.
CD93 is a novel prognostic and diagnostic biomarker for GC, which is closely related to the immune infiltration in TME.
CD93 can serve as a potential therapeutic target for the immunotherapy of GC in the feature.
Provenance and peer review: Unsolicited article; Externally peer reviewed.
Peer-review model: Single blind
Specialty type: Gastroenterology and hepatology
Country/Territory of origin: China
Peer-review report’s scientific quality classification
Grade A (Excellent): A
Grade B (Very good): B
Grade C (Good): 0
Grade D (Fair): 0
Grade E (Poor): 0
P-Reviewer: Dilek ON, Turkey; Koganti SB, United States S-Editor: Zhang H L-Editor: A P-Editor: Zhang H
| 1. | Sung H, Ferlay J, Siegel RL, Laversanne M, Soerjomataram I, Jemal A, Bray F. Global Cancer Statistics 2020: GLOBOCAN Estimates of Incidence and Mortality Worldwide for 36 Cancers in 185 Countries. CA Cancer J Clin. 2021;71:209-249. [RCA] [PubMed] [DOI] [Full Text] [Cited by in Crossref: 75126] [Cited by in RCA: 64702] [Article Influence: 16175.5] [Reference Citation Analysis (177)] |
| 2. | Smyth EC, Nilsson M, Grabsch HI, van Grieken NC, Lordick F. Gastric cancer. Lancet. 2020;396:635-648. [RCA] [PubMed] [DOI] [Full Text] [Cited by in Crossref: 1150] [Cited by in RCA: 2863] [Article Influence: 572.6] [Reference Citation Analysis (5)] |
| 3. | Zhao Q, Cao L, Guan L, Bie L, Wang S, Xie B, Chen X, Shen X, Cao F. Immunotherapy for gastric cancer: dilemmas and prospect. Brief Funct Genomics. 2019;18:107-112. [RCA] [PubMed] [DOI] [Full Text] [Cited by in Crossref: 36] [Cited by in RCA: 105] [Article Influence: 15.0] [Reference Citation Analysis (0)] |
| 4. | Rojas A, Araya P, Gonzalez I, Morales E. Gastric Tumor Microenvironment. Adv Exp Med Biol. 2020;1226:23-35. [RCA] [PubMed] [DOI] [Full Text] [Cited by in Crossref: 38] [Cited by in RCA: 55] [Article Influence: 11.0] [Reference Citation Analysis (0)] |
| 5. | Kim J, Hong J, Lee J, Fakhraei Lahiji S, Kim YH. Recent advances in tumor microenvironment-targeted nanomedicine delivery approaches to overcome limitations of immune checkpoint blockade-based immunotherapy. J Control Release. 2021;332:109-126. [RCA] [PubMed] [DOI] [Full Text] [Cited by in Crossref: 13] [Cited by in RCA: 40] [Article Influence: 10.0] [Reference Citation Analysis (0)] |
| 6. | Xiao Y, Yu D. Tumor microenvironment as a therapeutic target in cancer. Pharmacol Ther. 2021;221:107753. [RCA] [PubMed] [DOI] [Full Text] [Cited by in Crossref: 67] [Cited by in RCA: 1136] [Article Influence: 227.2] [Reference Citation Analysis (2)] |
| 7. | Lei Q, Wang D, Sun K, Wang L, Zhang Y. Resistance Mechanisms of Anti-PD1/PDL1 Therapy in Solid Tumors. Front Cell Dev Biol. 2020;8:672. [RCA] [PubMed] [DOI] [Full Text] [Full Text (PDF)] [Cited by in Crossref: 293] [Cited by in RCA: 278] [Article Influence: 55.6] [Reference Citation Analysis (0)] |
| 8. | Lugano R, Vemuri K, Yu D, Bergqvist M, Smits A, Essand M, Johansson S, Dejana E, Dimberg A. CD93 promotes β1 integrin activation and fibronectin fibrillogenesis during tumor angiogenesis. J Clin Invest. 2018;128:3280-3297. [RCA] [PubMed] [DOI] [Full Text] [Full Text (PDF)] [Cited by in Crossref: 57] [Cited by in RCA: 102] [Article Influence: 14.6] [Reference Citation Analysis (0)] |
| 9. | Huang J, Lee HY, Zhao X, Han J, Su Y, Sun Q, Shao J, Ge J, Zhao Y, Bai X, He Y, Wang X, Dong C. Interleukin-17D regulates group 3 innate lymphoid cell function through its receptor CD93. Immunity. 2021;54:673-686.e4. [RCA] [PubMed] [DOI] [Full Text] [Cited by in Crossref: 44] [Cited by in RCA: 71] [Article Influence: 17.8] [Reference Citation Analysis (0)] |
| 10. | Nativel B, Ramin-Mangata S, Mevizou R, Figuester A, Andries J, Iwema T, Ikewaki N, Gasque P, Viranaïcken W. CD93 is a cell surface lectin receptor involved in the control of the inflammatory response stimulated by exogenous DNA. Immunology. 2019;158:85-93. [RCA] [PubMed] [DOI] [Full Text] [Cited by in Crossref: 10] [Cited by in RCA: 26] [Article Influence: 4.3] [Reference Citation Analysis (0)] |
| 11. | Sun Y, Chen W, Torphy RJ, Yao S, Zhu G, Lin R, Lugano R, Miller EN, Fujiwara Y, Bian L, Zheng L, Anand S, Gao F, Zhang W, Ferrara SE, Goodspeed AE, Dimberg A, Wang XJ, Edil BH, Barnett CC, Schulick RD, Chen L, Zhu Y. Blockade of the CD93 pathway normalizes tumor vasculature to facilitate drug delivery and immunotherapy. Sci Transl Med. 2021;13. [RCA] [PubMed] [DOI] [Full Text] [Cited by in Crossref: 43] [Cited by in RCA: 94] [Article Influence: 23.5] [Reference Citation Analysis (0)] |
| 12. | Goldman MJ, Craft B, Hastie M, Repečka K, McDade F, Kamath A, Banerjee A, Luo Y, Rogers D, Brooks AN, Zhu J, Haussler D. Visualizing and interpreting cancer genomics data via the Xena platform. Nat Biotechnol. 2020;38:675-678. [RCA] [PubMed] [DOI] [Full Text] [Cited by in Crossref: 2228] [Cited by in RCA: 2581] [Article Influence: 516.2] [Reference Citation Analysis (0)] |
| 13. | Love MI, Huber W, Anders S. Moderated estimation of fold change and dispersion for RNA-seq data with DESeq2. Genome Biol. 2014;15:550. [RCA] [PubMed] [DOI] [Full Text] [Full Text (PDF)] [Cited by in Crossref: 34752] [Cited by in RCA: 57669] [Article Influence: 5766.9] [Reference Citation Analysis (0)] |
| 14. | Barrett T, Wilhite SE, Ledoux P, Evangelista C, Kim IF, Tomashevsky M, Marshall KA, Phillippy KH, Sherman PM, Holko M, Yefanov A, Lee H, Zhang N, Robertson CL, Serova N, Davis S, Soboleva A. NCBI GEO: archive for functional genomics data sets--update. Nucleic Acids Res. 2013;41:D991-D995. [RCA] [PubMed] [DOI] [Full Text] [Full Text (PDF)] [Cited by in Crossref: 4527] [Cited by in RCA: 6787] [Article Influence: 522.1] [Reference Citation Analysis (0)] |
| 15. | Mayakonda A, Lin DC, Assenov Y, Plass C, Koeffler HP. Maftools: efficient and comprehensive analysis of somatic variants in cancer. Genome Res. 2018;28:1747-1756. [RCA] [PubMed] [DOI] [Full Text] [Full Text (PDF)] [Cited by in Crossref: 1228] [Cited by in RCA: 3115] [Article Influence: 445.0] [Reference Citation Analysis (0)] |
| 16. | Gu Z, Eils R, Schlesner M. Complex heatmaps reveal patterns and correlations in multidimensional genomic data. Bioinformatics. 2016;32:2847-2849. [RCA] [PubMed] [DOI] [Full Text] [Cited by in Crossref: 3200] [Cited by in RCA: 5884] [Article Influence: 653.8] [Reference Citation Analysis (0)] |
| 17. | Li T, Fu J, Zeng Z, Cohen D, Li J, Chen Q, Li B, Liu XS. TIMER2.0 for analysis of tumor-infiltrating immune cells. Nucleic Acids Res. 2020;48:W509-W514. [RCA] [PubMed] [DOI] [Full Text] [Full Text (PDF)] [Cited by in Crossref: 2451] [Cited by in RCA: 3368] [Article Influence: 673.6] [Reference Citation Analysis (0)] |
| 18. | Ru B, Wong CN, Tong Y, Zhong JY, Zhong SSW, Wu WC, Chu KC, Wong CY, Lau CY, Chen I, Chan NW, Zhang J. TISIDB: an integrated repository portal for tumor-immune system interactions. Bioinformatics. 2019;35:4200-4202. [RCA] [PubMed] [DOI] [Full Text] [Cited by in Crossref: 561] [Cited by in RCA: 1437] [Article Influence: 287.4] [Reference Citation Analysis (0)] |
| 19. | Robin X, Turck N, Hainard A, Tiberti N, Lisacek F, Sanchez JC, Müller M. pROC: an open-source package for R and S+ to analyze and compare ROC curves. BMC Bioinformatics. 2011;12:77. [RCA] [PubMed] [DOI] [Full Text] [Full Text (PDF)] [Cited by in Crossref: 6456] [Cited by in RCA: 8426] [Article Influence: 601.9] [Reference Citation Analysis (0)] |
| 20. | Asplund A, Edqvist PH, Schwenk JM, Pontén F. Antibodies for profiling the human proteome-The Human Protein Atlas as a resource for cancer research. Proteomics. 2012;12:2067-2077. [RCA] [PubMed] [DOI] [Full Text] [Cited by in Crossref: 126] [Cited by in RCA: 209] [Article Influence: 16.1] [Reference Citation Analysis (0)] |
| 21. | Vasaikar SV, Straub P, Wang J, Zhang B. LinkedOmics: analyzing multi-omics data within and across 32 cancer types. Nucleic Acids Res. 2018;46:D956-D963. [RCA] [PubMed] [DOI] [Full Text] [Full Text (PDF)] [Cited by in Crossref: 808] [Cited by in RCA: 1537] [Article Influence: 256.2] [Reference Citation Analysis (0)] |
| 22. | Warde-Farley D, Donaldson SL, Comes O, Zuberi K, Badrawi R, Chao P, Franz M, Grouios C, Kazi F, Lopes CT, Maitland A, Mostafavi S, Montojo J, Shao Q, Wright G, Bader GD, Morris Q. The GeneMANIA prediction server: biological network integration for gene prioritization and predicting gene function. Nucleic Acids Res. 2010;38:W214-W220. [RCA] [PubMed] [DOI] [Full Text] [Full Text (PDF)] [Cited by in Crossref: 2336] [Cited by in RCA: 3263] [Article Influence: 217.5] [Reference Citation Analysis (0)] |
| 23. | Yu G, Wang LG, Han Y, He QY. clusterProfiler: an R package for comparing biological themes among gene clusters. OMICS. 2012;16:284-287. [RCA] [PubMed] [DOI] [Full Text] [Cited by in Crossref: 11591] [Cited by in RCA: 22263] [Article Influence: 1712.5] [Reference Citation Analysis (0)] |
| 24. | Li T, Fan J, Wang B, Traugh N, Chen Q, Liu JS, Li B, Liu XS. TIMER: A Web Server for Comprehensive Analysis of Tumor-Infiltrating Immune Cells. Cancer Res. 2017;77:e108-e110. [RCA] [PubMed] [DOI] [Full Text] [Cited by in Crossref: 2728] [Cited by in RCA: 4093] [Article Influence: 511.6] [Reference Citation Analysis (0)] |
| 25. | Yoshihara K, Shahmoradgoli M, Martínez E, Vegesna R, Kim H, Torres-Garcia W, Treviño V, Shen H, Laird PW, Levine DA, Carter SL, Getz G, Stemke-Hale K, Mills GB, Verhaak RG. Inferring tumour purity and stromal and immune cell admixture from expression data. Nat Commun. 2013;4:2612. [RCA] [PubMed] [DOI] [Full Text] [Full Text (PDF)] [Cited by in Crossref: 3056] [Cited by in RCA: 6454] [Article Influence: 586.7] [Reference Citation Analysis (0)] |
| 26. | Newman AM, Liu CL, Green MR, Gentles AJ, Feng W, Xu Y, Hoang CD, Diehn M, Alizadeh AA. Robust enumeration of cell subsets from tissue expression profiles. Nat Methods. 2015;12:453-457. [RCA] [PubMed] [DOI] [Full Text] [Full Text (PDF)] [Cited by in Crossref: 4763] [Cited by in RCA: 8922] [Article Influence: 892.2] [Reference Citation Analysis (0)] |
| 27. | Bindea G, Mlecnik B, Tosolini M, Kirilovsky A, Waldner M, Obenauf AC, Angell H, Fredriksen T, Lafontaine L, Berger A, Bruneval P, Fridman WH, Becker C, Pagès F, Speicher MR, Trajanoski Z, Galon J. Spatiotemporal dynamics of intratumoral immune cells reveal the immune landscape in human cancer. Immunity. 2013;39:782-795. [RCA] [PubMed] [DOI] [Full Text] [Cited by in Crossref: 1792] [Cited by in RCA: 2957] [Article Influence: 246.4] [Reference Citation Analysis (0)] |
| 28. | Hänzelmann S, Castelo R, Guinney J. GSVA: gene set variation analysis for microarray and RNA-seq data. BMC Bioinformatics. 2013;14:7. [RCA] [PubMed] [DOI] [Full Text] [Full Text (PDF)] [Cited by in Crossref: 7222] [Cited by in RCA: 9296] [Article Influence: 774.7] [Reference Citation Analysis (0)] |
| 29. | Langfelder P, Horvath S. WGCNA: an R package for weighted correlation network analysis. BMC Bioinformatics. 2008;9:559. [RCA] [PubMed] [DOI] [Full Text] [Full Text (PDF)] [Cited by in Crossref: 10254] [Cited by in RCA: 16475] [Article Influence: 969.1] [Reference Citation Analysis (0)] |
| 30. | Szklarczyk D, Gable AL, Nastou KC, Lyon D, Kirsch R, Pyysalo S, Doncheva NT, Legeay M, Fang T, Bork P, Jensen LJ, von Mering C. The STRING database in 2021: customizable protein-protein networks, and functional characterization of user-uploaded gene/measurement sets. Nucleic Acids Res. 2021;49:D605-D612. [RCA] [PubMed] [DOI] [Full Text] [Full Text (PDF)] [Cited by in Crossref: 1211] [Cited by in RCA: 4828] [Article Influence: 1207.0] [Reference Citation Analysis (0)] |
| 31. | Viallard C, Larrivée B. Tumor angiogenesis and vascular normalization: alternative therapeutic targets. Angiogenesis. 2017;20:409-426. [RCA] [PubMed] [DOI] [Full Text] [Cited by in Crossref: 561] [Cited by in RCA: 1016] [Article Influence: 127.0] [Reference Citation Analysis (0)] |
| 32. | Aoki M, Fujishita T. Oncogenic Roles of the PI3K/AKT/mTOR Axis. Curr Top Microbiol Immunol. 2017;407:153-189. [RCA] [PubMed] [DOI] [Full Text] [Cited by in Crossref: 73] [Cited by in RCA: 163] [Article Influence: 27.2] [Reference Citation Analysis (0)] |
| 33. | Choi KY, Kim JH, Park IS, Rho YS, Kwon GH, Lee DJ. Predictive gene signatures of nodal metastasis in papillary thyroid carcinoma. Cancer Biomark. 2018;22:35-42. [RCA] [PubMed] [DOI] [Full Text] [Cited by in Crossref: 7] [Cited by in RCA: 7] [Article Influence: 1.0] [Reference Citation Analysis (0)] |
| 34. | Pober JS, Tellides G. Participation of blood vessel cells in human adaptive immune responses. Trends Immunol. 2012;33:49-57. [RCA] [PubMed] [DOI] [Full Text] [Cited by in Crossref: 102] [Cited by in RCA: 117] [Article Influence: 8.4] [Reference Citation Analysis (0)] |
| 35. | la Sala A, Pontecorvo L, Agresta A, Rosano G, Stabile E. Regulation of collateral blood vessel development by the innate and adaptive immune system. Trends Mol Med. 2012;18:494-501. [RCA] [PubMed] [DOI] [Full Text] [Cited by in Crossref: 39] [Cited by in RCA: 65] [Article Influence: 5.0] [Reference Citation Analysis (0)] |
| 36. | Terrén I, Orrantia A, Vitallé J, Zenarruzabeitia O, Borrego F. NK Cell Metabolism and Tumor Microenvironment. Front Immunol. 2019;10:2278. [RCA] [PubMed] [DOI] [Full Text] [Full Text (PDF)] [Cited by in Crossref: 126] [Cited by in RCA: 340] [Article Influence: 56.7] [Reference Citation Analysis (0)] |
| 37. | St Paul M, Ohashi PS. The Roles of CD8(+) T Cell Subsets in Antitumor Immunity. Trends Cell Biol. 2020;30:695-704. [RCA] [PubMed] [DOI] [Full Text] [Cited by in Crossref: 84] [Cited by in RCA: 383] [Article Influence: 76.6] [Reference Citation Analysis (0)] |
| 38. | Cui C, Wang J, Fagerberg E, Chen PM, Connolly KA, Damo M, Cheung JF, Mao T, Askari AS, Chen S, Fitzgerald B, Foster GG, Eisenbarth SC, Zhao H, Craft J, Joshi NS. Neoantigen-driven B cell and CD4 T follicular helper cell collaboration promotes anti-tumor CD8 T cell responses. Cell. 2021;184:6101-6118.e13. [RCA] [PubMed] [DOI] [Full Text] [Full Text (PDF)] [Cited by in Crossref: 334] [Cited by in RCA: 293] [Article Influence: 73.3] [Reference Citation Analysis (0)] |
| 39. | Lamplugh Z, Fan Y. Vascular Microenvironment, Tumor Immunity and Immunotherapy. Front Immunol. 2021;12:811485. [RCA] [PubMed] [DOI] [Full Text] [Full Text (PDF)] [Cited by in Crossref: 44] [Cited by in RCA: 59] [Article Influence: 14.8] [Reference Citation Analysis (0)] |
| 40. | Chan TA, Yarchoan M, Jaffee E, Swanton C, Quezada SA, Stenzinger A, Peters S. Development of tumor mutation burden as an immunotherapy biomarker: utility for the oncology clinic. Ann Oncol. 2019;30:44-56. [RCA] [PubMed] [DOI] [Full Text] [Full Text (PDF)] [Cited by in Crossref: 1568] [Cited by in RCA: 1879] [Article Influence: 313.2] [Reference Citation Analysis (0)] |
| 41. | Cristescu R, Mogg R, Ayers M, Albright A, Murphy E, Yearley J, Sher X, Liu XQ, Lu H, Nebozhyn M, Zhang C, Lunceford JK, Joe A, Cheng J, Webber AL, Ibrahim N, Plimack ER, Ott PA, Seiwert TY, Ribas A, McClanahan TK, Tomassini JE, Loboda A, Kaufman D. Pan-tumor genomic biomarkers for PD-1 checkpoint blockade-based immunotherapy. Science. 2018;362. [RCA] [PubMed] [DOI] [Full Text] [Cited by in Crossref: 1035] [Cited by in RCA: 1652] [Article Influence: 236.0] [Reference Citation Analysis (0)] |
| 42. | He L, Zhou X, Qu C, Tang Y, Zhang Q, Hong J. Serglycin (SRGN) overexpression predicts poor prognosis in hepatocellular carcinoma patients. Med Oncol. 2013;30:707. [RCA] [PubMed] [DOI] [Full Text] [Cited by in Crossref: 37] [Cited by in RCA: 40] [Article Influence: 3.3] [Reference Citation Analysis (0)] |
| 43. | Xu Y, Xu J, Yang Y, Zhu L, Li X, Zhao W. SRGN Promotes Colorectal Cancer Metastasis as a Critical Downstream Target of HIF-1α. Cell Physiol Biochem. 2018;48:2429-2440. [RCA] [PubMed] [DOI] [Full Text] [Cited by in Crossref: 26] [Cited by in RCA: 32] [Article Influence: 4.6] [Reference Citation Analysis (0)] |


