Published online Jan 26, 2023. doi: 10.12998/wjcc.v11.i3.576
Peer-review started: October 19, 2022
First decision: November 25, 2022
Revised: December 3, 2022
Accepted: January 5, 2023
Article in press: January 5, 2023
Published online: January 26, 2023
Processing time: 99 Days and 0.8 Hours
Patients with severe aplastic anemia (SAA) frequently present with inflammatory episodes, and during flared inflammatory episodes, hematopoietic function is further exacerbated. The gastrointestinal tract is the most common site for infectious and inflammatory diseases, and its structural and functional features confer on it the most potent capacity to affect hematopoietic and immune functions. Computed tomography (CT) is a readily accessible approach to provide highly useful information in detecting morphological changes and guiding further work-ups.
To explore CT imaging presentations of gut inflammatory damage in adult SAA patients during inflammatory episodes.
We retrospectively evaluated the abdominal CT imaging presentations of 17 hospitalized adult patients with SAA in search of the inflammatory niche when they presented with systemic inflammatory stress and exacerbated hematopoietic function. In this descriptive manuscript, the characteristic images that suggested the presence of gastrointestinal inflammatory damage and related imaging presentations of individual patients were enumerated, analyzed and described.
All eligible patients with SAA had CT imaging abnormalities that suggested the presence of an impaired intestinal barrier and increased epithelial permeability. The inflammatory damages were concurrently present in the small intestine, the ileocecal region and the large intestines. Some readily identified imaging signs, such as bowel wall thickening with mural stratification (“water holo sign”, “fat holo sign”, intramural gas and subserosal pneumatosis) and mesenteric fat proliferation (fat stranding and “creeping fat sign”), fibrotic bowel wall thickening, “balloon sign”, rugged colonic configuration, heterogeneity in the bowel wall texture, and adhered and clustered small bowel loop (including various patterns of “abdominal cocoon”), occurred at a high incidence, which suggested that the damaged gastrointestinal tract is a common inflammatory niche responsible for the systemic inflammatory stresses and the exacerbated hematopoietic failure in patients with SAA. Particularly, the “fat holo sign” was present in 7 patients, a rugged colonic configuration was present in 10 patients, the adhesive bowel loop was present in 15 patients, and extraintestinal manifestations suggestive of tuberculosis infections were present in 5 patients. According to the imaging features, a suggestive diagnosis of Crohn’s disease was made in 5 patients, ulcerative colitis in 1 patient, chronic periappendiceal abscess in 1 patient, and tuberculosis infection in 5 patients. Other patients were diagnosed with chronic enteroclolitis with acutely aggravated inflammatory damage.
Patients with SAA had CT imaging patterns that suggested the presence of active chronic inflammatory conditions and aggravated inflammatory damage during flared inflammatory episodes.
Core Tip: Patients with severe aplastic anemia frequently present with inflammatory episodes. The gastrointestinal tract is the most common site for infectious and inflammatory diseases, and its structural and functional features confer on it the most potent capacity to affect hematopoietic and immune functions. We retrospectively reviewed the bowel morphological changes on computed tomography in seventeen patients with severe aplastic anemia during flared inflammatory episodes. All patients demonstrated imaging abnormalities that suggested the presence of active chronic inflammatory conditions and aggravated inflammatory damage in the gastrointestinal tract. These inflammatory conditions likely contributed to their systemic inflammatory stresses and exacerbated hematopoietic failure.
- Citation: Zhao XC, Xue CJ, Song H, Gao BH, Han FS, Xiao SX. Bowel inflammatory presentations on computed tomography in adult patients with severe aplastic anemia during flared inflammatory episodes. World J Clin Cases 2023; 11(3): 576-597
- URL: https://www.wjgnet.com/2307-8960/full/v11/i3/576.htm
- DOI: https://dx.doi.org/10.12998/wjcc.v11.i3.576
Aplastic anemia (AA) is the paradigm of hematopioetic failure resulting from the immune-mediated destruction of hematopoietic progenitor cells, leading to heavily suppressed blood cell productivity and peripheral cytopenia. In patients with severe AA (SAA), fulminant infections, frequently in the absence of localized symptoms and signs, and refractory to broad-spectrum antibiotics, are the most common complications and the main causes of death. Infections in SAA are usually attributed to severely impaired granulopoiesis, and it frequently has a poor response to recombinant human granulocyte colony-stimulating factor (rhG-CSF) treatment[1-3]. However, successful treatment of the underlying infections can significantly improve the hematological profile and even achieve a complete hematological remission in some patients, providing strong evidence that aggravated inflammatory reactions are responsible, at least in a fraction of patients, for the exacerbated hematopoietic suppression[4-6]. Very recently, initiation and perpetuation of AA pathogenesis has been found to be associated with gut inflammatory disorders (GIDs)[7,8]. However, the role of GIDs in AA pathogenesis is overlooked likely due to the high prevalence and good tolerance of GIDs and the low incidence of AA.
The gastrointestinal tract hosts the most enriched and complex microbial community in the human body. Not only pathogenic microbes but also dysbiotic commensal bacteria and various chemical components can compromise the intestinal barrier[9,10]. In the setting of impaired intestinal barrier structure and function, antigens from commensal microbes and undigested food as a source of continuous antigen supply can translocate to the lamina propria, blood, and remote organs and come into intimate contact with host immune cells, thereby initiating and perpetuating autoimmunity[11,12] and amplifying aberrant immune responses[13]. The gastrointestinal tract also hosts the most enriched lymphoid tissues and hence can provide sufficient activated immune cells to sustain exaggerated immune responses. Because the body is constantly confronted with various harmful environmental factors, the gastrointestinal tract is the most common site for infectious and inflammatory diseases[9,10].
Active GIDs, whether as a consequence or as an incentive factor in the process of gut dysbiosis and epithelial damage, can lead to morphological manifestations that can be detected by various imaging modalities. The imaging presentations are usually nonspecific, and arriving at an etiopathological diagnosis usually necessitates the comprehensive analysis of data from clinical, endoscopic, pathological and laboratory investigations, and is frequently dependent on the results of specific laboratory tests and the responses to specific treatments. However, computed tomography (CT) is a readily accessible approach able to provide highly useful information not only in detecting the distribution, extent, degree, and patterns of the gastrointestinal lesions and the adjacent inflammatory changes that prompt a radiological diagnosis but also in guiding further work-ups for pathognomonic diagnosis, identifying complications, evaluating treatment responses and monitoring disease activities in the subsequent follow-ups[14-16]. In this study, we explored the CT imaging manifestations of the gastrointestinal tract in adult patients with SAA during flared inflammatory episodes and showed that all patients had imaging abnormalities suggesting the presence of active chronic gut inflammatory conditions and acutely aggravated inflammatory damages.
In this retrospective study, we reviewed the abdominal CT images in 17 hospitalized adult SAA patients who were treated at our center from October 2019 to March 2022, including 8 males and 9 females, with a median age of 55 years (ranging from 34 to 78 years). They were hospitalized due to rapidly exacerbated cytopenia, aggravated fatigue, varying degrees of febrile episodes and elevated inflammatory indices, indicating the presence of systemic inflammatory responses[1-3]. Each patient was definitively diagnosed with SAA for more than 2 years, and the SAA progressed from non-SAA (NSAA) after the patients experienced various accelerating episodes. In addition to supportive care, they were routinely treated with cyclosporine (3-4 mg/kg/d), stanozolol (6-8 mg/d) and eltrombopag (50 mg/d) in the SAA stage, in the absence of any therapeutic responses. In the patients with very SAA (VSAA), recombinant human granulocyte colony-stimulating factor (rhG-CSF, 100-200 μg/d) was added, without an evident increase in granulocytes. Patients who had diseases of portal hypertension, hepatic disease, pancreatic disease, cardiopulmonary disease, heart failure, severe hypoalbuminemia and ischemic enteropathy were excluded, because these diseases can cause stratified bowel wall thickening by blood congestion in the gastrointestinal tract, which may confound the imaging presentations of inflammatory lesions[16-18]. Abdominal CT was performed to search for the inflammatory niche before antibiotic and other treatments.
The modified Camitta criteria were used to assess severity of AA[3]: The diagnostic criteria for SAA were absolute neutrophil count (ANC) < 0.5 × 10⁹/L, platelets (Plts) < 20 × 109/L, and absolute reticulocyte count (Ret) < 20 × 109/L. The diagnostic criteria for VSAA were ANC < 0.2 × 10⁹/L in addition to the above hematological presentations.
CT imaging modalities: Conventional CT was performed for all patients in the search of the inflammatory niche during flared inflammatory episodes. If the conventional CT was sufficient to determine the radiological changes, contrast-enhanced CT was waived in order to reduce the radiation exposure. If the conventional CT was unable to determine the imaging abnormalities due to the difficulty in the discrimination of a massive lesion from contents in the intestinal lumen or due to the suspicion of a massive lesion being malignant, contrast-enhanced CT was performed. Meanwhile, endoscopic examination of the large intestine and ileocecal region was performed. Contrast-enhanced CT was performed in 1 patient in this study. Multiplanar reconstruction was performed for the assessment and expression of the radiological manifestations.
CT image reviewing process: Each patient’s CT images were reviewed, and the imaging abnormalities were collected independently by each of the six authors: Xi-Chen Zhao, Cheng-Jiang Xue, Hui Song, Bin-Han Gao, Fu-Sen Han, and Shu-Xin Xiao. After several rounds of extensive consultation, the imaging abnormalities suggesting the presence of GIDs were decided by the first and corresponding author. In patients with evident chest CT presentations that likely had pathogenic relationships with the bowel inflammatory damages; those chest CT abnormalities were also enumerated and described.
Radiological manifestations suggesting the gut involvement of inflammatory disorders: After careful assessment of the radiographs and after extensive consultations within our research group with reference to the patients’ symptoms and signs, the following imaging presentations were considered to have abnormalities suggestive of the presence of GIDs.
First, the criteria for the diagnosis of bowel wall thickening met one of the following criteria[17-21]: (1) Bowel wall thickness greater than 3 mm in adequately distended intestinal segments; (2) bowel wall thickness greater than 4 mm in underdistended intestinal segments; (3) cross-sectional diameter greater than 6 mm in collapsed small intestines; and (4) cross-sectional diameter greater than 5 mm in collapsed large intestines.
The bowel wall thickening may be focal or segmental, symmetrical or asymmetrical, concentric or eccentric, homogeneous or heterogeneous. The following signs were helpful in the identification of the location and extent of the diseased bowel segments: (1) Mesenteric inflammatory changes indicative of transmural inflammation: “fat stranding”[22,23], “creeping fat sign”[24-26] and “comb sign”[27,28]; (2) mural stratification indicative of edematous bowel wall (water holo sign) and submucosal fat deposition (fat holo sign)[17-21]; (3) intramural gas and/or subserosal pneumatosis indicative of aerogenous bacterial proliferation in the bowel wall[14-16]; (4) gas-liquid levels in the intestinal lumen indicative of intestinal dynamical abnormalities; (5) heterogeneity in the bowel wall texture especially with segmentally gas-filled and segmentally liquid-filled intestinal lumen; (6) inflamed diverticulitis; (7) epiplioic appendagitis; (8)“empty colon sign” or narrowed bowel lumen[15,16]; (9) adhesive bowel loop, especially with mesenteric inflammatory changes and/or adjacent peritoneal fibrotic thickening (“abdominal cocoon”)[29-32]; and (10) rugged colonic configuration, especially with mesenteric inflammatory changes and/or adjacent peritoneal fibrotic thickening.
Second, the “balloon sign” refers to a segment of a paper-thin bowel wall (a highly dilated and thinned bowel segment filled with gas) wrapped by a large cluster of circumferentially distributed hypervascular mesenteric fat stranding[33-36]. The hypervascular mesenteric fat deposition suggests the presence of active chronic transmural inflammatory damage in the diseased intestinal segments[22-26].
Third, peritoneal involvement: Including peritoneal thickening, ascites particularly loculated ascites and peritoneal nodularity.
In the evaluation of bowel inflammatory damage, particular attention was given to imaging abnormalities in the large intestines and ileocecal region, since in these sites, the lymphoid tissues are the most enriched and the microbial community is the most abundant; therefore, inflammatory damage and compromised epithelial integrity in these intestinal segments has the most potent capability to supply sufficient intestine-derived antigens and to activate sufficient immune cells and hence has the most potent capability to affect hematopoietic and immune functions[9,10].
This study was approved by the Institutional Review Board of The Central Hospital of Qingdao West Coast New Area and followed the Declaration of Helsinki (No. 2022-10-08). The requirement for written informed consent was waived by the Review Board since this was a retrospective study, and no information about patient identification was revealed in the manuscript.
Categorical data are presented as numbers with percentages, and continuous data are presented as medians with interquartile ranges.
General information, severity of AA, disease duration, complete blood cell count (CBC) results when abdominal CT was performed, major gastrointestinal presentations and suggested radiological diagnosis are listed in Table 1. Seventeen patients (8 men and 9 women) with a median age of 55 years, ranging from 34 years to 78 years were enrolled. The total AA duration ranged from 8 years to 23 years, with a median duration of 13 years, and the total SAA duration ranged from 2 years to 9 years, with a median duration of 5 years. Among all patients, 5 had VSAA. Abdominal tenderness was present in all patients, but abdominal pain was present in only 8 patients, in accordance with the good tolerance of GIDs. Abnormalities in the frequency and property of the feces were present in 11 patients.
| No. | Sex/age | Hematological diagnosis | Total duration (yr) | SAA duration (yr) | CBC results | Abdominal symptoms | Suggested radiological diagnosis | Extraintestinal abnormalities | ||||
| WBC | ANC | Hb | Plts | Rets | ||||||||
| 01 | M/54 | VSAA | 23 | 8 | 0.66 | 0.14 | 44 | 5 | 3.17 | AP, AT | CAA | |
| 02 | M/46 | SAA | 16 | 6 | 1.24 | 0.55 | 42 | 11 | 6.16 | AT | CEC | |
| 03 | F/78 | VSAA | 11 | 3 | 0.65 | 0.17 | 41 | 8 | 1.81 | AP, AT | CD | |
| 04 | F/38 | SAA | 17 | 6 | 1.62 | 0.71 | 45 | 18 | 4.18 | AP, AT | CEC | |
| 05 | M/71 | VSAA | 14 | 4 | 0.57 | 0.08 | 42 | 2 | 1.92 | AT | UC, ATB? | + |
| 06 | M/65 | SAA | 21 | 8 | 1.38 | 0.42 | 46 | 13 | 5.47 | AP, AT | CEC | |
| 07 | F/52 | SAA | 11 | 5 | 1.48 | 0.44 | 53 | 21 | 4.62 | AT | CEC | |
| 08 | M/61 | SAA | 21 | 7 | 1.73 | 0.77 | 62 | 16 | 2.28 | AT | CD, ATB? | + |
| 09 | F/55 | SAA | 9 | 3 | 1.17 | 0.43 | 48 | 6 | 11.75 | AT | CEC | |
| 10 | M/77 | VSAA | 8 | 4 | 0.42 | 0.16 | 40 | 4 | 1.78 | AT | CD | |
| 11 | M/57 | SAA | 12 | 2 | 1.14 | 0.36 | 45 | 14 | 6.32 | AP, AT | CEC | |
| 12 | F/48 | SAA | 12 | 6 | 0.92 | 0.44 | 40 | 3 | 2.08 | AT | CD | |
| 13 | F/34 | SAA | 18 | 7 | 0.92 | 0.31 | 62 | 7 | 1.59 | AP, AT | ATB? | + |
| 14 | F/40 | SAA | 13 | 4 | 0.86 | 0.27 | 44 | 2 | 6.03 | AP, AT | CD | |
| 15 | F/42 | SAA | 20 | 9 | 0.82 | 0.39 | 51 | 18 | 2.14 | AT | CEC | |
| 16 | M/68 | VSAA | 10 | 3 | 0.47 | 0.14 | 39 | 6 | 3.44 | AT | CEC, ATB? | + |
| 17 | F/36 | SAA | 11 | 3 | 1.38 | 0.31 | 46 | 9 | 8.41 | AP, AT | ATB? | + |
Characteristic images are enumerated, analyzed and described in the Discussion section. All patients recruited in this study presented with evident imaging abnormalities that suggested the presence of inflammatory damages in the gastrointestinal tract. Noticeably, inflammatory involvement of the large intestine and the ileocecal region was present in all patients. Inflammatory lesions were also present in the small intestine in all patients, suggesting that the inflammatory pathogenesis was most likely initiated at the proximal gastrointestinal tract. According to the imaging features, a suggestive diagnosis of Crohn’s disease was made in 5 patients, ulcerative colitis in 1 patient, chronic periappendiceal abscess in 1 patient, and tuberculosis infection in 5 patients. Other patients were diagnosed with chronic enteroclolitis with acutely aggravated inflammatory damage. The suggested radiological diagnosis is listed in Table 1.
The severity of cellular immune-mediated hematopoietic suppression in patients with AA commonly fluctuates in parallel with the waxing and waning of physical and mental stresses, and these stresses are obviously driven by active chronic inflammatory conditions and their recurrently aggravated episodes. In flared inflammatory episodes, blood cell production is heavily suppressed, and cytopenia worsens. With effective treatment of the inflammatory episodes, blood cell productivity can be significantly improved. Along with the increased frequency of and decreased intervals between these inflammatory episodes, patients eventually enter into an advanced stage, in which immune-mediated hematological damage is exacerbated and the sensitivity to previous effective treatments is lost[1,2,37,38].
This is not surprising because the blood cells themselves are immune cells, and their production is regulated largely in response to a variety of microbial attacks. When confronting an acute and limited infection, host hematopoiesis skews its proliferation and differentiation toward the production of innate immune cells to fight against the invading microbes at the expense of reduced self-renewal capacity[39,40]. After the infected pathogens are cleared out, the activated host immune system quickly returns to the homeostatic state, and the skewed blood cell production ends. However, in the setting of active chronic inflammatory conditions or overwhelming infections, host hematopoiesis can be heavily suppressed and exhausted due to prolonged and exaggerated immune responses and the subsequently overproduced proinflammatory mediators[41-43], resulting in heavily decreased marrow cellularity and increased peripheral cytopenia in genetically susceptible subjects, which are the characteristic morphological and immunological changes seen in AA[1-3]. The sustenance of an active inflammatory condition in which the degree and duration of immune responses are sufficient to induce severe aplastic cytopenia critically necessitates sufficient activated immune cells and a continuous antigen supply.
The gastrointestinal tract provides the largest interface bridging the host neuro-endocrine-immune system with environmental factors and is constantly confronted with a variety of environmental challenges. The gastrointestinal tract also hosts the body’s most abundant gut-associated lymphoid tissues and microbial community[9,10]. These structural and functional characteristics make the gastrointestinal tract the most vulnerable site for pathogen invasion and chemical injuries and the most common source of a continuous antigen supply. Therefore, the gastrointestinal tract becomes the most important site for pathological interactions between host immune cells and pathogenic antigens.
The gastrointestinal tract is the most common site for chronic and active inflammatory niches not only due to various pathogenic microbial attacks and chemical injuries but also due to dysbiotic commensal microbes and autoimmunity. Such abundant lymphoid tissues and microbial communities confer on the gastrointestinal tract the ability to provide sufficient activated immune cells and a continuous antigen supply and thereby have the most potent capacity to continuously release excessive proinflammatory cytokines.
Under chronic and active inflammatory conditions, upregulated human leukocyte antigen and pattern recognition receptors on hematopoietic progenitors enhance their responsiveness to pathogenic stimulation[44-46], and upregulated Fas molecules accelerate their apoptotic cell death[45], eventually resulting in the exhaustion of hematopoietic progenitor cells. The severity of GIDs is largely affected by changes in a variety of environmental factors, such as food supplements[47-49], antibiotic abuse[50,51], mental stresses[52,53] and pathogen invasion, leading to the fluctuant property of GIDs, in accordance with the fluctuant property of AA.
AA has been reported to be associated with gut inflammatory diseases, including inflammatory bowel disease, celiac disease and neutropenic enterocolitis[8]. In our previously reported case, intermittent treatments with a gut-cleansing preparation achieved reproducible hematological remissions, providing direct evidence for the role of GIDs in the initiation and perpetuation of AA pathophysiology[4]. Merely gluten-free diets[5] or resection of diseased intestinal segments[6] can achieve excellent hematological improvement, providing convincing evidence that GIDs play an indispensable role in the sustenance of AA pathophysiology.
In this pathogenic process, impaired intestinal integrity and increased epithelial permeability play pivotal roles[11,12]. These GID-associated morphological changes could be detected by various imaging modalities. Abdominal CT is a readily accessible and highly efficient imaging modality for detecting morphological changes in the gastrointestinal tract[14-16,19,20]. In this study, we explored the abdominal imaging presentations in patients with SAA in search of the inflammatory niche when the patients presented with systemic inflammatory stresses. We selected patients with SAA experiencing flared episodes because during this stage, morphological changes due to the gut inflammation are probably more serious and hence more easily identified by radiological examination.
In the evaluation of abdominal CT imaging abnormalities, particular attention has been given to inflammatory abnormalities in the ileocecal region and the colonic segments because they host the most enriched microbial community and lymphoid tissues[9,10,19]; therefore, inflammatory diseases and compromised intestinal barriers in these bowel segments have the most potent capacity to provide sufficient intestine-derived antigens and activated immune cells to affect hematopoietic and immune functions irrespective of whether they are primary damage or secondary to dysbiotic gut microbiota. As demonstrated by this study, all patients with SAA during flared inflammatory episodes had evident morphological abnormalities that could reflect the presence of a severely damaged intestinal structure and function in the ileocecal region and the colonic segments. All patients also presented with inflammatory damages in the proximal small intestine, suggesting that inflammatory damages in the upper gastrointestinal tract led to the inflammatory damages in the downstream intestinal segments, probably by altering the gut microbial composition[54-56]. In the following sections, we described the characteristic CT imaging findings in each patient in the category of readily identified morphological presentations.
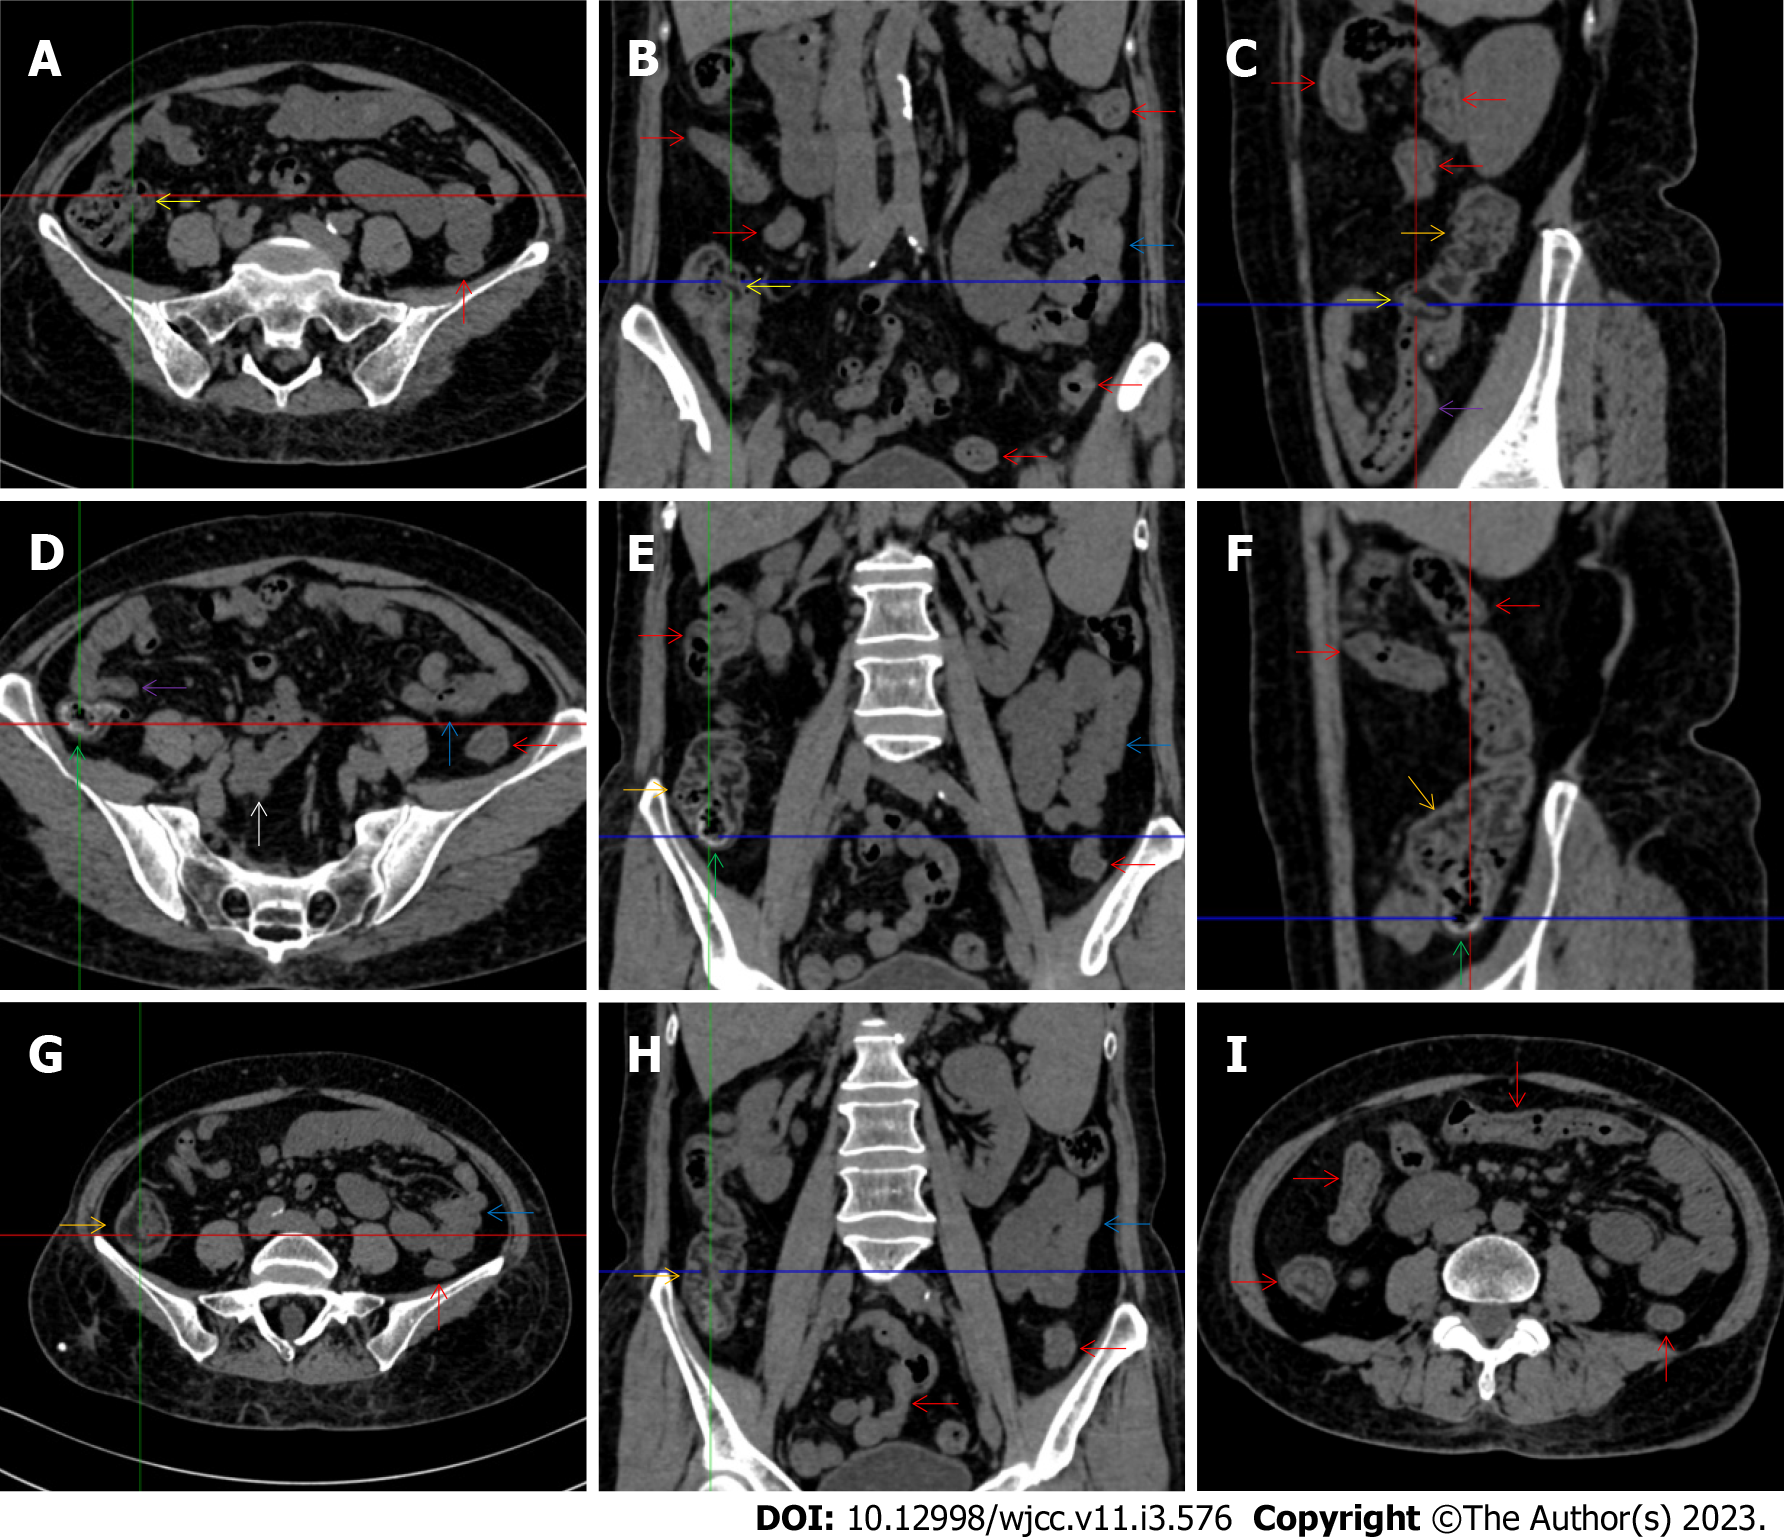
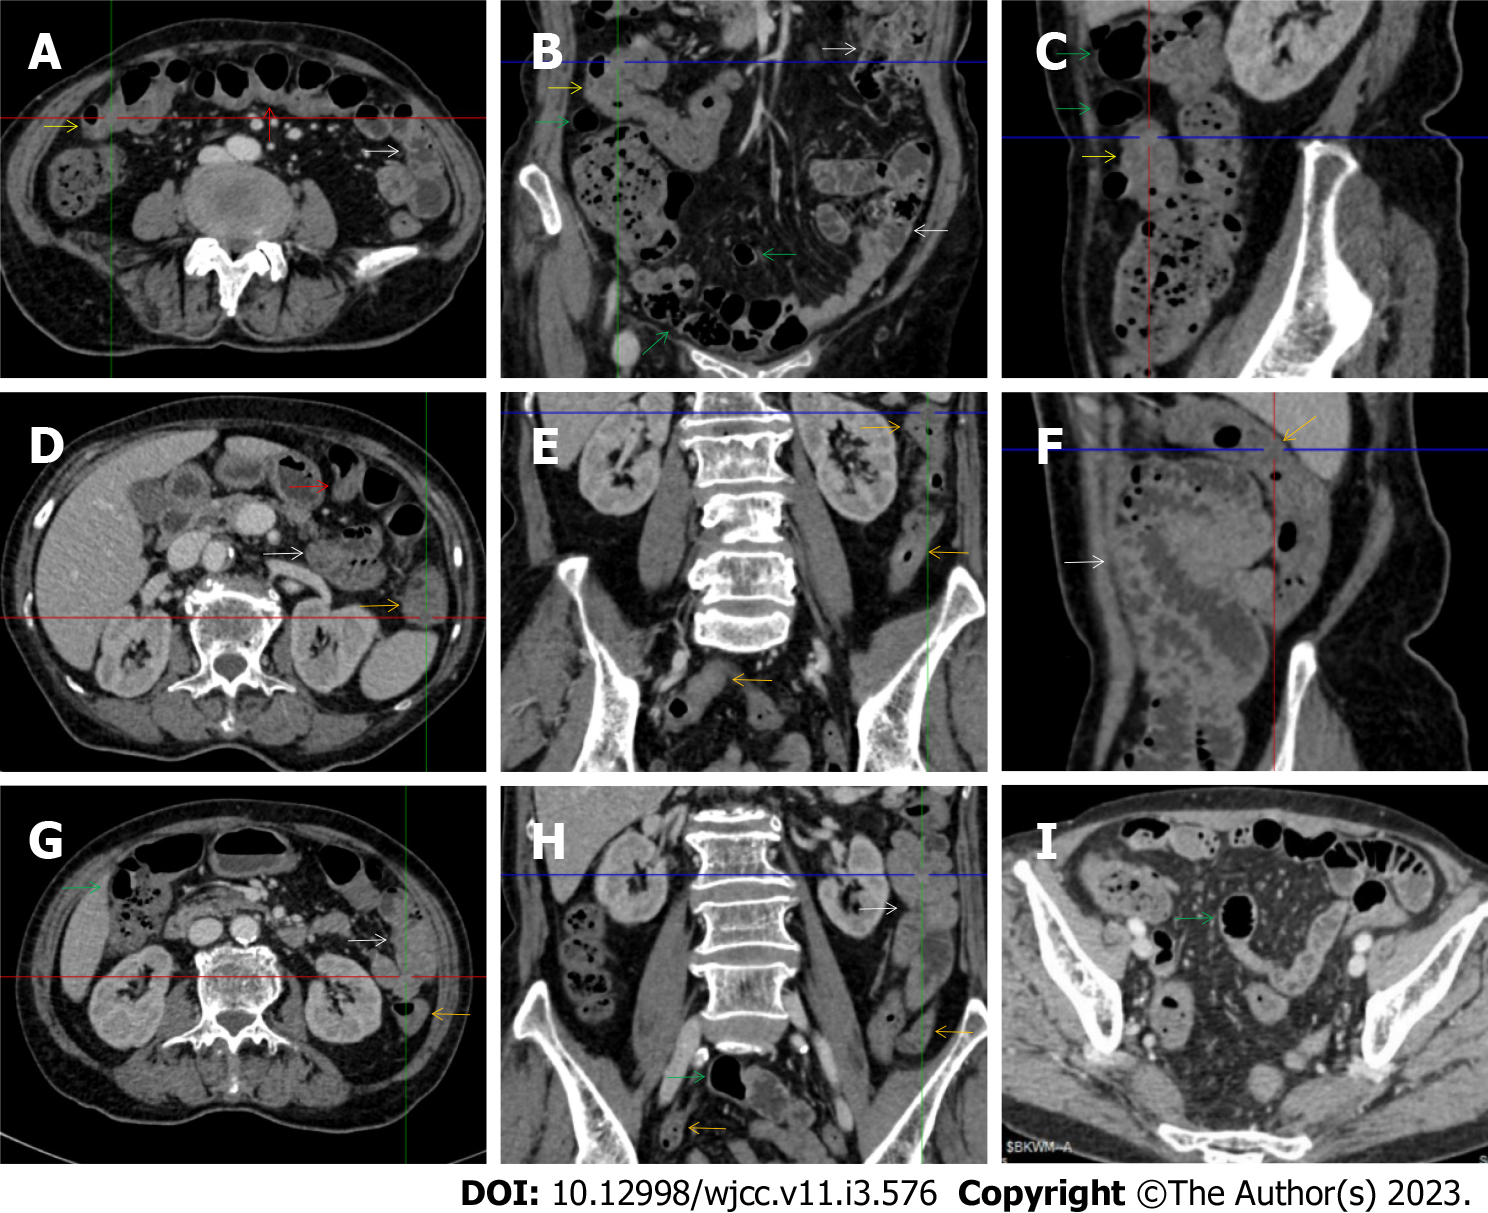
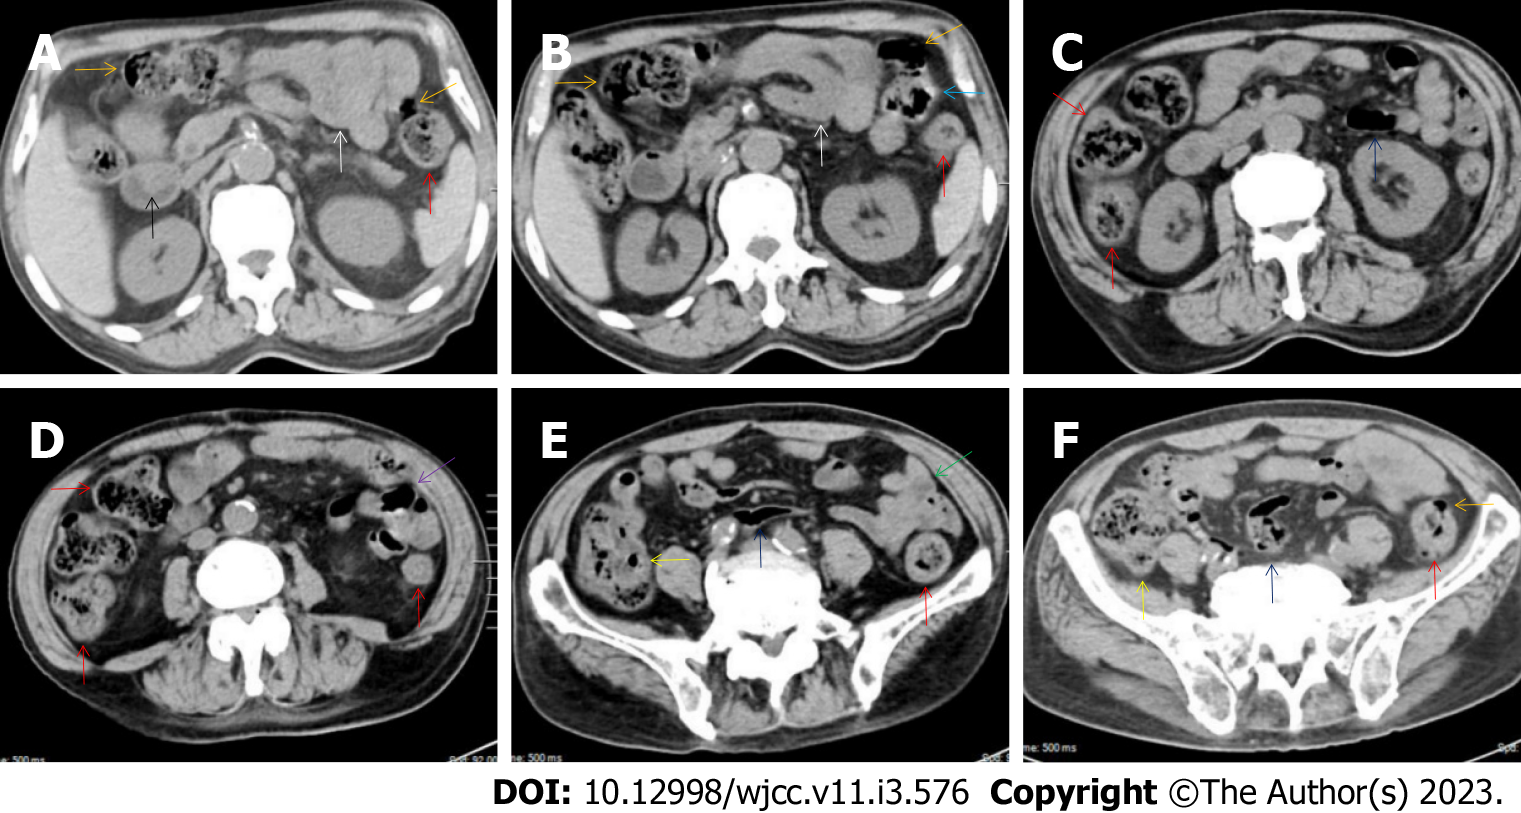
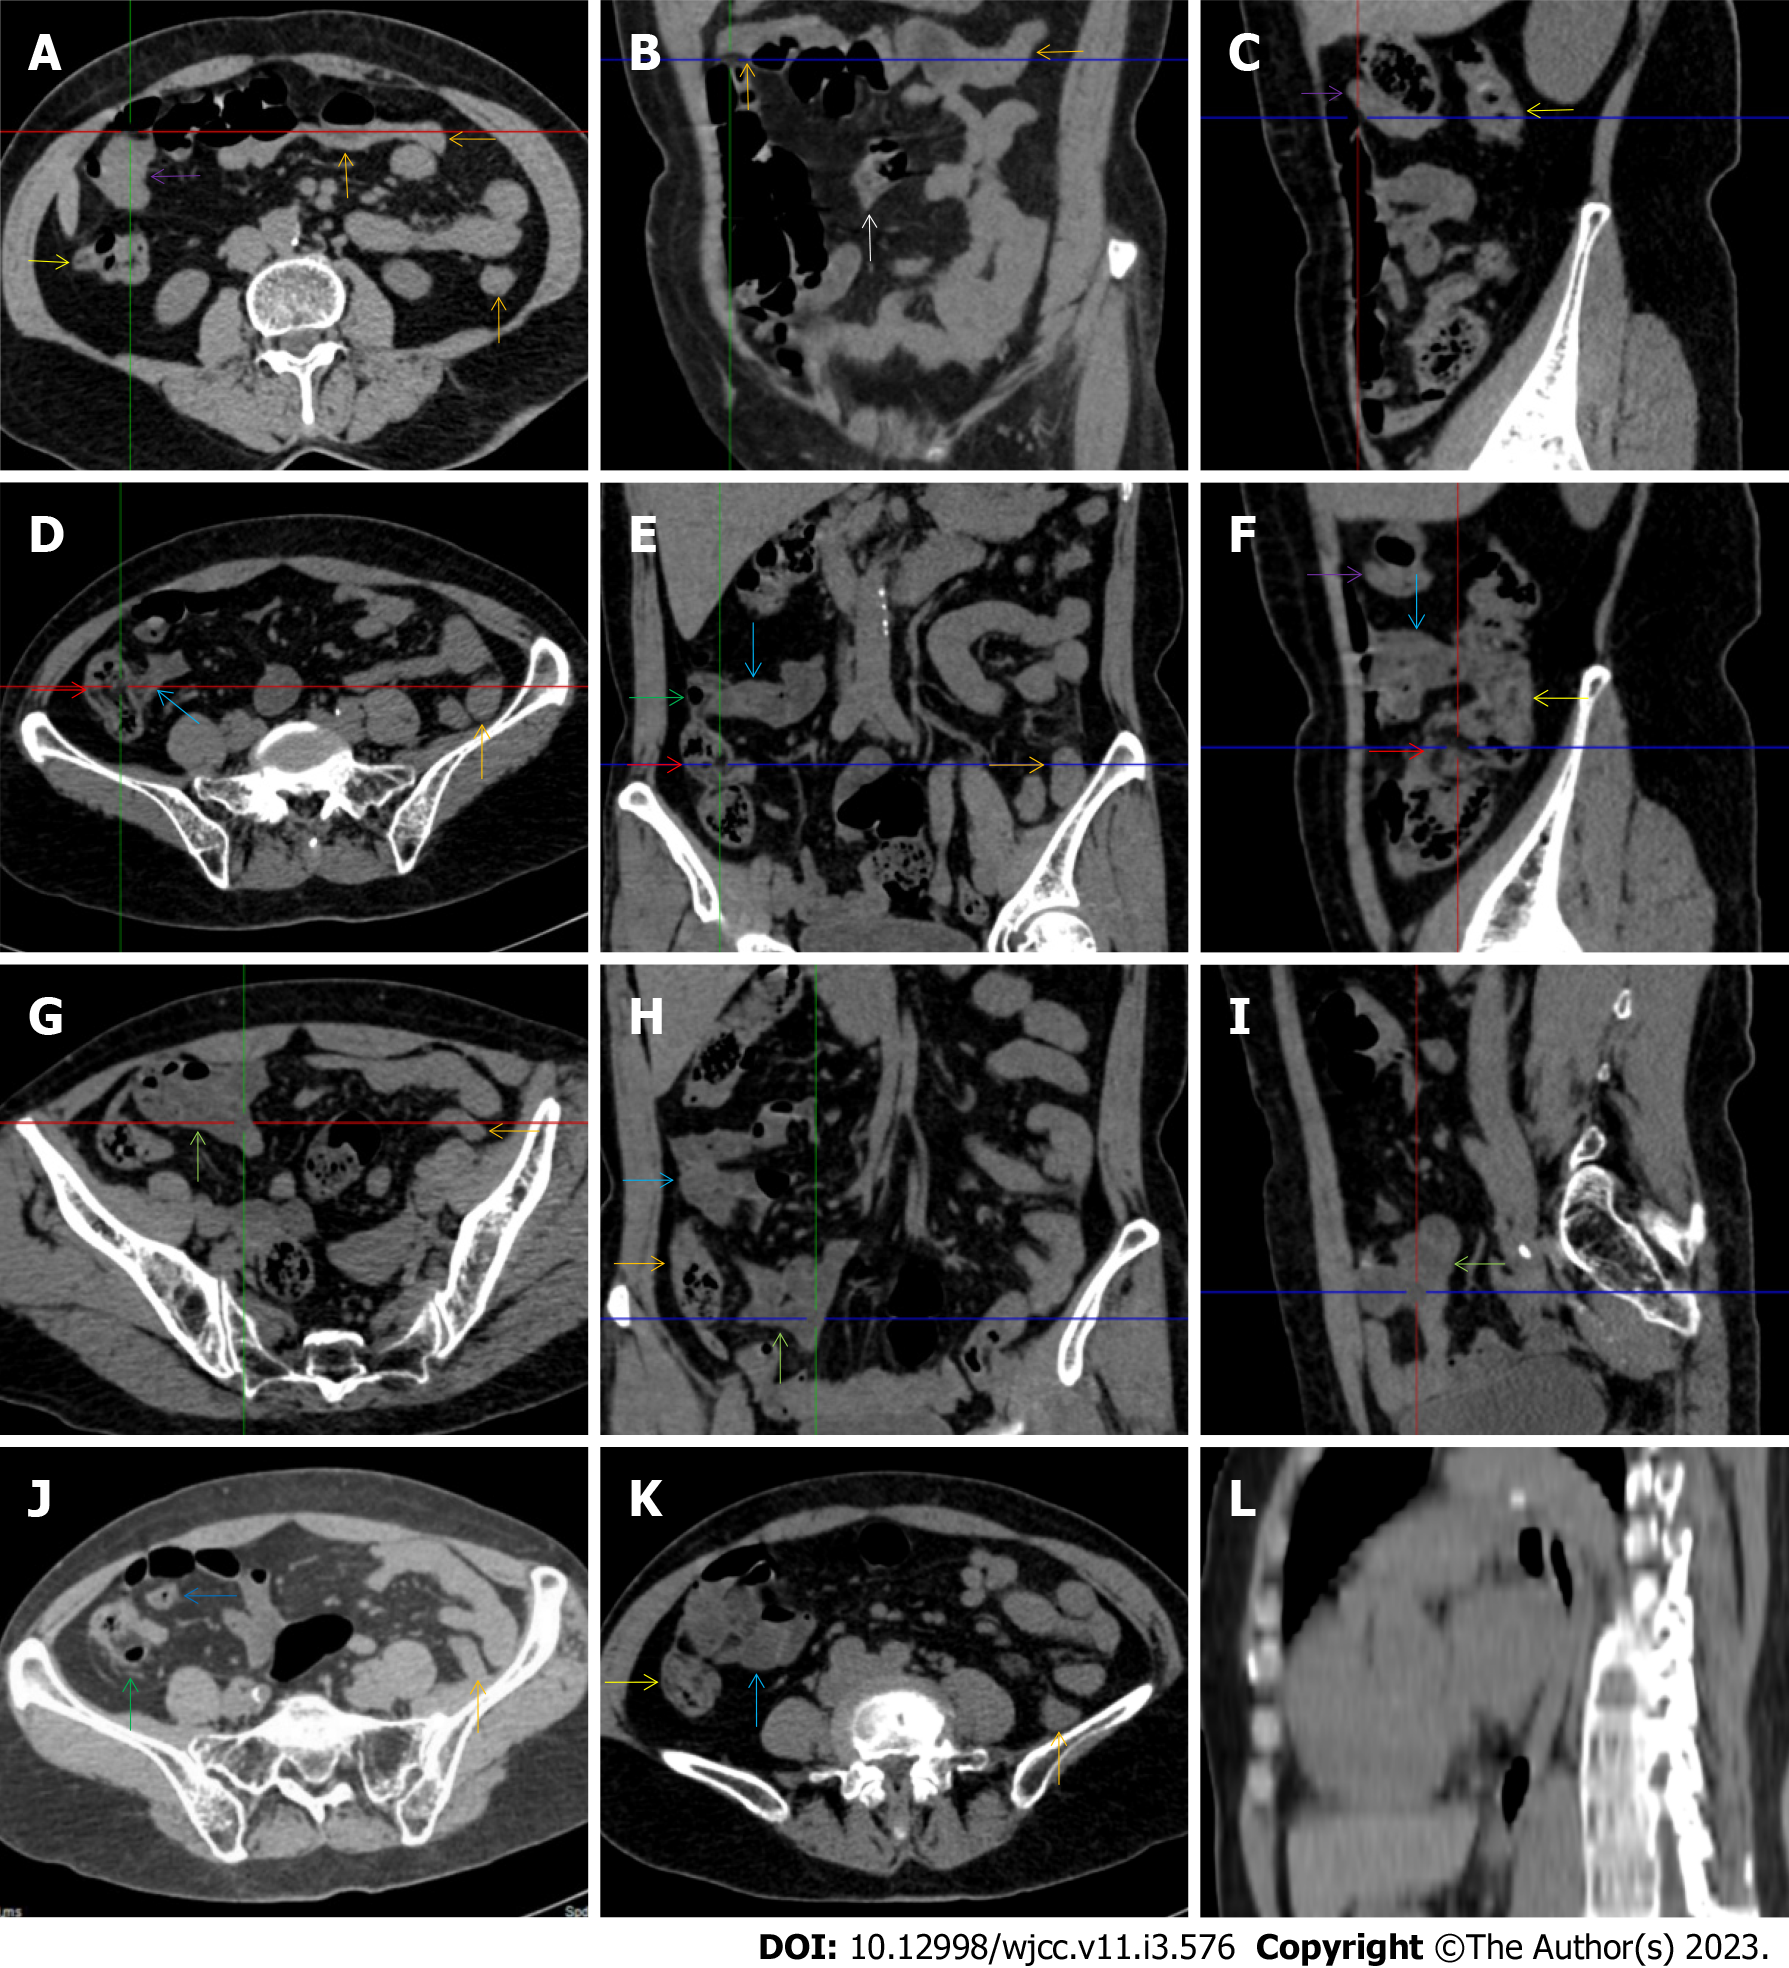
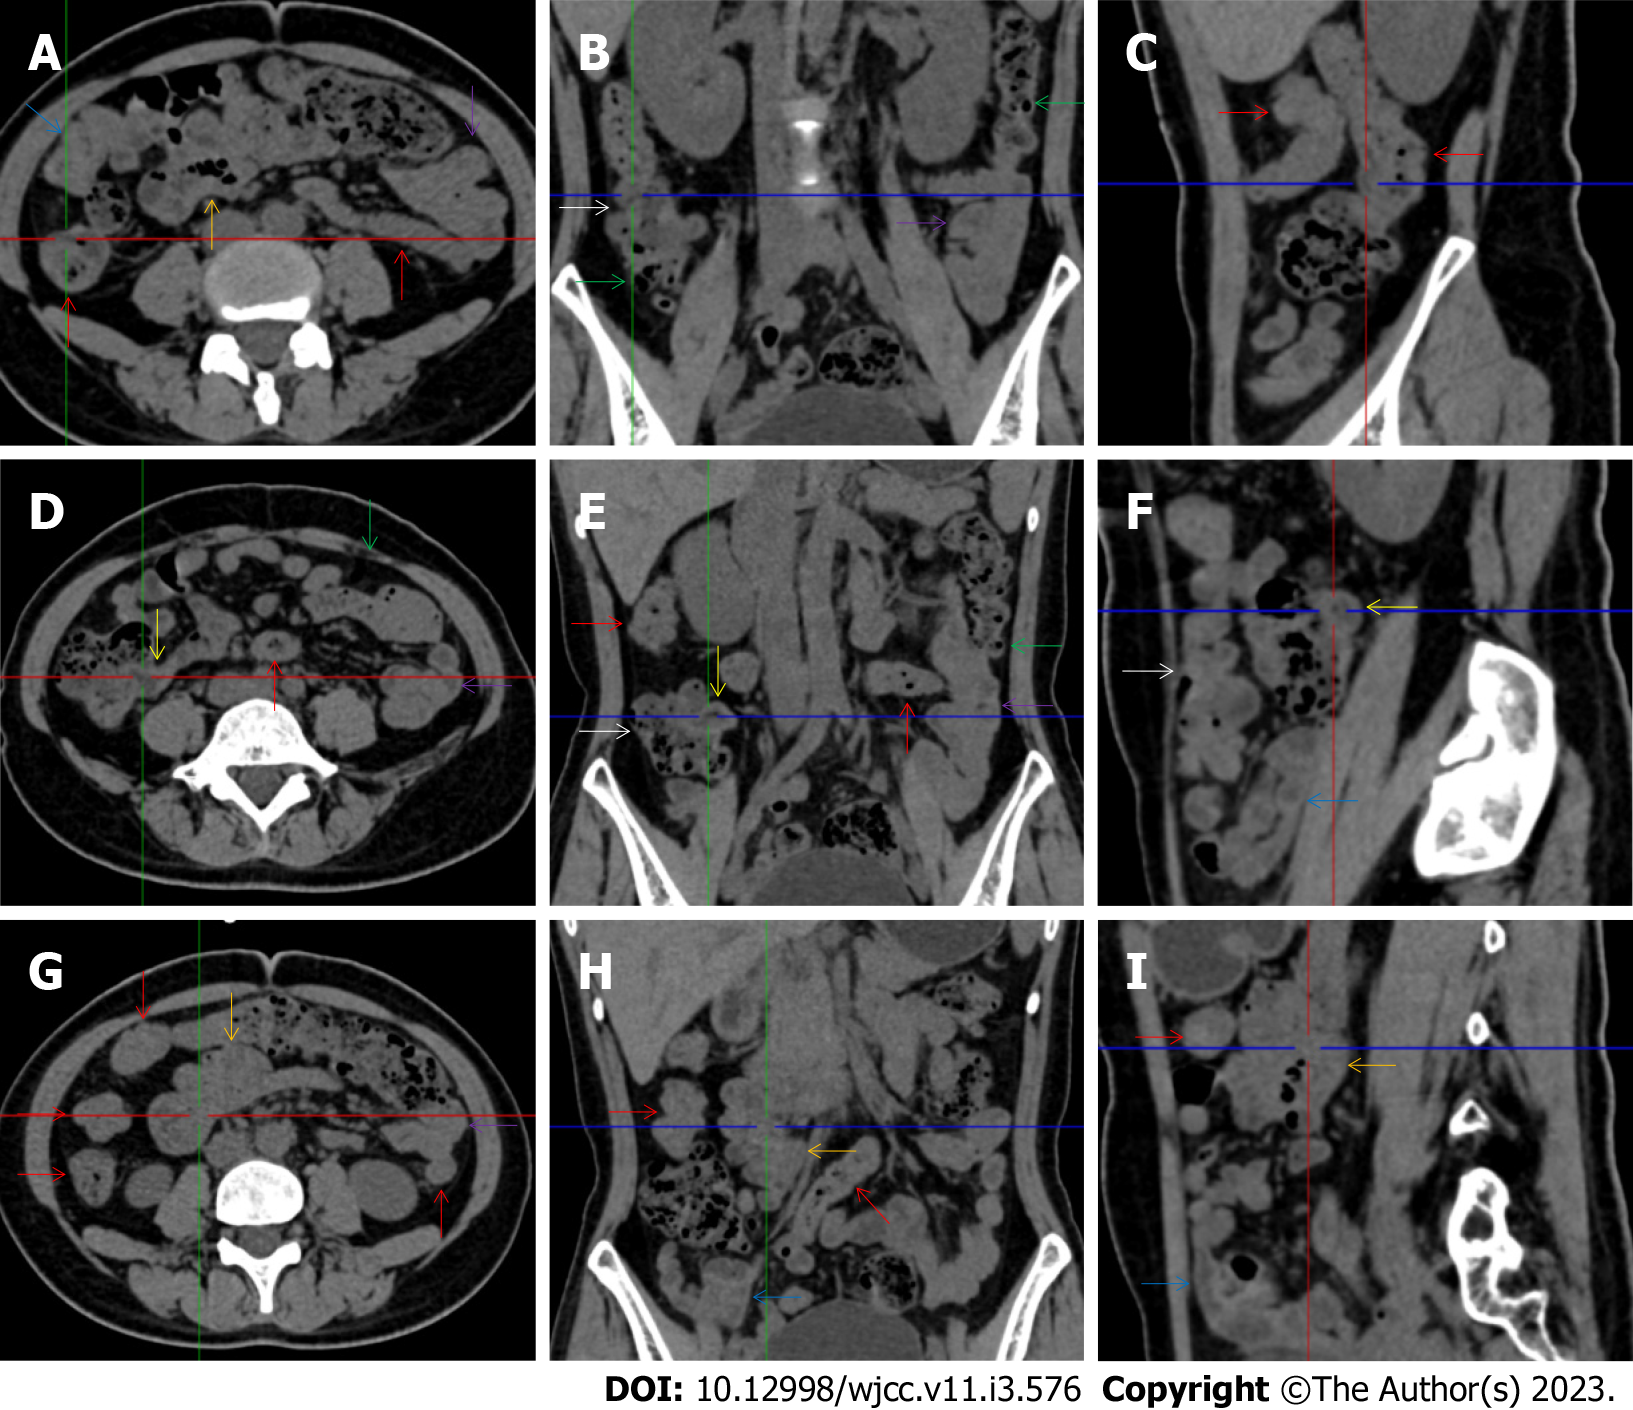
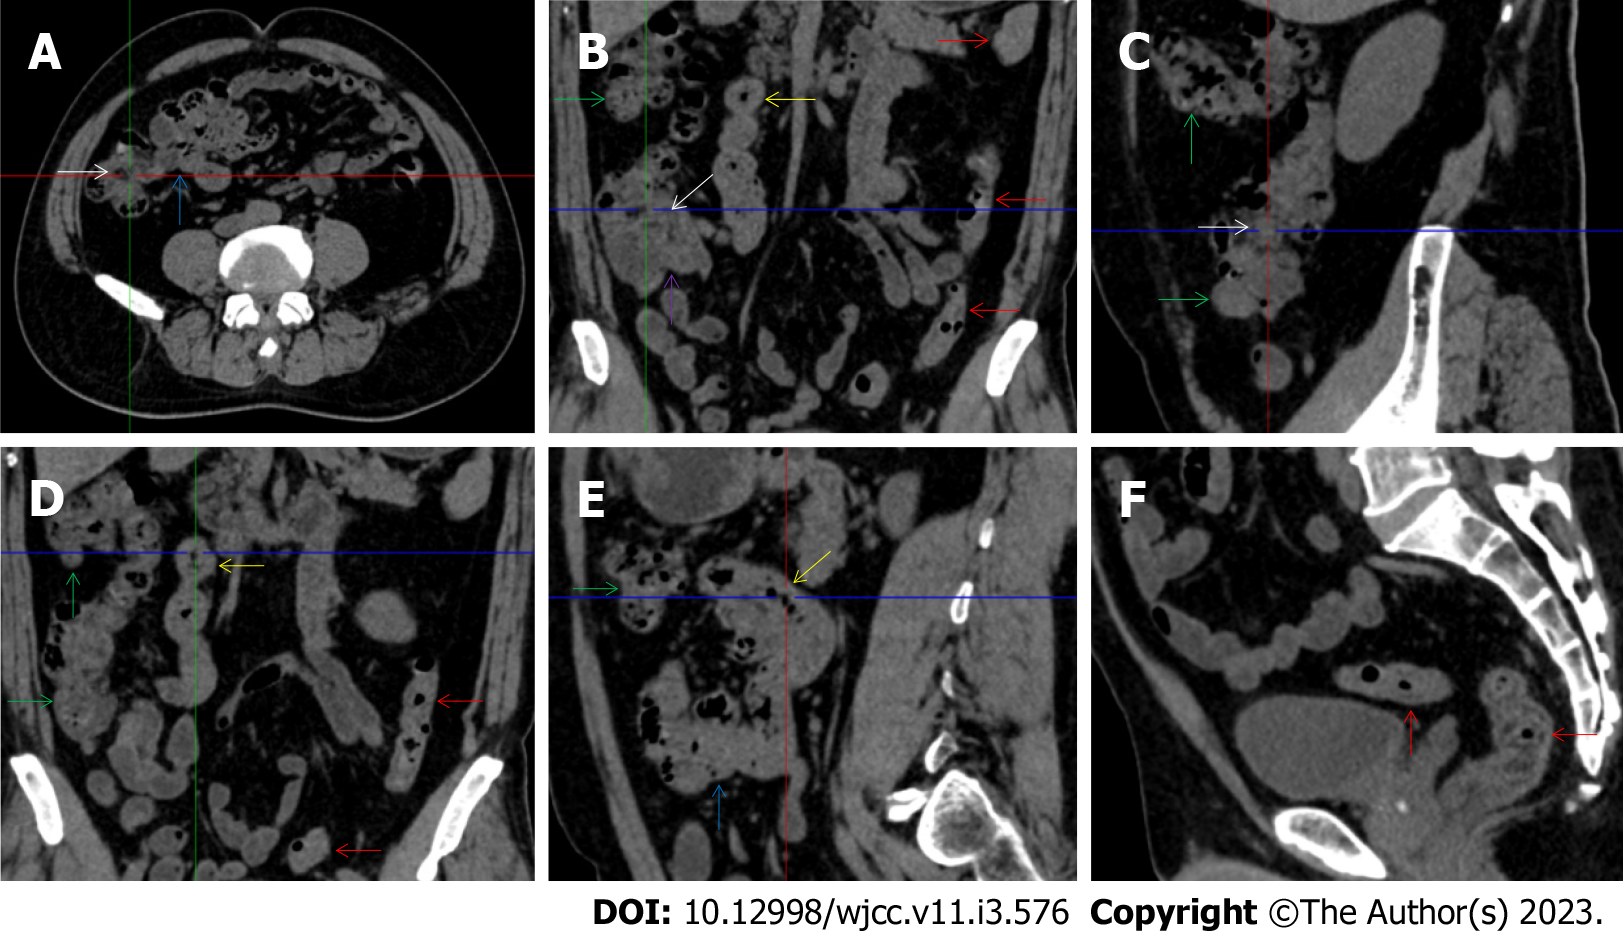
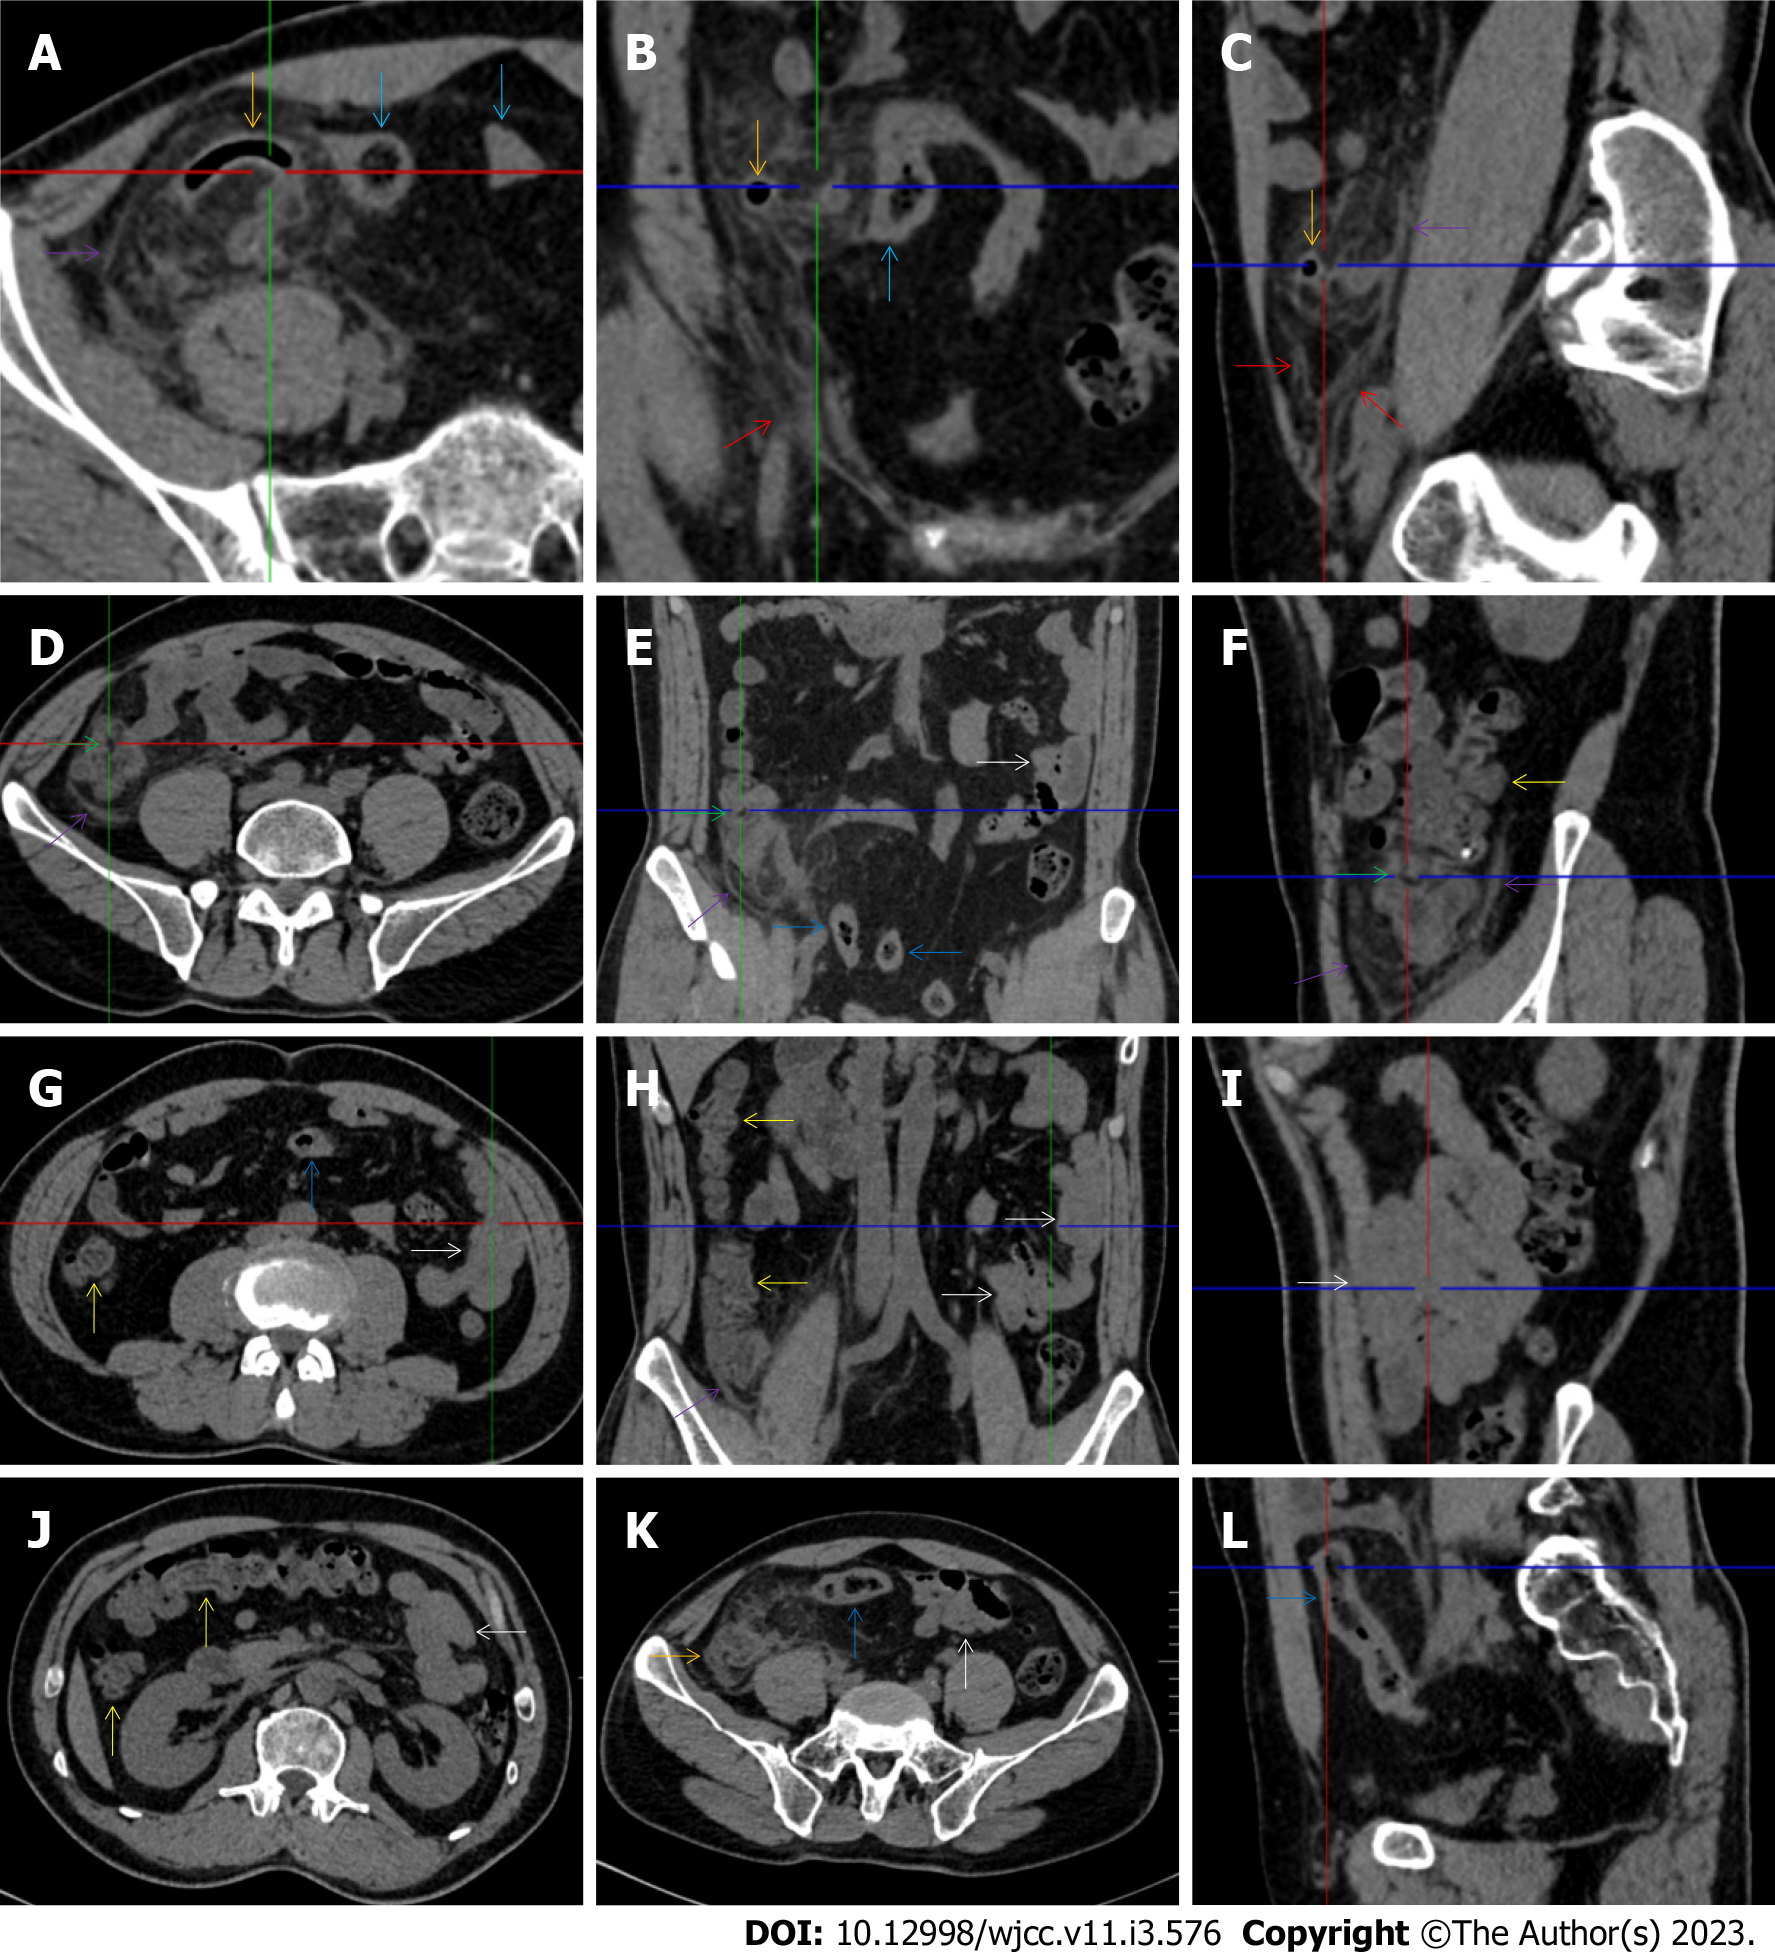
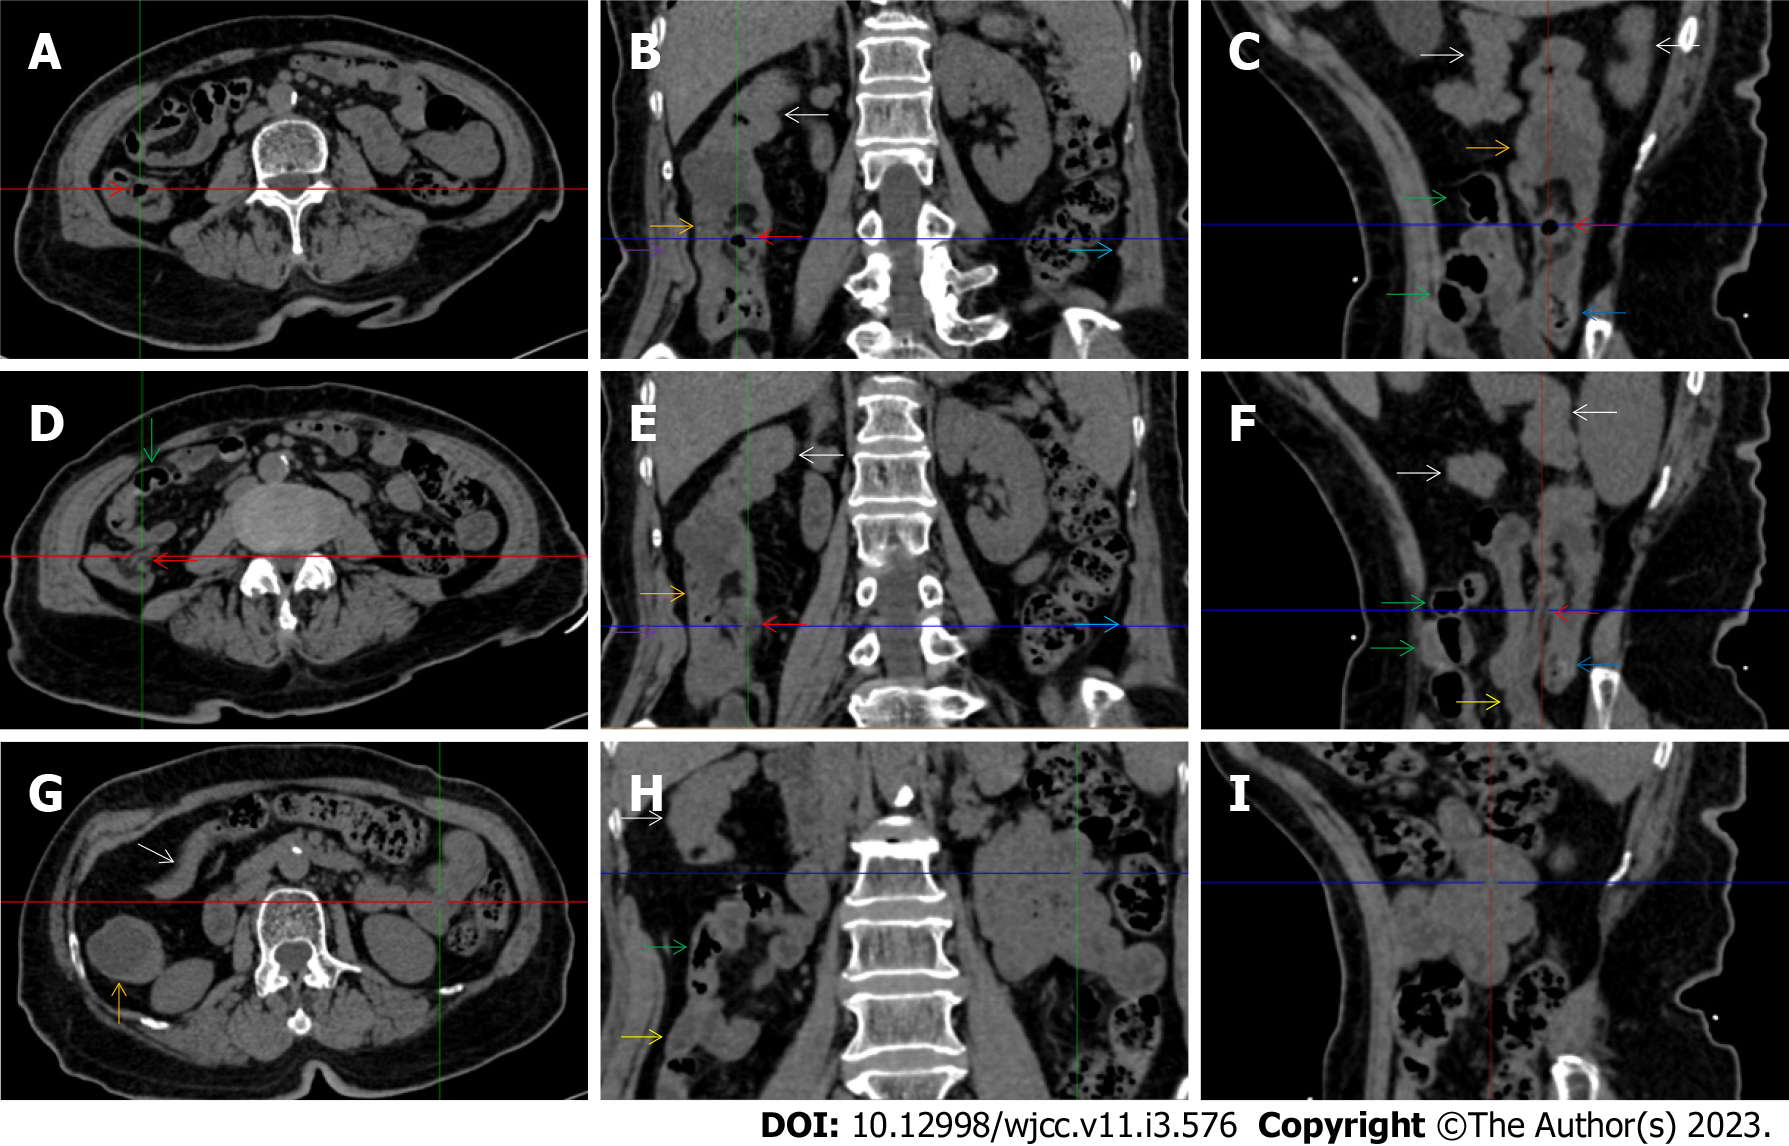
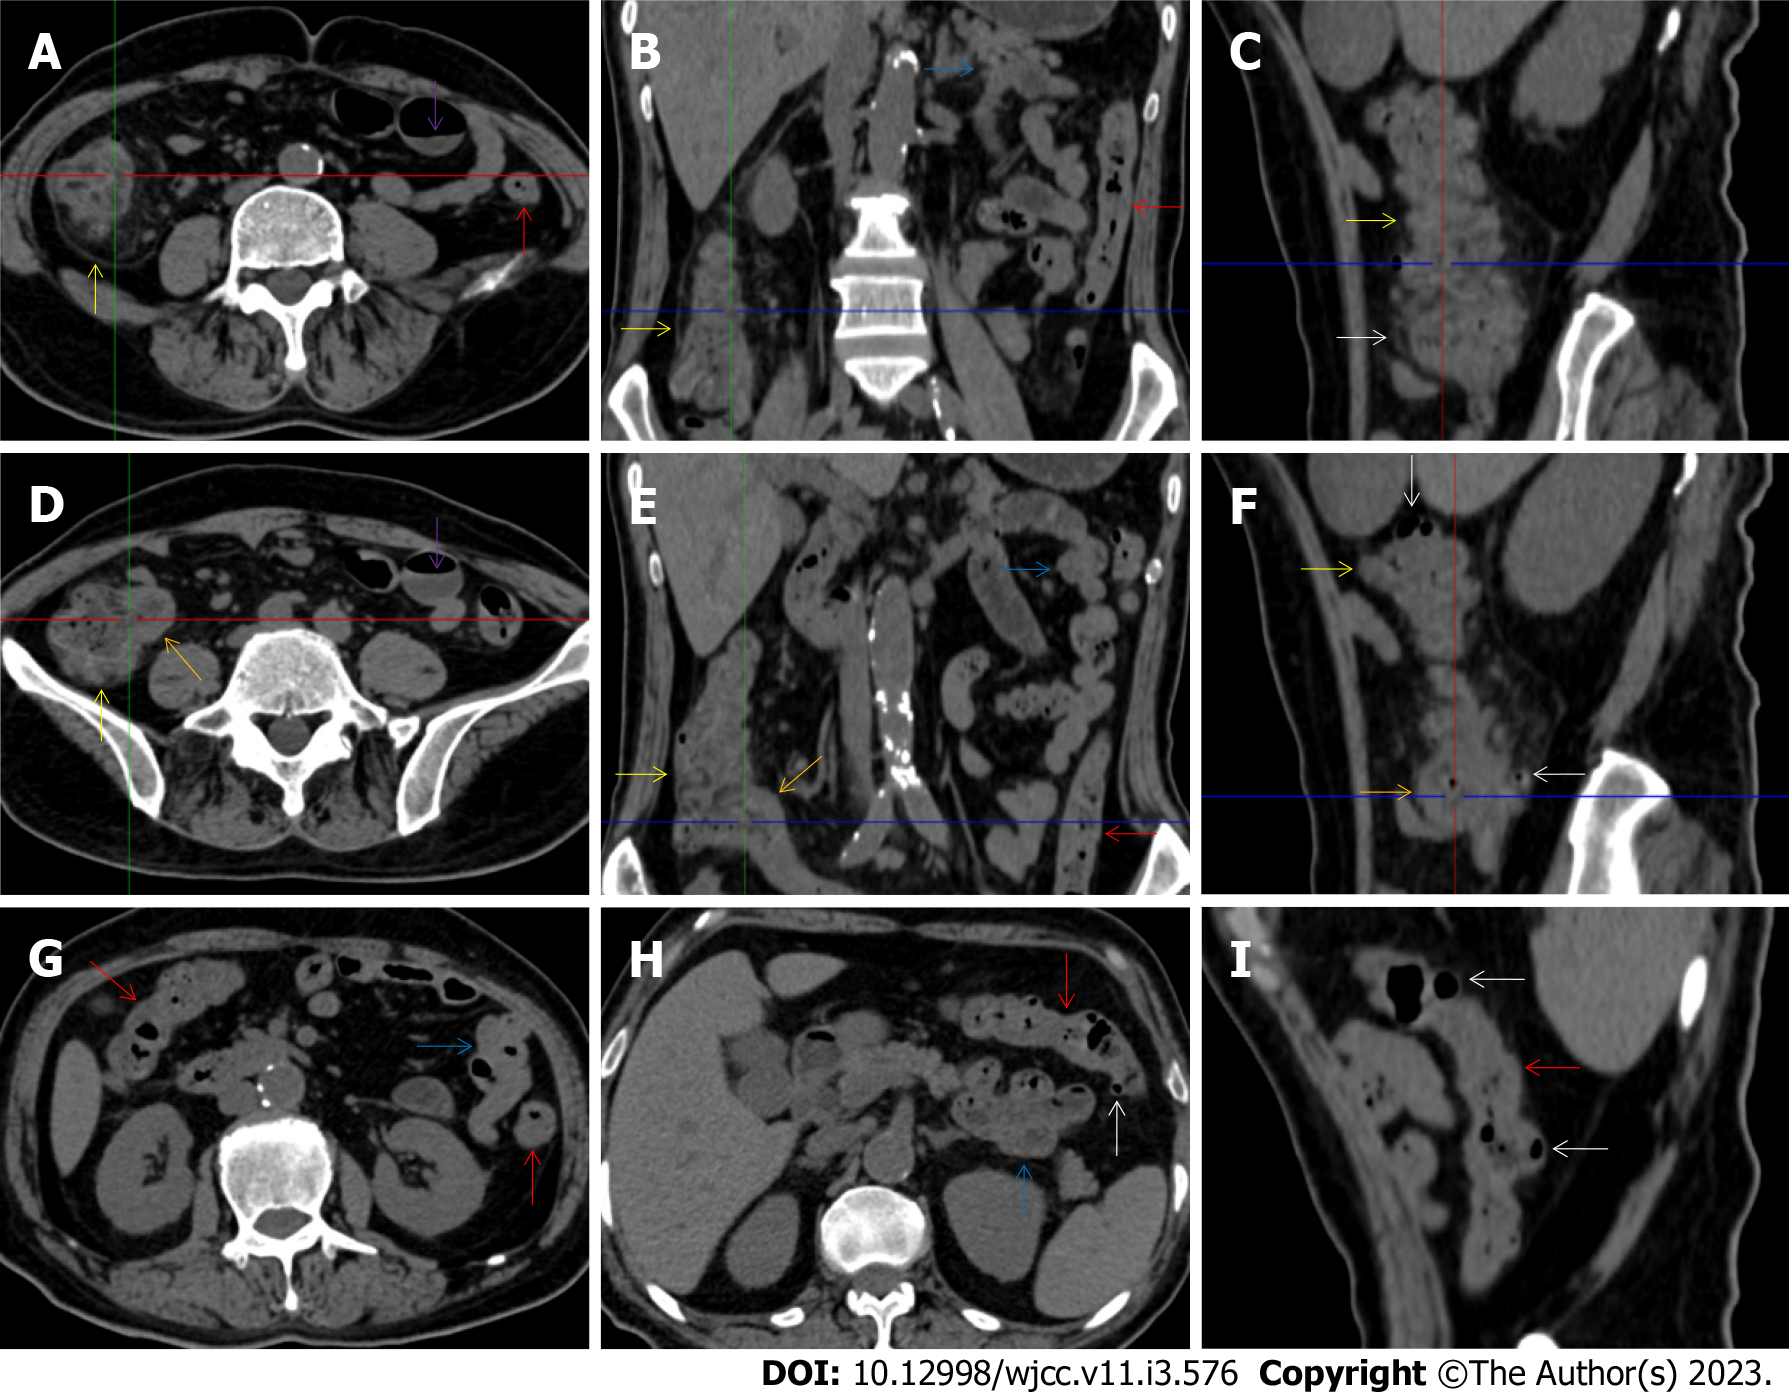
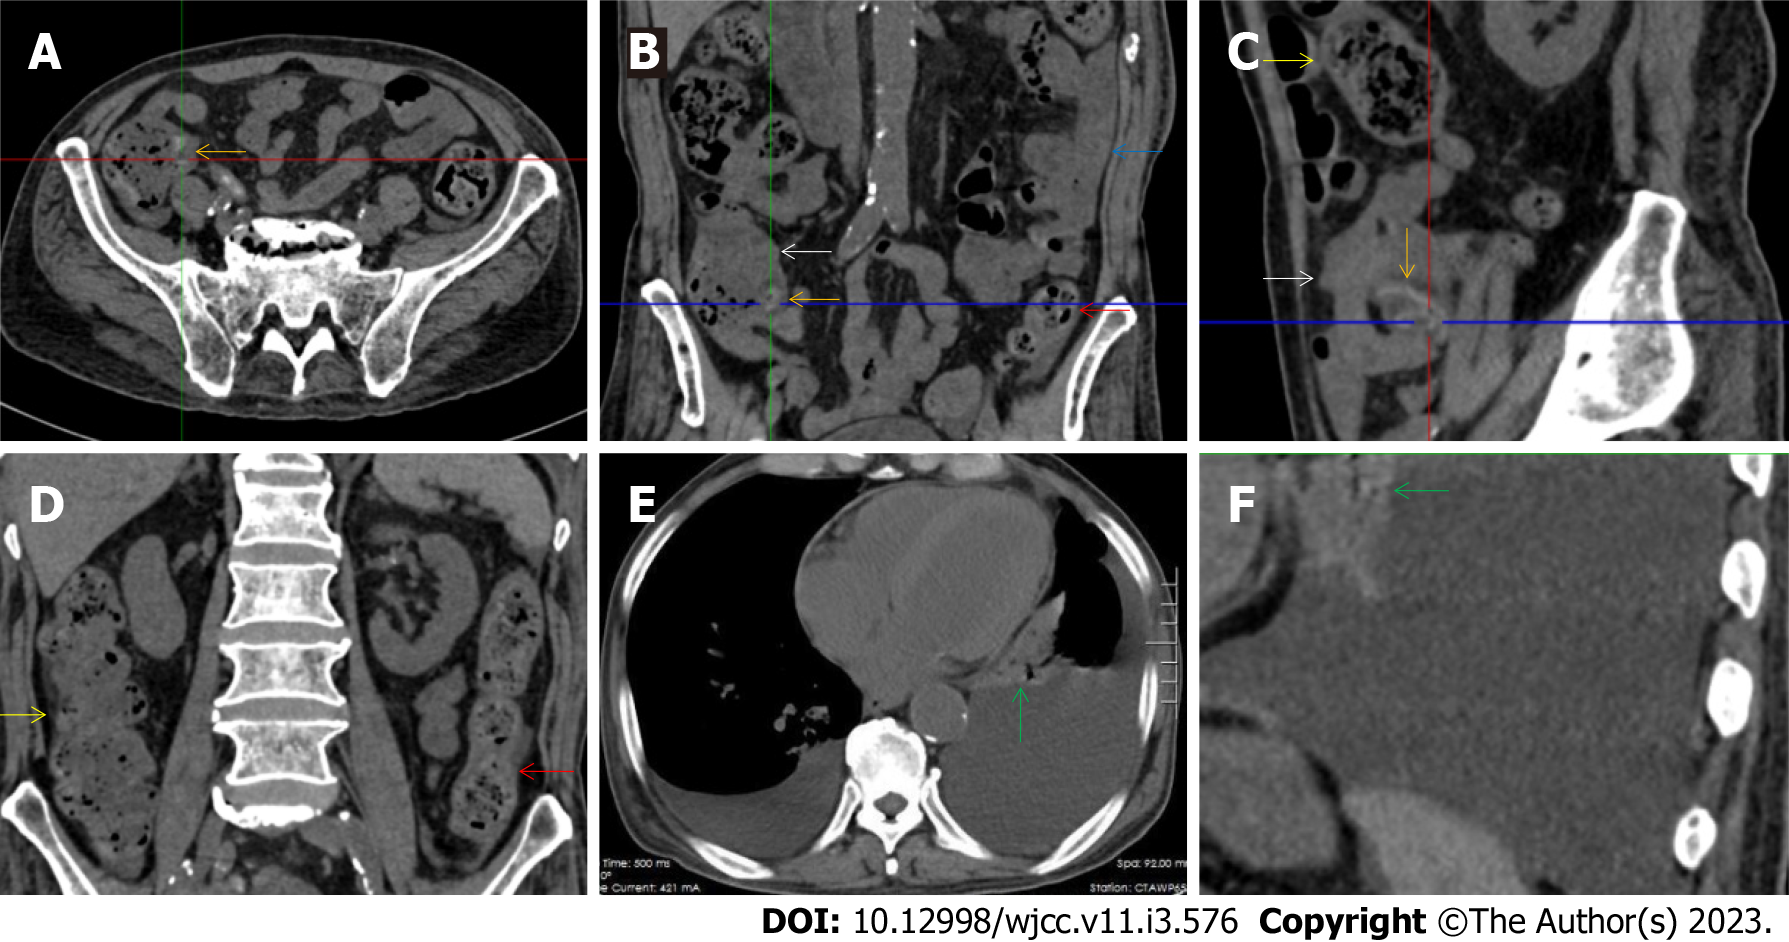
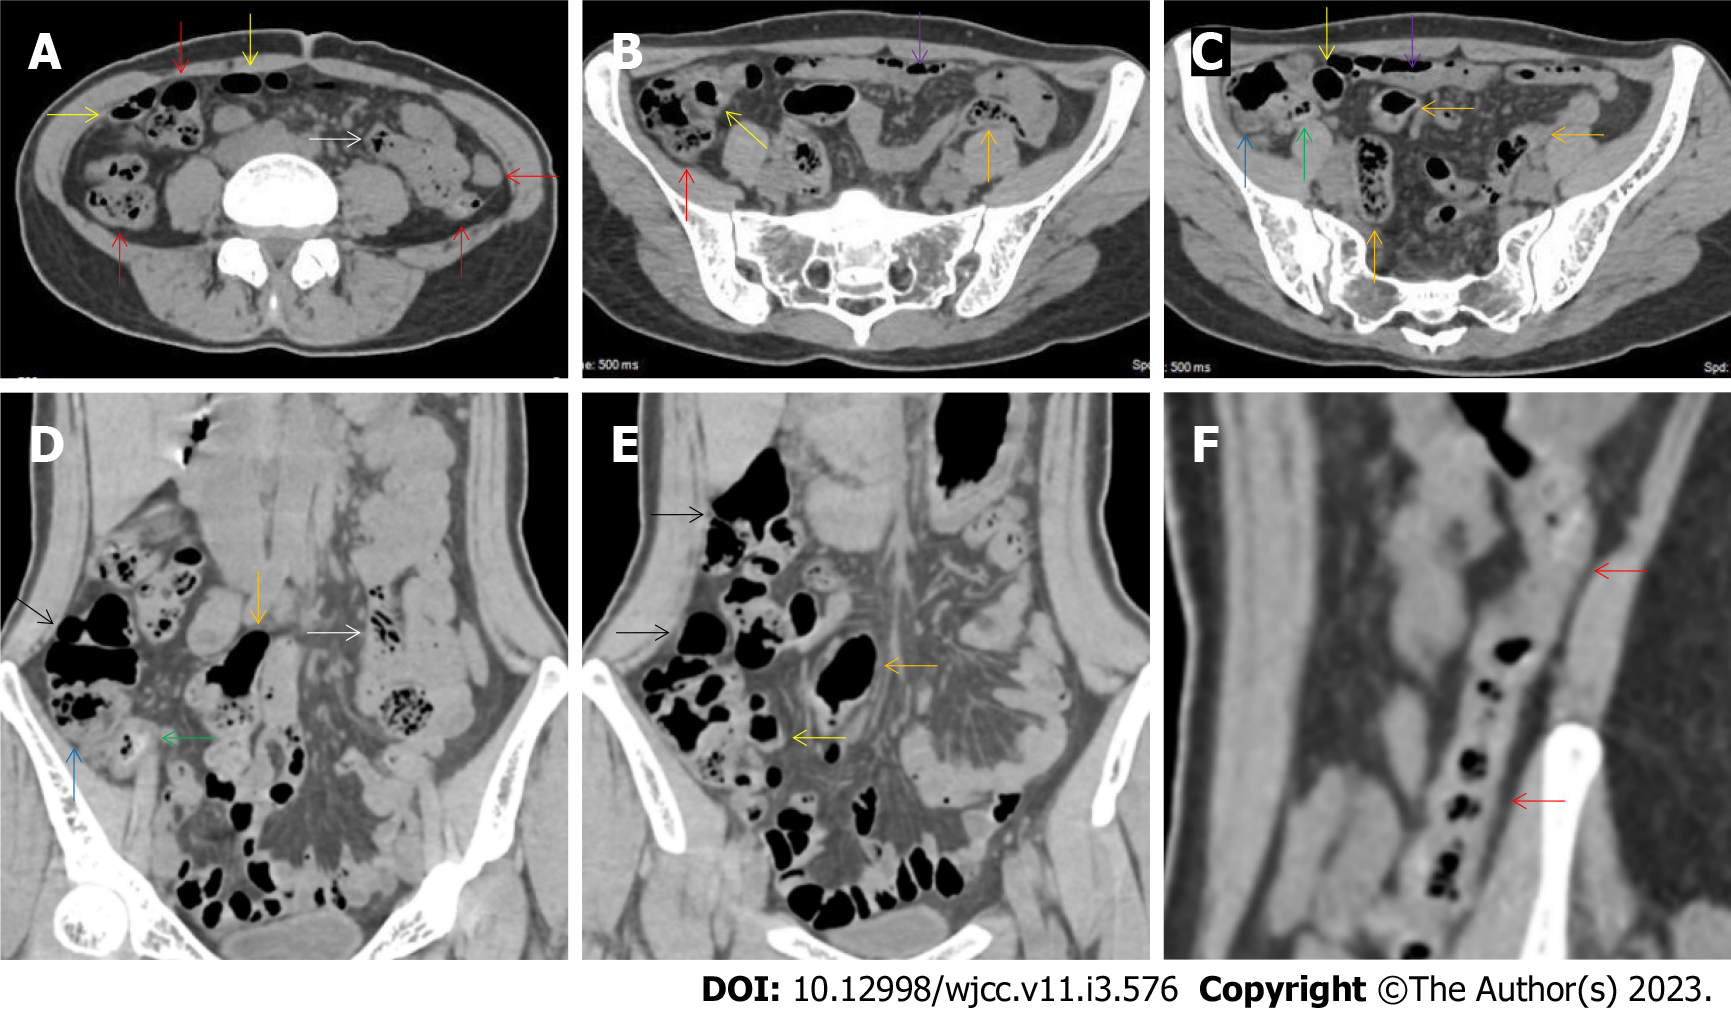
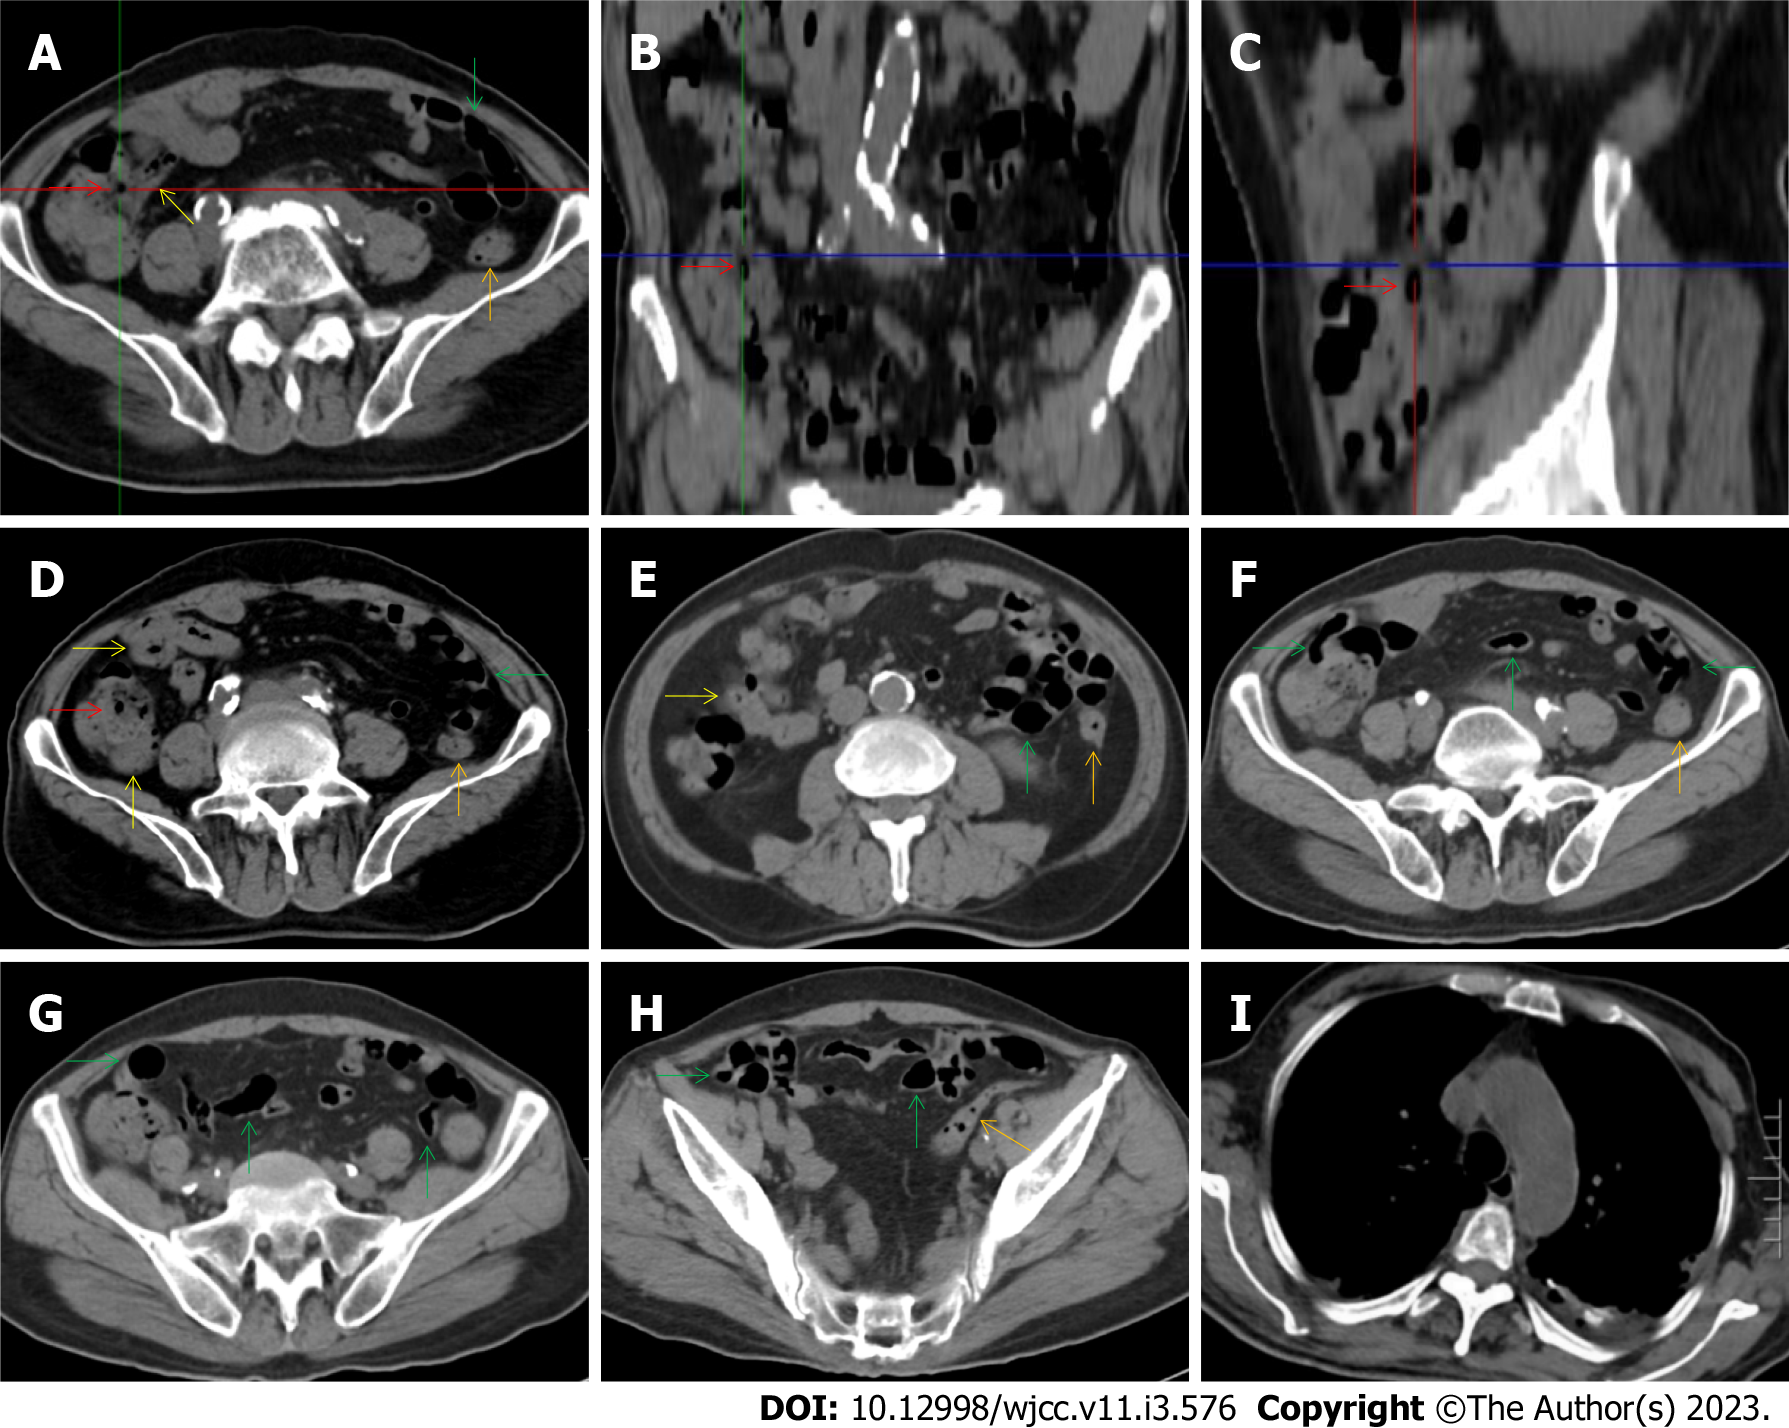
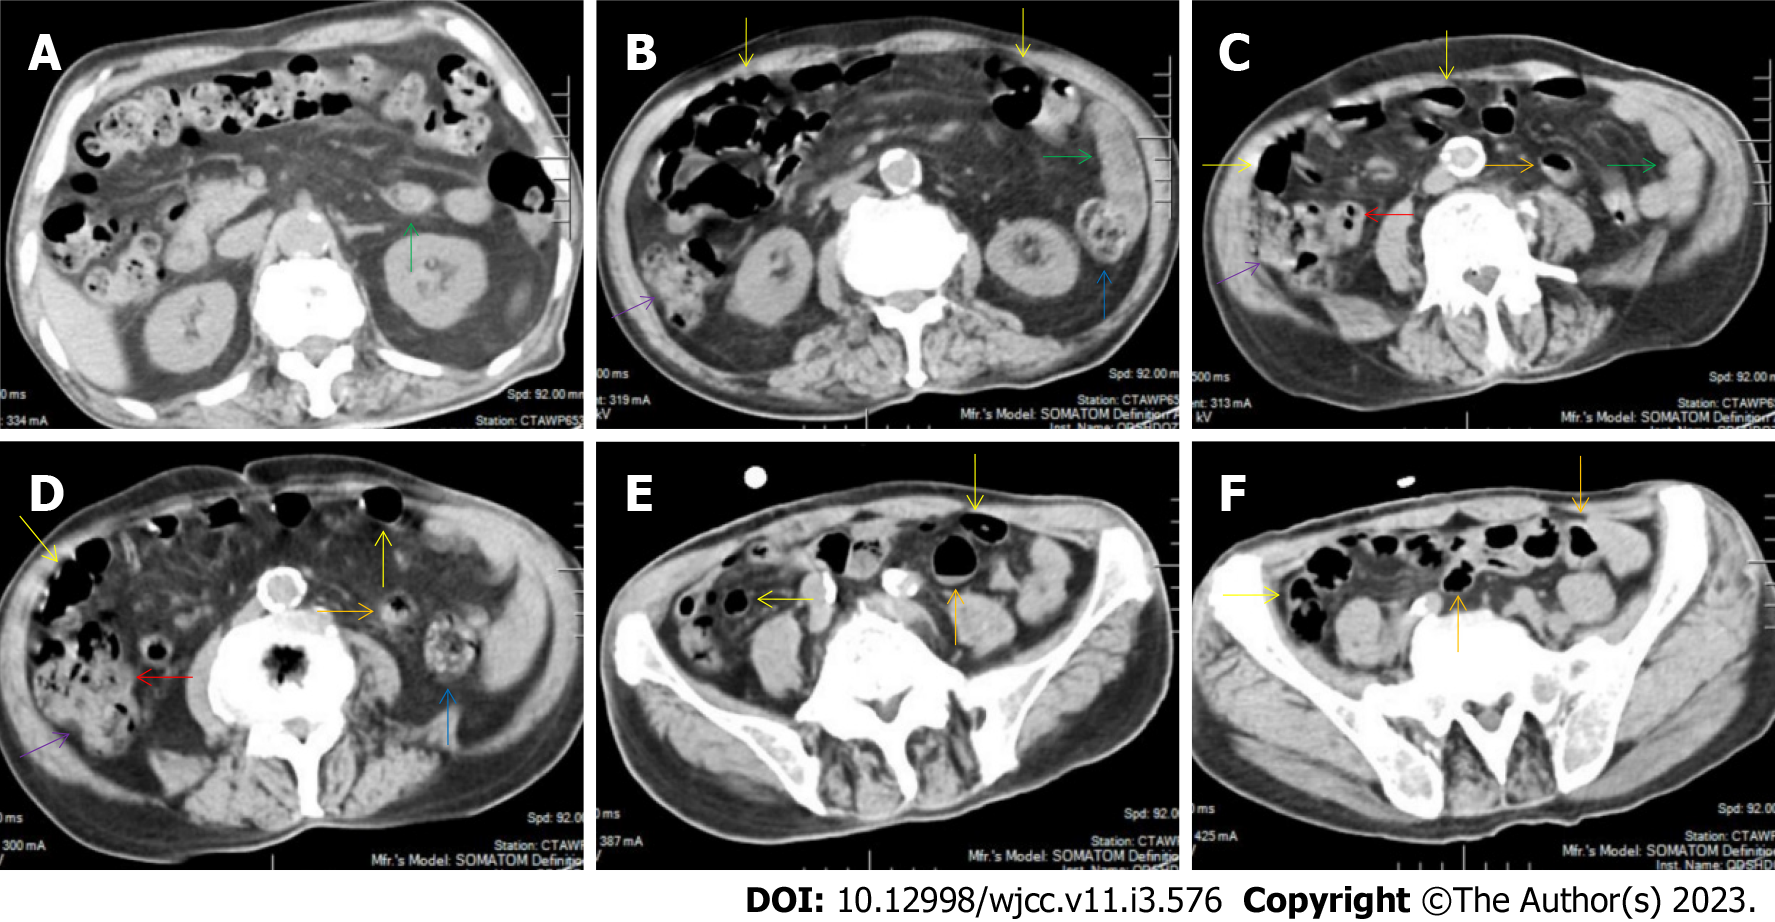
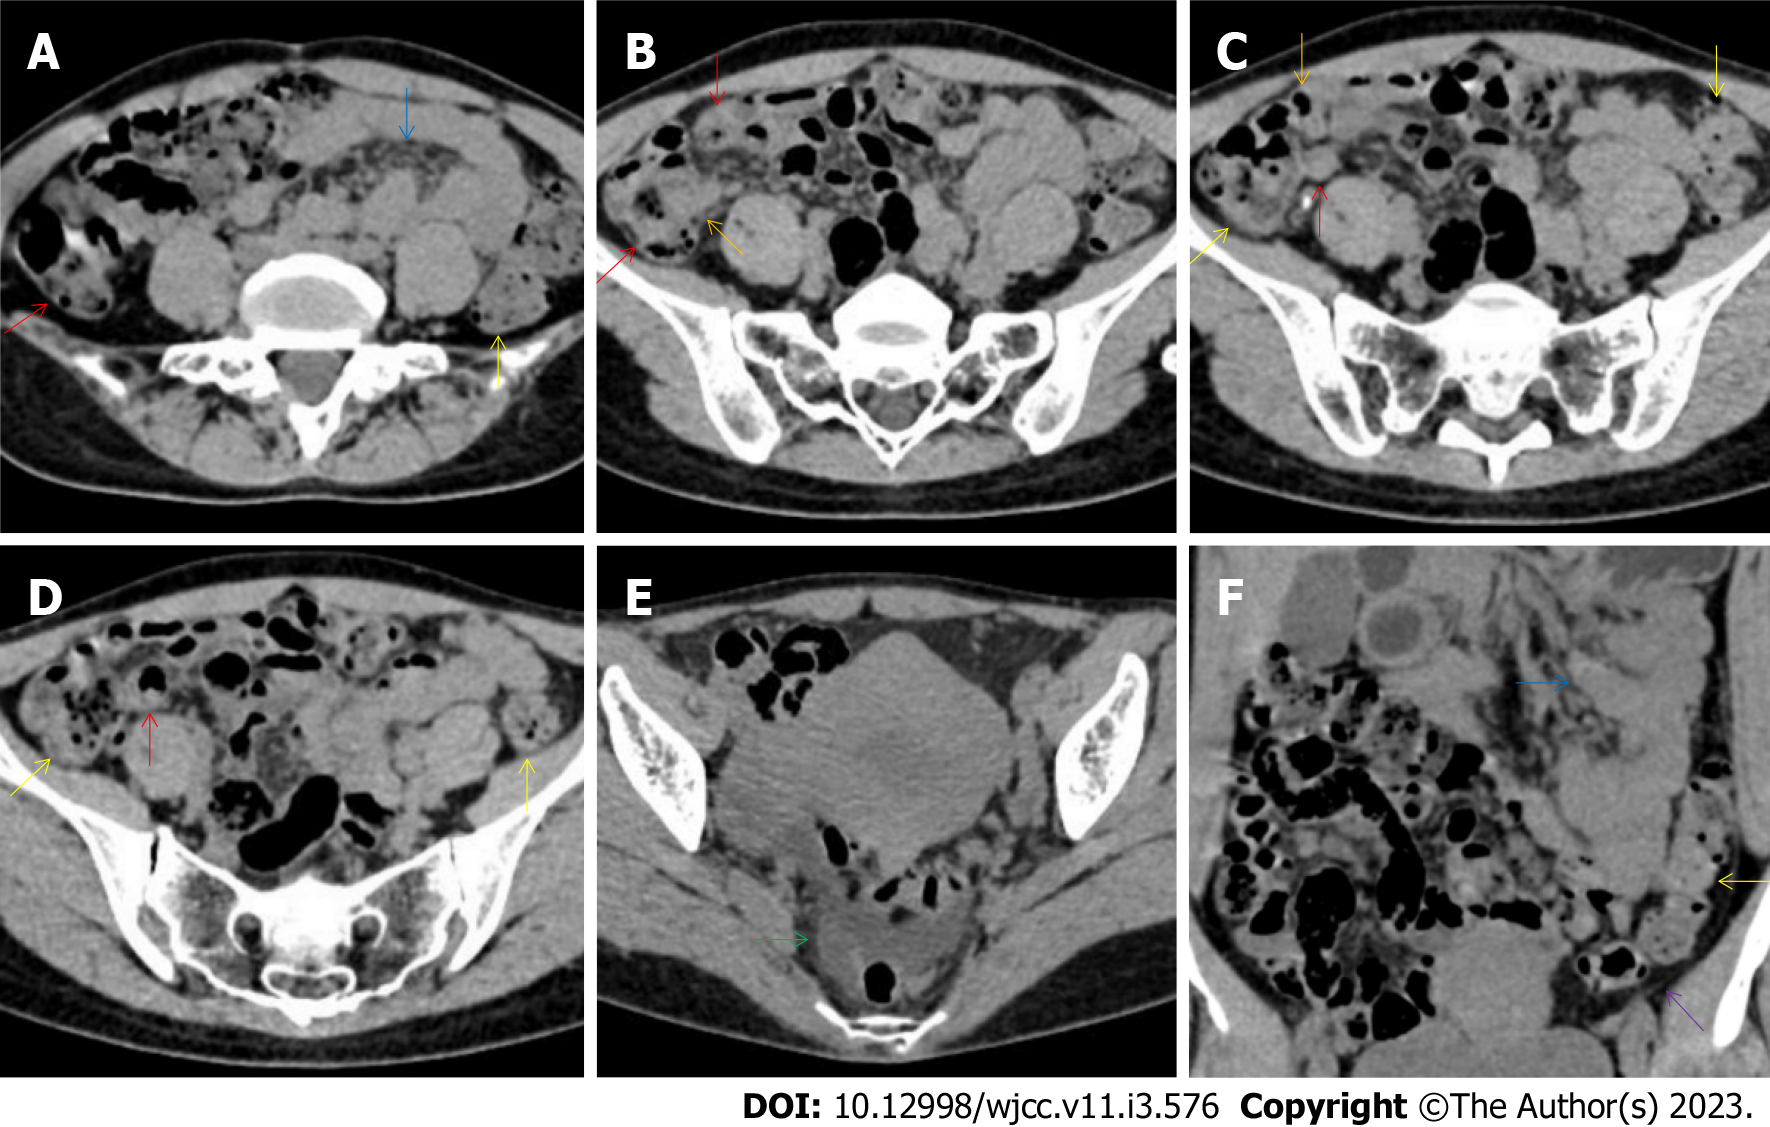
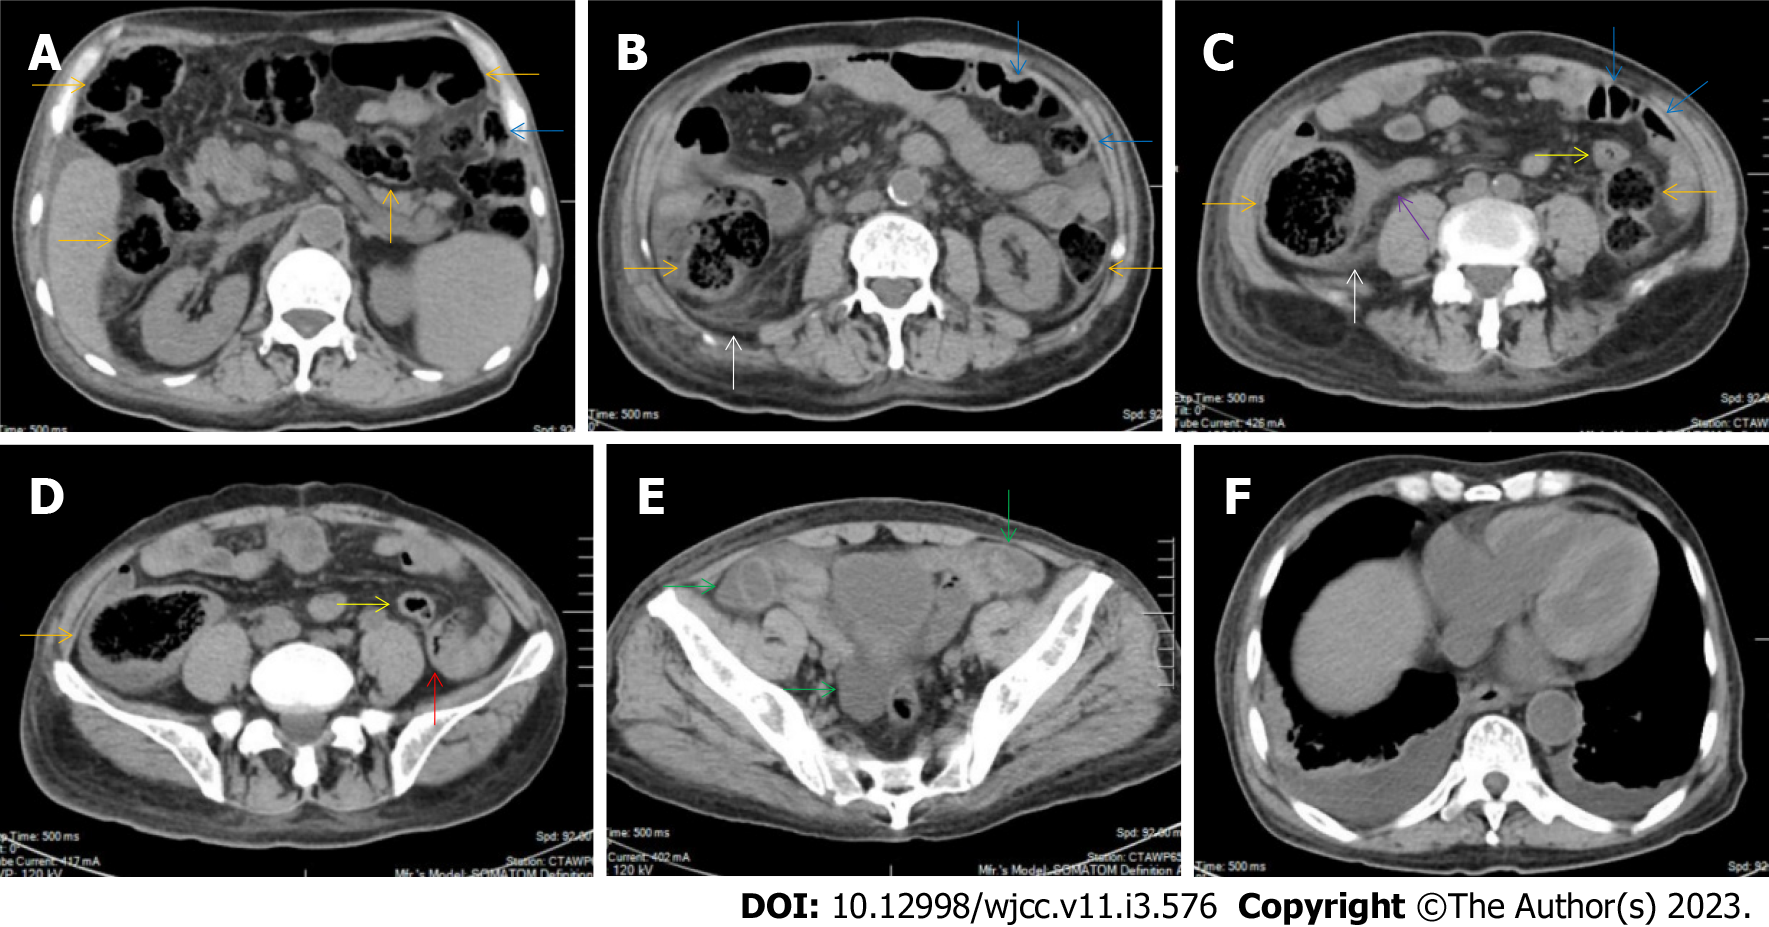
All patients demonstrated CT imaging abnormalities that suggested the presence of gut inflammatory damage in the large intestine. Colonic wall thickening with mural stratification, intramual gas and paracolonic fat stranding is the common presentation of colonic involvement of inflammatory damage. A stratified bowel wall can be caused by submucosal fat deposition (fat holo sign) or submucosal edematous tissues (water holo sign)[17-19]. The water holo sign was present in 8 patients [Figure 1 (case 4), Figure 2 (case 3), Figure 3 (case 6), Figure 4 (case 9), Figure 5 (case 15), Figure 6 (case 2), Figure 7 (case 1), and Figure 8 (case 12)], commonly accompanying intramural gas and subserosal peumatosis, which indicated the presence of aerogenous bacterial proliferation in the colonic wall irrespective of primary infection or infection secondary to dysbiotic microbiota, acute episodes or chronic damage[22,23]. The fat holo sign which suggested the existence of active chronic gut inflammation was detected in 7 patients [Figure 1 (case 4), Figure 9 (case 13), Figure 4 (case 9), Figure 10 (case 11), Figure 11 (case 17), Figure 7 (case 1), and Figure 12 (case 16)]. In these 7 patients, the fat holo sign was located in the ileocecal region and proximal ascending colon.
The “balloon sign” is characterized by circumferentially distributed clustering of hypervascular mesenteric fat proliferation wrapping a short segment of highly distended paper-thin bowel wall[33,34]. The “balloon sign” can also be seen in a large subserosal pneumatosis[35,36]. The circumferentially distributed clustering of hypervascular fat proliferation suggests the presence of an active chronic inflammatory condition in diseased intestinal segments. The balloon sign was present in 7 patients. The paper-thin bowel wall can be the wall of either the small or large intestine. In Figure 2 (case 3), the paper-thin bowel wall was present in the proximal ileum. In Figure 13 (case 14), the paper-thin bowel wall was present in the ascending colon. In Figure 11 (case 17), the paper-thin bowel wall was present in the hepatic flexure. In Figure 3 (case 6), Figure 4 (case 9), Figure 8 (case 7) and Figure 14 (case 8), the paper-thin bowel wall was present in the sigmoid colon.
The “empty colon sign” refers to a colonic segment in which any contents are absent, usually in a segmentally wall-thickened colon or following a focally wall-thickened colon. Malignant masses are the most common cause. However, inflammatory diseases can also cause empty colon signs, especially in segmental thickening of the colonic wall with edematous submucosal tissues and prominent mesenteric fat stranding[15-18]. In this study, 6 patients presented with an empty colon sign. In Figure 9 (case 13), the empty colon sign was exhibited a thickened, stratified and emptied colonic segment in the hepatic flexure, followed by the collapsed proximal transverse colon. In Figure 4 (case 9), the collapsed transverse and descending colon followed the segmentally wall-thickened colon in the hepatic flexure, and endoscopic examination later demonstrated a polypoid lesion in the diseased colonic segment. In Figure 7 (case 1), the empty colon sign was exhibited as a long segment of the thickened, stratified and emptied ascending and proximal transverse colon. In Figure 1 (case 4), Figure 2 (case 3) and Figure 5 (case 15), the empty colon sign was exhibited a segmentally thickened, stratified and emptied colon in the hepatic flexure.
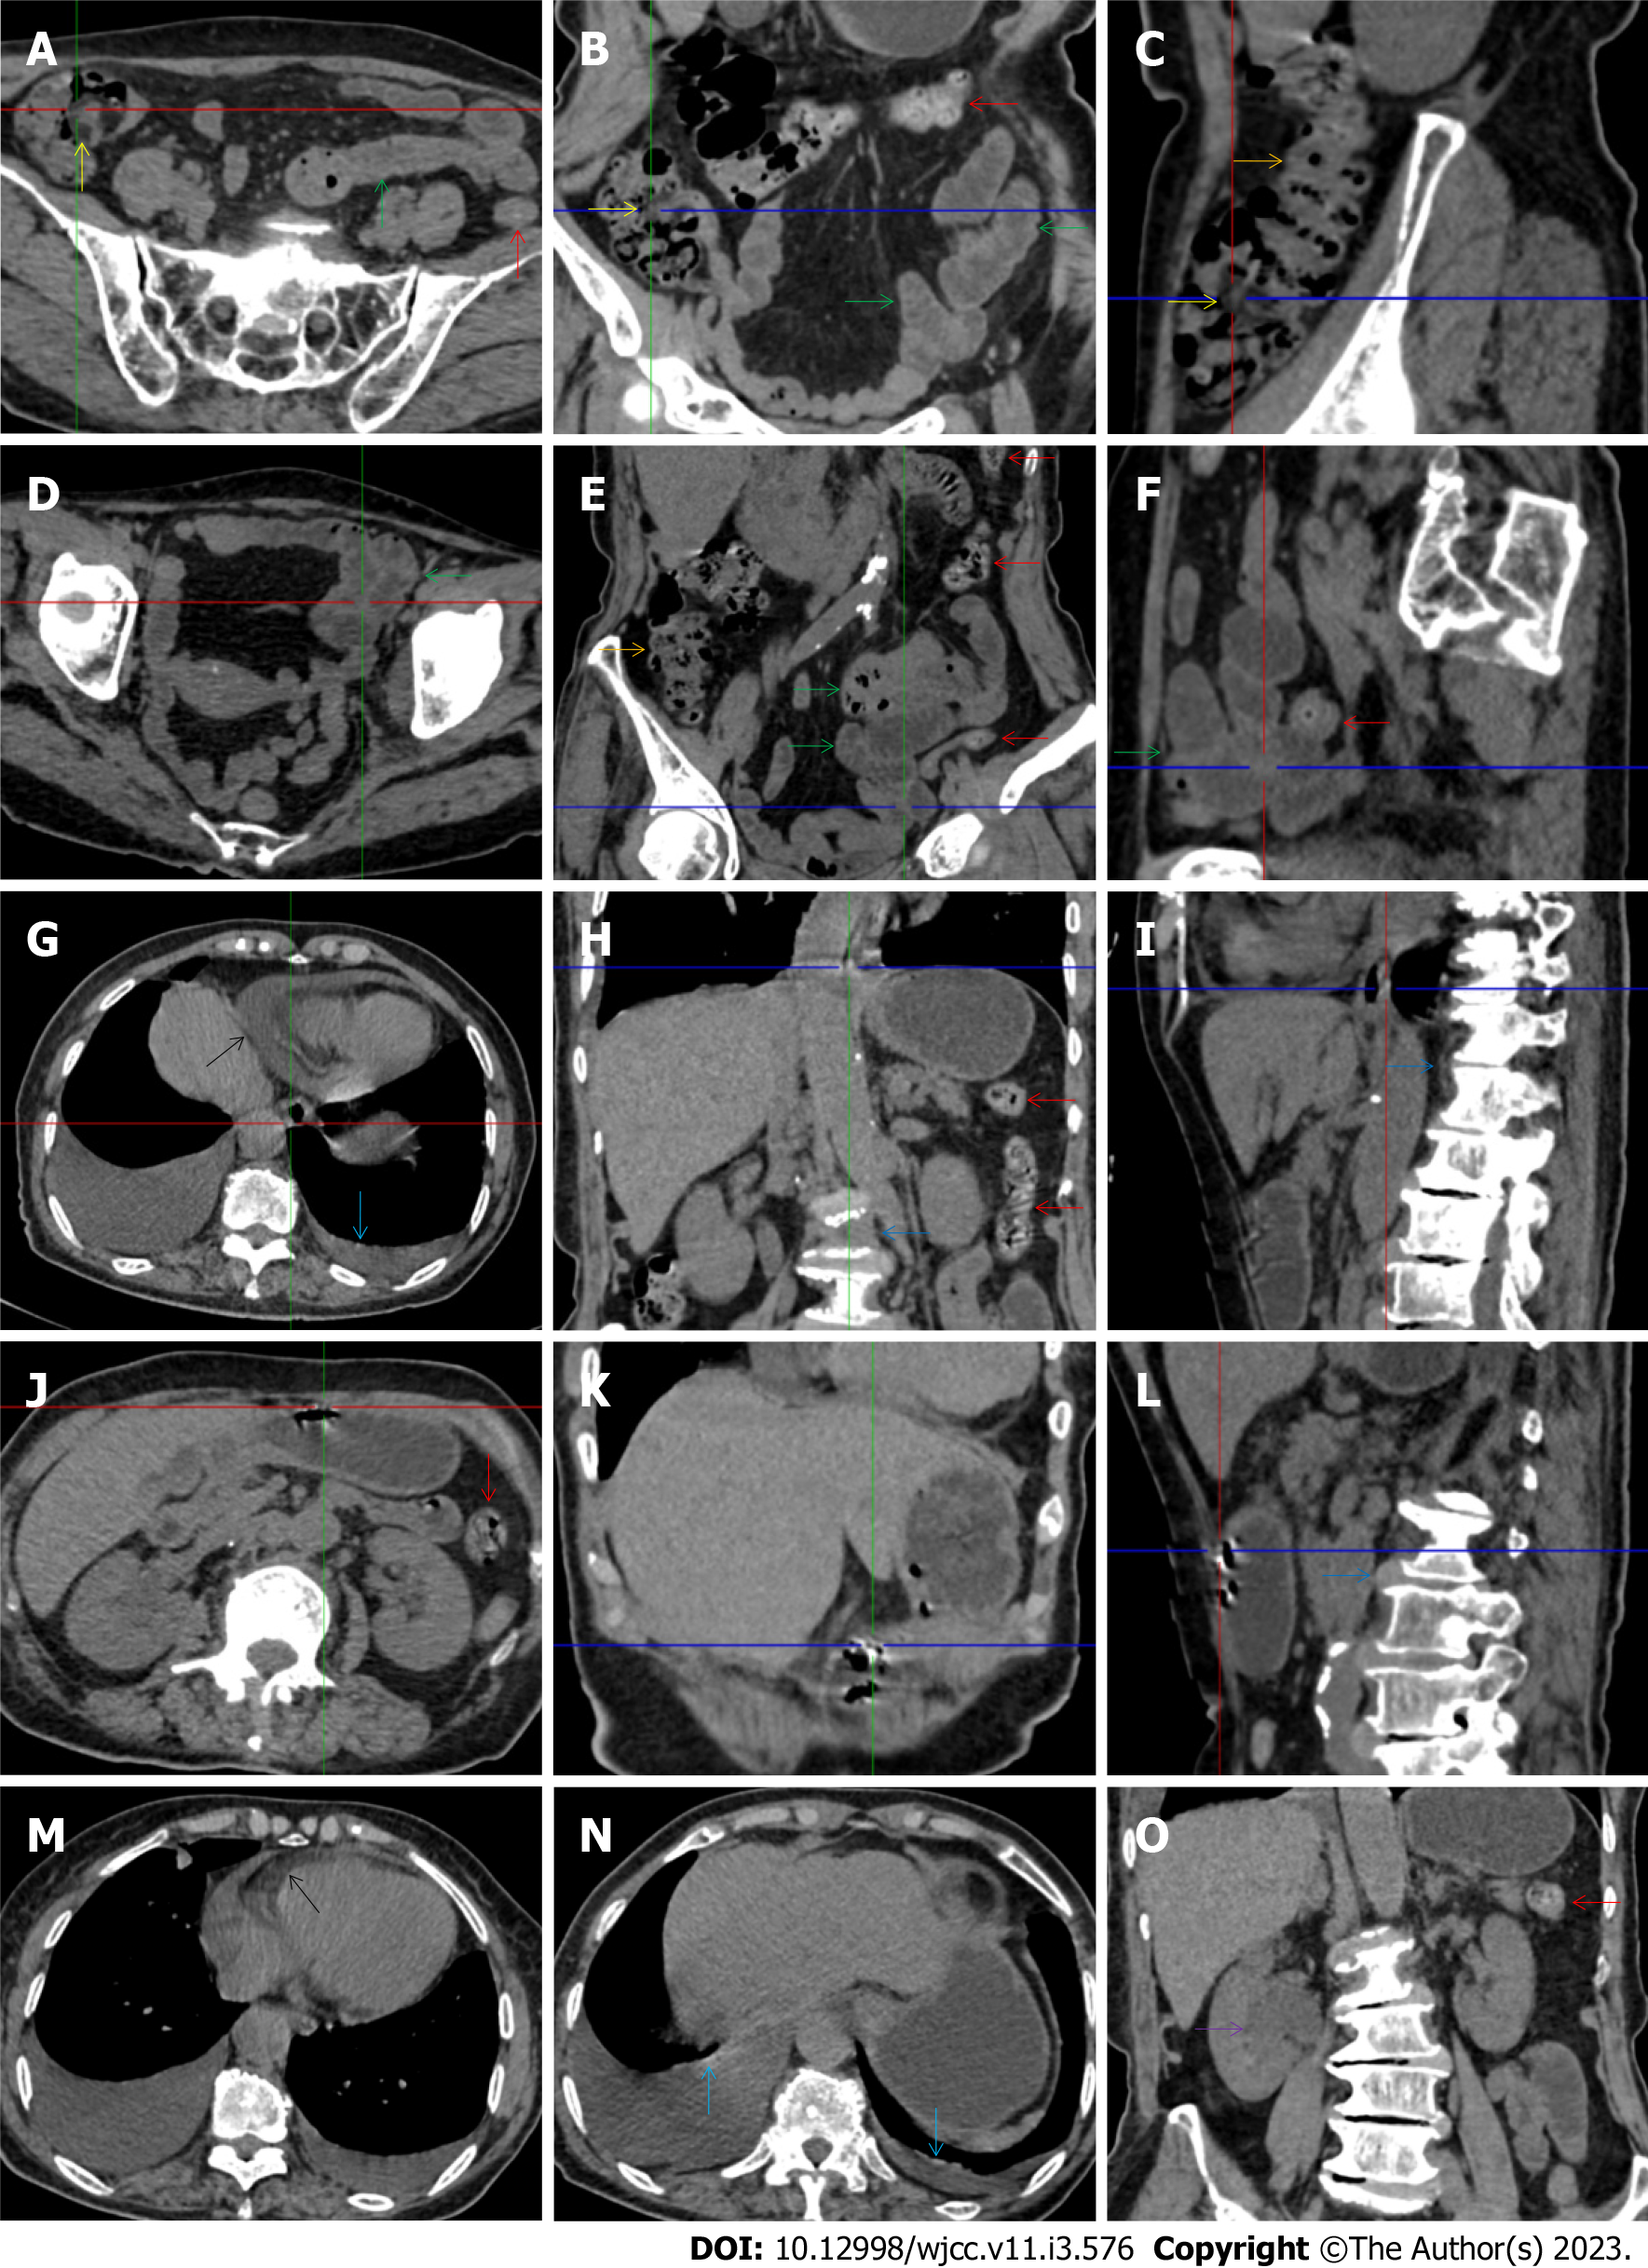
The “creeping fat sign” represents an imaging presentation in which proliferated fat deposition leads to the widening of the bowel loop[24]. The appearance of the creeping fat sign signifies the presence of chronic transmural inflammation in diseased intestinal segments[16,18,24,25]. In Figure 15 (case 10), the silt-like fat deposition led to the widening of the small bowel loop. In the ileal segment, the wall was thickened, and the lumen was dilated. In Figure 14 (case 8), similar imaging features were shared with those in Figure 15 (case 10). However, Figure 14 (case 8) presented concomitantly with infectious lesions in the pleura, indicative of the reactivation of old tuberculosis.
Diffused bowel inflammatory damage in Crohn’s disease predominantly affects the small intestine, and the ileocecal valve and large intestine are commonly involved. The “creeping fat sign” is the characteristic imaging presentation in the diagnosis of Crohn’s disease[24,25]. In Figure 15 (case 10), the “creeping fat” manifested as silt-like fat deposition. However, most patients manifested perienteric hypervascular fat proliferation wrapping the fibrotically thickened wall and dilated lumen of the ileal segment. Four patients (cases 8, 9, 12, and 14) were found to have this radiological feature. In Figure 14 (case 8), this form of creeping fat was present in the distal jejunum, whereas in the other 3 patients [Figure 15 (case 9), Figure 16 (case 12) and Figure 13 (case 14)], creeping fat was present in the ileum. They also presented with other forms of inflammatory changes in the small and large intestines.
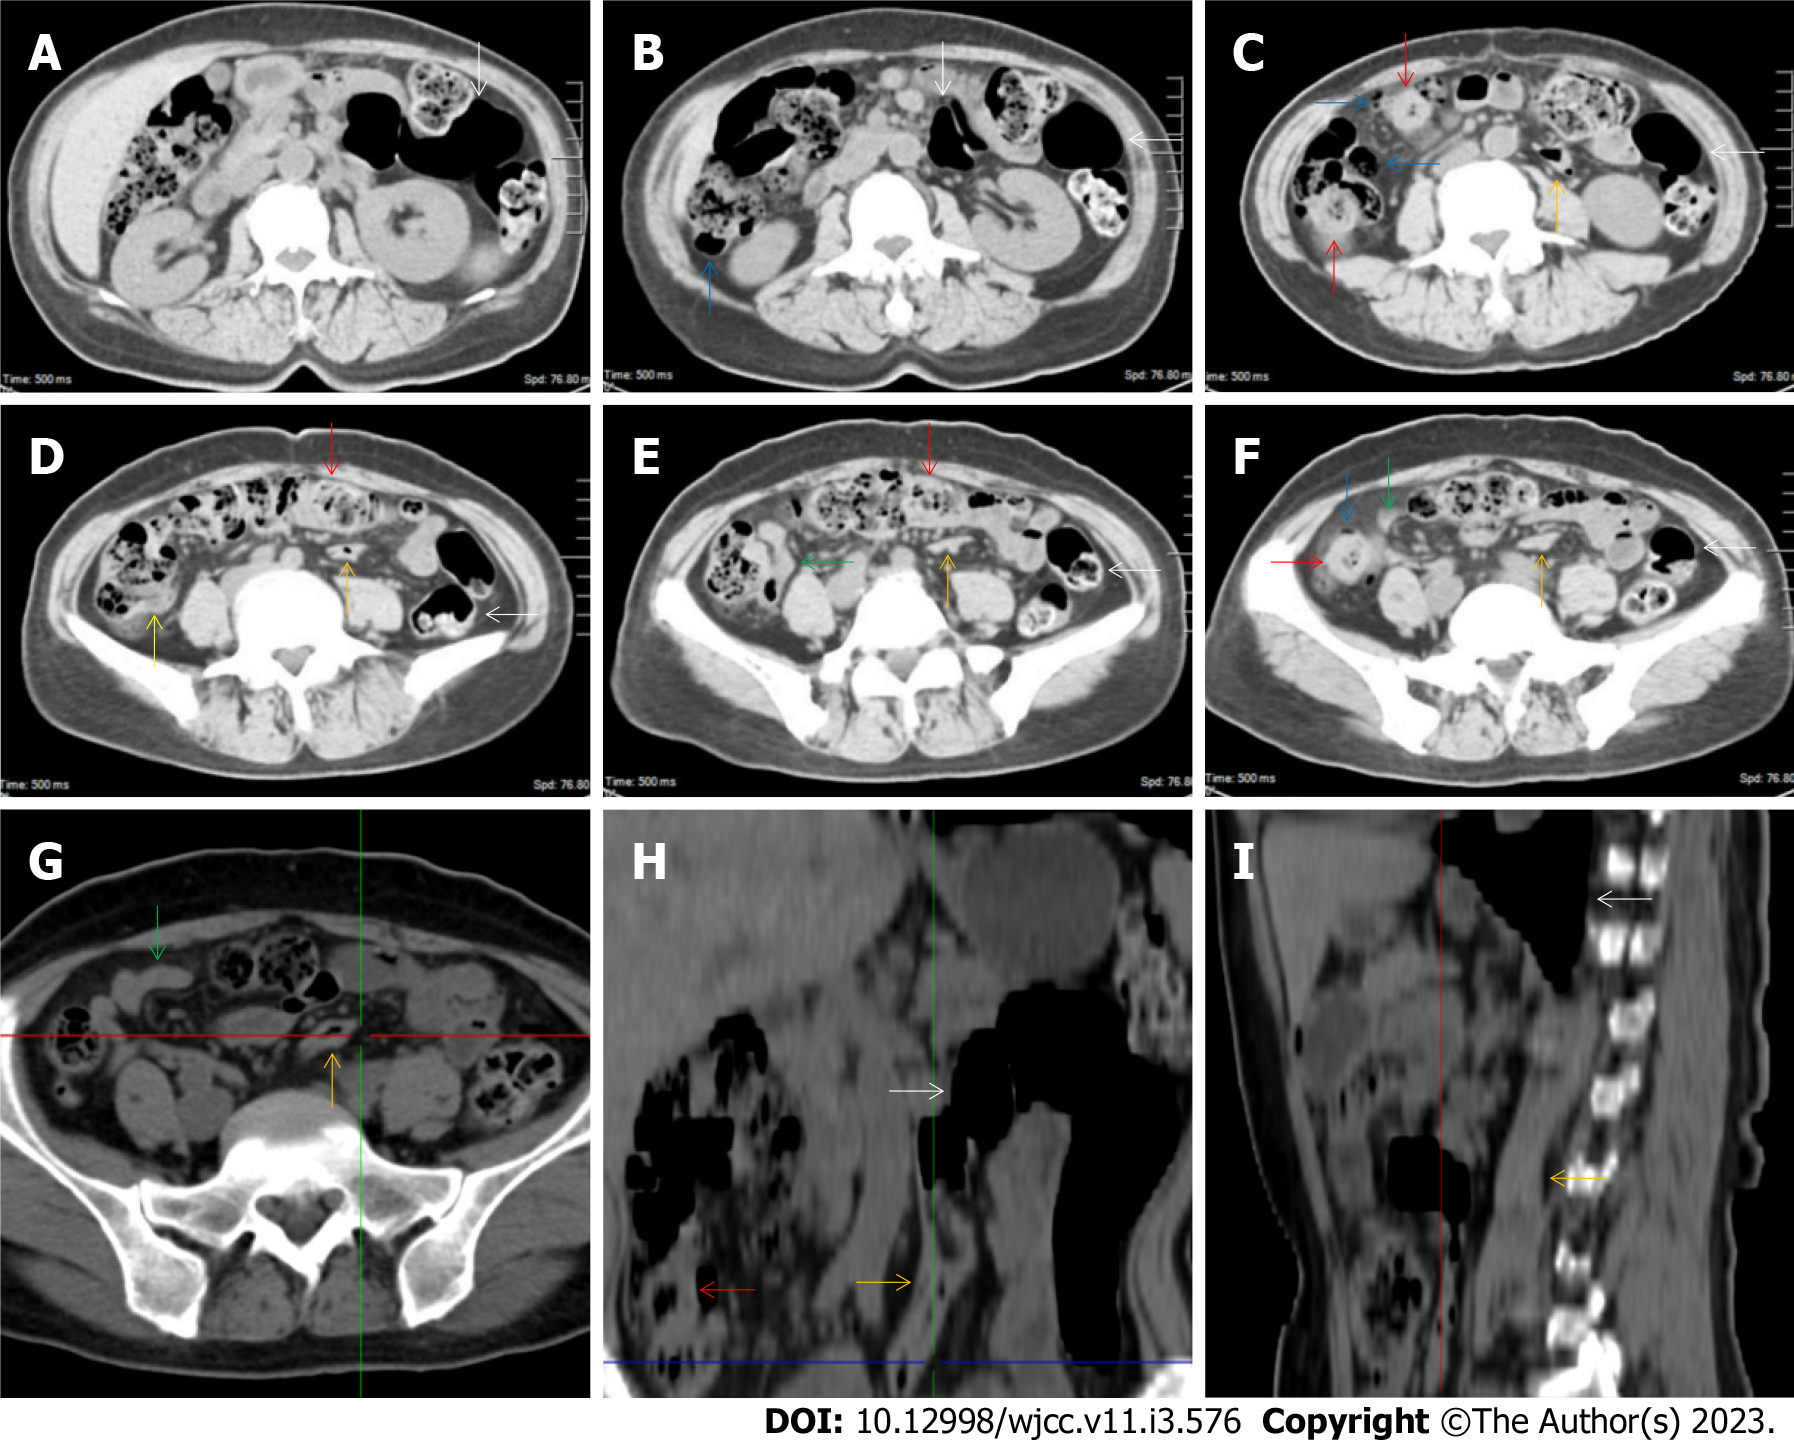
While the diffuse bowel inflammatory lesions of Crohn’s disease predominate in the small intestine, the bowel inflammatory lesions of ulcerative colitis predominate in the colon. Fibrotic thickening of the colonic wall is a common imaging presentation, usually with striking paracolonic hypervascular mesenteric fat proliferation, indicating chronic lesions in nature, different from those of acute colonic infectious diseases[15-19]. The ileocecal region and small intestine are commonly involved in various forms of inflammatory damages. These imaging features were present in Figure 17 (case 5). In addition to fibrotic thickening of the colonic wall and the dilated colonic lumen, peritoneal thickening and loculated ascites in the iliac fossa and pelvic cavity indicated peritoneal involvement of inflammatory lesions. The hypertrophic lesion in the pluera with pleural effusion suggested the presence of tuberculosis infection. These imaging features indicated that tuberculosis infection likely initiated the gut inflammatory condition in this case.
Marked irregular mucosal contour and fibrotically thickened mucosal folds of the large intestine, commonly with colonic wall thickening and subserosal pneumatosis, makes the colonic configuration rugged. This rugged colonic configuration especially with peritoneal thickening could suggest an existence of active and chronic inflammatory conditions in diseased colonic segment. It commonly occurs in the ascending colon and coexists omental involvement and pronounced paracolonic fat stranding. This easily recognized imaging presentation is highly useful in the identification of colonic inflammatory damages which is distinguishable from edematous thickening of the colonic wall with dispropositionately less severe paracolonic fat stranding in acute enterocolotis[14-18]. In patients presented with this imaging presentation, inflammatory lesions also involved other colonic segments, the ileocecal region and small intestine. The rugged configuration of the ascending colon presented in 10 patients [Figure 1 (case 4), Figure 2 (case 3), Figure 4 (case 9), Figure 5 (case 15), Figure 10 (case 11), Figure 6 (case 2), Figure 11 (case 17), Figure 7 (case 1), Figure 14 (case 8) and Figure 12 (case 16)], suggesting that it is common imaging presentations in patients with SAA, in accordance with the high prevalence of inflammatory and infectious diseases in the ileocecal region and the proximal ascending colon.
The “adhesive bowel loop” refers to a segment of small bowel that was adhered and clustered. Various bowel wall abnormalities could be present in the adhered and clustered small bowel segments. Heterogeneity in the bowel wall texture was commonly striking in the adhered small bowel segment. The lumen could be either gas-filled or liquid-filled and frequently alternated. Gas-liquid levels are frequently present in the lumen of the small bowel, indicating the presence of dynamical abnormalities. Bowel wall thickening and transmural inflammatory changes, such as mesenteric fat deposition, increased vasculature and fibrotic peritoneal thickening, were usually particularly striking in the adhered bowel segments. A segment of adhesive bowel loop with peritoneal involvement forms the so-called “abdominal cocoon”[29-32]. In this study, various abdominal cocoons, such as the “accordion sign”, “cauliflower sign” and “bottle gourd sign”, were found. An adhesive bowel loop was present in 15 patients [Figure 1 (case 4), Figure 9 (case 13), Figure 2 (case 3), Figure 3 (case 6), Figure 4 (case 9), Figure 16 (case 12), Figure 13 (case 14), Figure 5 (case 15), Figure 10 (case 11), Figure 6 (case 2), Figure 11 (case 17), Figure 7 (case 1), Figure 8 (case 7), Figure 14 (case 8), and Figure 17 (case 16)]. The high incidence of an adhesive bowel loop suggested the presence of high prevalence of chronic active bowel inflammatory damage in the small intestine in patients with SAA. In the 2 patients without an adhesive bowel loop, Figure 15 (case 10) and Figure 17 (case 5) presented with striking hypervascular mesenteric fat proliferation and a widened bowel loop (creeping fat sign), also indicating the presence of active chronic inflammatory involvement of the small intestine[24-26]. Although these inflammatory lesions in the small bowel might not serve as the major factors in the regulation of hematopoietic and immune functions, they exert an important role that affects the downstream gut microbial community and thereby affects downstream intestinal barrier function[54-56].
The ileocecal region is the most common site for various infectious and inflammatory diseases[9,10,14,16]. In this study, all patients with SAA presented with inflammatory involvement of the ileoceal region. Among them, 2 patients presented with inflammatory lesions in the ileocecal region as the predominant imaging presentation. In Figure 7 (case 1), the prominent inflammatory lesion was a large omentum-encapsulated inflammatory mass centered on the homogeneously wall-thickened appendix and extending to the scrotum along the inguinal canal. In Figure 8 (case 7), the particularly prominent inflammatory lesion was a cluster of misty fat stranding wrapping the thickened and strictured distal ileum.
Concomitant extraabdominal presentations may confer useful information for a suggestive etiopathological diagnosis. In this study, pleural involvement of hypertrophic lesions was present in 4 patients [Figure 5 (case 5), Figure 11 (case 17), Figure 14 (case 8), and Figure 12 (case 16)], strongly suggestive of tuberculosis infection. However, no tuberculotic lesions were present in their lungs. In addition to the pleural involvement, 1 patients [Figure 9 (case 13)] presented with peritoneal involvement of hypertrophic lesions, also suggesting the presence of tuberculosis infection.
Taken together, this radiological study demonstrated the gut involvement of various inflammatory changes in all patients with SAA. The inflammatory lesions concurrently affected the large intestine, ileocaecal region and small intestine. Although compromised intestinal integrity in the ileocecal region and large intestine exerts a major role in the development of hematological and immunological diseases[9-13], inflammatory damage and dysfunction in the upper gastrointestinal tract can affect the pathophysiologies of the downstream intestinal integrity[54-56] and thereby exert an indirect impact on hematological and immunological function. In susceptible individuals, active chronic gut inflammatory conditions may initiate and perpetuate hematological damage, and aggravated gut damages may induce flared episodes[4-8].
During flared episodes, the imaging features suggested the presence of chronic gut inflammatory conditions and acutely aggravated inflammatory damages. Some readily recognized imaging signs, such as bowel wall thickening with mural stratification (“water holo sign”, “fat holo sign”, intramural gas and subserosal pneumatoses) and mesenteric fat proliferation (fat stranding and “creeping fat sign”), “balloon sign”, rugged colonic configuration and adhesive bowel loop (including various patterns of abdominal cocoon), occurred at a high incidence, which suggested that the gastrointestinal tract is common inflammatory niche responsible for the systemic inflammatory stresses in patients with SAA. Successful treatment of their gut inflammatory conditions significantly improves their hematological profile[4-6], providing convincing evidence for a role of gut inflammation in hematopoietic suppression.
Although not able to provide an etiopathological diagnosis, abdominal CT can provide useful information for exploring gut inflammatory conditions and guiding further work-ups. In this study, a suggestive diagnosis of Crohn’s disease was made in 5 patients, ulcerative colitis in 1 patient, chronic periappendiceal abscess in 1 patient, and tuberculosis infection in 5 patients[57-59]. Although the presence of abdominal cocoons has been reported to have a high probability of tuberculosis infection[31,32] and there was a high incidence of abdominal cocoons present in this study, it was difficult to make a presumptive diagnosis of tuberculosis infection in patients with abdominal cocoons other than the abovementioned 5 patients.
This study had several limitations. First, although CT has some advantages in the detection of the site, extent, degree and peripheral changes of gut inflammatory damage, the exact pathogenic factors cannot be identified, and arriving at an etiopathological diagnosis frequently requires other laboratory tests. This study lacked the endoscopic, pathological and other definitive diagnostic examinations largely due to the contraindication of invasive operative procedures resulting from the very low platelet count and the platelet transfusion refractoriness of these patients. Second, the number of studied patients was quite small, leading to the incidence of each imaging sign being less representative of the actual incidence. Third, the treatment responses by suggested radiological diagnosis were not summarized.
All patients with SAA during inflammatory episodes demonstrated gut involvement of both active chronic inflammatory conditions and acute inflammatory damage, providing further evidence to demonstrate the role of GIDs in the pathogenesis of immune-mediated hematopoietic failure. Although arriving at an etiopathological diagnosis frequently requires other laboratory tests, abdominal CT imaging can provide highly useful information for the exploration of gut inflammatory damage and is very helpful for the suggestion of an effective treatment modality. In patients with aggravated cytopenia and clinical presentations suggestive of the presence of inflammatory responses, inflammatory diseases in the gastrointestinal tract should be considered, abdominal CT should be performed, and imaging signs that suggest the presence of gut inflammatory lesions should be carefully identified.
The gastrointestinal tract hosts the body’s most enriched lymphoid tissues and microbial community and therefore can provide sufficient activated immune cells and continuous intestine-derived antigens to influence the host hematopoietic and immune functions. The gastrointestinal tract is the most common site for infectious and inflammatory diseases. Morphological changes on computed tomography (CT) images can provide useful information that reflects the distribution, extent, and severity of the bowel inflammation and even suggests a pathogenic diagnosis.
Initiation and perpetuation of aplastic anemia (AA) pathogenesis has been found to be associated with gut inflammatory disorders (GIDs). GIDs have a powerful impact on hematopoietic and immune functions. Treatment of GIDs can improve hematological profile and immunological derangement.
To explore CT imaging presentations of gut inflammatory damage in adult patients with severe AA (SAA) and to provoke awareness of GIDs in the pathogenesis of hematological and autoimmune disorders.
We retrospectively evaluated the abdominal CT imaging presentations of 17 hospitalized adult patients with SAA in search of the inflammatory niche when they presented with systemic inflammatory stress and exacerbated hematopoietic function.
All eligible patients with SAA had CT imaging abnormalities that suggested the presence of an impaired intestinal barrier and increased epithelial permeability. The inflammatory damages were concurrently present in the small intestine, the ileocecal region and the large intestines.
All patients with SAA had CT imaging patterns that suggested the presence of active chronic inflammatory conditions and aggravated inflammatory damage during flared inflammatory episodes. In patients with aggravated cytopenia and clinical presentations suggestive of the presence of inflammatory responses, inflammatory diseases in the gastrointestinal tract should be considered, abdominal CT should be performed, and imaging signs that suggest the presence of gut inflammatory lesions should be carefully identified.
Abdominal CT imaging presentations in association with hematopoietic failure and autoimmune diseases warrant extensive investigations.
Provenance and peer review: Unsolicited article; Externally peer reviewed.
Peer-review model: Single blind
Specialty type: Hematology
Country/Territory of origin: China
Peer-review report’s scientific quality classification
Grade A (Excellent): 0
Grade B (Very good): B
Grade C (Good): C
Grade D (Fair): D
Grade E (Poor): 0
P-Reviewer: Ishfaq A, United States; Patel GR, India S-Editor: Chen YL L-Editor: A P-Editor: Zhao S
| 1. | Giudice V, Selleri C. Aplastic anemia: Pathophysiology. Semin Hematol. 2022;59:13-20. [RCA] [PubMed] [DOI] [Full Text] [Cited by in Crossref: 3] [Cited by in RCA: 46] [Article Influence: 15.3] [Reference Citation Analysis (0)] |
| 2. | Patel BA, Giudice V, Young NS. Immunologic effects on the haematopoietic stem cell in marrow failure. Best Pract Res Clin Haematol. 2021;34:101276. [RCA] [PubMed] [DOI] [Full Text] [Cited by in Crossref: 7] [Cited by in RCA: 28] [Article Influence: 7.0] [Reference Citation Analysis (0)] |
| 3. | Killick SB, Bown N, Cavenagh J, Dokal I, Foukaneli T, Hill A, Hillmen P, Ireland R, Kulasekararaj A, Mufti G, Snowden JA, Samarasinghe S, Wood A, Marsh JC; British Society for Standards in Haematology. Guidelines for the diagnosis and management of adult aplastic anaemia. Br J Haematol. 2016;172:187-207. [RCA] [PubMed] [DOI] [Full Text] [Cited by in Crossref: 341] [Cited by in RCA: 525] [Article Influence: 52.5] [Reference Citation Analysis (0)] |
| 4. | Zhao XC, Zhao L, Sun XY, Xu ZS, Ju B, Meng FJ, Zhao HG. Excellent response of severe aplastic anemia to treatment of gut inflammation: A case report and review of the literature. World J Clin Cases. 2020;8:425-435. [RCA] [PubMed] [DOI] [Full Text] [Full Text (PDF)] [Cited by in CrossRef: 8] [Cited by in RCA: 12] [Article Influence: 2.4] [Reference Citation Analysis (0)] |
| 5. | Salmeron G, Patey N, de Latour RP, Raffoux E, Gluckman E, Brousse N, Socié G, Robin M. Coeliac disease and aplastic anaemia: a specific entity? Br J Haematol. 2009;146:122-124. [RCA] [PubMed] [DOI] [Full Text] [Cited by in Crossref: 11] [Cited by in RCA: 18] [Article Influence: 1.1] [Reference Citation Analysis (1)] |
| 6. | Tokar B, Aydoğdu S, Paşaoğlu O, Ilhan H, Kasapoğlu E. Neutropenic enterocolitis: is it possible to break vicious circle between neutropenia and the bowel wall inflammation by surgery? Int J Colorectal Dis. 2003;18:455-458. [RCA] [PubMed] [DOI] [Full Text] [Cited by in Crossref: 6] [Cited by in RCA: 10] [Article Influence: 0.5] [Reference Citation Analysis (0)] |
| 7. | Espinoza JL, Elbadry MI, Nakao S. An altered gut microbiota may trigger autoimmune-mediated acquired bone marrow failure syndromes. Clin Immunol. 2016;171:62-64. [RCA] [PubMed] [DOI] [Full Text] [Cited by in Crossref: 12] [Cited by in RCA: 18] [Article Influence: 2.0] [Reference Citation Analysis (0)] |
| 8. | Zhao XC, Sun XY, Zhao L, Meng FJ. Gut inflammation in the pathogenesis of acquired aplastic anemia. Chin Med J (Engl). 2020;133:1878-1881. [RCA] [PubMed] [DOI] [Full Text] [Full Text (PDF)] [Cited by in RCA: 6] [Reference Citation Analysis (1)] |
| 9. | Shen L. Functional morphology of the gastrointestinal tract. Curr Top Microbiol Immunol. 2009;337:1-35. [RCA] [PubMed] [DOI] [Full Text] [Cited by in Crossref: 13] [Cited by in RCA: 25] [Article Influence: 1.7] [Reference Citation Analysis (0)] |
| 10. | Guven-Maiorov E, Tsai CJ, Nussinov R. Structural host-microbiota interaction networks. PLoS Comput Biol. 2017;13:e1005579. [RCA] [PubMed] [DOI] [Full Text] [Full Text (PDF)] [Cited by in Crossref: 49] [Cited by in RCA: 40] [Article Influence: 5.0] [Reference Citation Analysis (0)] |
| 11. | Fasano A. All disease begins in the (leaky) gut: role of zonulin-mediated gut permeability in the pathogenesis of some chronic inflammatory diseases. F1000Res. 2020;9. [RCA] [PubMed] [DOI] [Full Text] [Full Text (PDF)] [Cited by in Crossref: 103] [Cited by in RCA: 274] [Article Influence: 54.8] [Reference Citation Analysis (1)] |
| 12. | Mu Q, Kirby J, Reilly CM, Luo XM. Leaky Gut As a Danger Signal for Autoimmune Diseases. Front Immunol. 2017;8:598. [RCA] [PubMed] [DOI] [Full Text] [Full Text (PDF)] [Cited by in Crossref: 266] [Cited by in RCA: 381] [Article Influence: 47.6] [Reference Citation Analysis (0)] |
| 13. | Vogelzang A, Guerrini MM, Minato N, Fagarasan S. Microbiota - an amplifier of autoimmunity. Curr Opin Immunol. 2018;55:15-21. [RCA] [PubMed] [DOI] [Full Text] [Cited by in Crossref: 19] [Cited by in RCA: 24] [Article Influence: 3.4] [Reference Citation Analysis (0)] |
| 14. | Duffin C, Mirpour S, Catanzano T, Moore C. Radiologic Imaging of Bowel Infections. Semin Ultrasound CT MR. 2020;41:33-45. [RCA] [PubMed] [DOI] [Full Text] [Cited by in Crossref: 4] [Cited by in RCA: 8] [Article Influence: 1.3] [Reference Citation Analysis (0)] |
| 15. | Yu SJ, Heo JH, Choi EJ, Kim JH, Lee HS, Kim SY, Lim JH. Role of multidetector computed tomography in patients with acute infectious colitis. World J Clin Cases. 2022;10:3686-3697. [RCA] [PubMed] [DOI] [Full Text] [Full Text (PDF)] [Cited by in CrossRef: 1] [Cited by in RCA: 1] [Article Influence: 0.3] [Reference Citation Analysis (2)] |
| 16. | Hines JJ Jr, Mikhitarian MA, Patel R, Choy A. Spectrum and Relevance of Incidental Bowel Findings on Computed Tomography. Radiol Clin North Am. 2021;59:647-660. [RCA] [PubMed] [DOI] [Full Text] [Reference Citation Analysis (0)] |
| 17. | Fernandes T, Oliveira MI, Castro R, Araújo B, Viamonte B, Cunha R. Bowel wall thickening at CT: simplifying the diagnosis. Insights Imaging. 2014;5:195-208. [RCA] [PubMed] [DOI] [Full Text] [Full Text (PDF)] [Cited by in Crossref: 62] [Cited by in RCA: 84] [Article Influence: 7.6] [Reference Citation Analysis (0)] |
| 18. | Mills A, Mellnick VM, Itani M. Imaging of Bowel Wall Thickening in the Hospitalized Patient. Radiol Clin North Am. 2020;58:1-17. [RCA] [PubMed] [DOI] [Full Text] [Cited by in Crossref: 1] [Cited by in RCA: 1] [Article Influence: 0.2] [Reference Citation Analysis (0)] |
| 19. | Agarwala R, Singh AK, Shah J, Mandavdhare HS, Sharma V. Ileocecal thickening: Clinical approach to a common problem. JGH Open. 2019;3:456-463. [RCA] [PubMed] [DOI] [Full Text] [Full Text (PDF)] [Cited by in Crossref: 11] [Cited by in RCA: 4] [Article Influence: 0.7] [Reference Citation Analysis (0)] |
| 20. | Marín-Díez E, Crespo Del Pozo J. Diagnostic approach to small-bowel wall thickening: beyond Crohn's disease and cancer. Radiologia (Engl Ed). 2021;. [RCA] [PubMed] [DOI] [Full Text] [Cited by in Crossref: 1] [Reference Citation Analysis (0)] |
| 21. | Wang X, Yuan M, Mi H, Suo S, Eteer K, Li S, Lu Q, Xu J, Hu J. The feasibility of differentiating colorectal cancer from normal and inflammatory thickening colon wall using CT texture analysis. Sci Rep. 2020;10:6346. [RCA] [PubMed] [DOI] [Full Text] [Full Text (PDF)] [Cited by in Crossref: 3] [Cited by in RCA: 3] [Article Influence: 0.6] [Reference Citation Analysis (0)] |
| 22. | Thornton E, Mendiratta-Lala M, Siewert B, Eisenberg RL. Patterns of fat stranding. AJR Am J Roentgenol. 2011;197:W1-14. [RCA] [PubMed] [DOI] [Full Text] [Cited by in Crossref: 42] [Cited by in RCA: 45] [Article Influence: 3.2] [Reference Citation Analysis (0)] |
| 23. | Pereira JM, Sirlin CB, Pinto PS, Jeffrey RB, Stella DL, Casola G. Disproportionate fat stranding: a helpful CT sign in patients with acute abdominal pain. Radiographics. 2004;24:703-715. [RCA] [PubMed] [DOI] [Full Text] [Cited by in Crossref: 133] [Cited by in RCA: 124] [Article Influence: 5.9] [Reference Citation Analysis (0)] |
| 24. | Xiong S, Tan J, Wang Y, He J, Hu F, Wu X, Liu Z, Lin S, Li X, Chen Z, Mao R. Fibrosis in fat: From other diseases to Crohn's disease. Front Immunol. 2022;13:935275. [RCA] [PubMed] [DOI] [Full Text] [Full Text (PDF)] [Cited by in RCA: 9] [Reference Citation Analysis (0)] |
| 25. | Suau R, Pardina E, Domènech E, Lorén V, Manyé J. The Complex Relationship Between Microbiota, Immune Response and Creeping Fat in Crohn's Disease. J Crohns Colitis. 2022;16:472-489. [RCA] [PubMed] [DOI] [Full Text] [Cited by in Crossref: 9] [Cited by in RCA: 31] [Article Influence: 10.3] [Reference Citation Analysis (1)] |
| 26. | Ha CWY, Martin A, Sepich-Poore GD, Shi B, Wang Y, Gouin K, Humphrey G, Sanders K, Ratnayake Y, Chan KSL, Hendrick G, Caldera JR, Arias C, Moskowitz JE, Ho Sui SJ, Yang S, Underhill D, Brady MJ, Knott S, Kaihara K, Steinbaugh MJ, Li H, McGovern DPB, Knight R, Fleshner P, Devkota S. Translocation of Viable Gut Microbiota to Mesenteric Adipose Drives Formation of Creeping Fat in Humans. Cell. 2020;183:666-683.e17. [RCA] [PubMed] [DOI] [Full Text] [Full Text (PDF)] [Cited by in Crossref: 178] [Cited by in RCA: 280] [Article Influence: 56.0] [Reference Citation Analysis (1)] |
| 27. | Knox C, Almeida J. The Comb Sign. Clin Gastroenterol Hepatol. 2021;19:A29-A30. [RCA] [PubMed] [DOI] [Full Text] [Cited by in Crossref: 1] [Cited by in RCA: 1] [Article Influence: 0.3] [Reference Citation Analysis (0)] |
| 28. | Ueda Y, Yanagi H. The comb sign in a patient with Crohn's disease. J Gen Fam Med. 2022;23:120-121. [RCA] [PubMed] [DOI] [Full Text] [Full Text (PDF)] [Cited by in Crossref: 1] [Reference Citation Analysis (0)] |
| 29. | Basara Akin I, Altay C, Celik A, Secil M. Computed Tomography Features of Encapsulating Peritoneal Sclerosis. Can Assoc Radiol J. 2019;70:233-238. [RCA] [PubMed] [DOI] [Full Text] [Cited by in Crossref: 2] [Cited by in RCA: 2] [Article Influence: 0.3] [Reference Citation Analysis (0)] |
| 30. | Ethiraj D, Indiran V. Abdominal Cocoon: "Cauliflower Sign" on Contrast-Enhanced Computed Tomography Scan. GE Port J Gastroenterol. 2020;28:76-77. [RCA] [PubMed] [DOI] [Full Text] [Cited by in Crossref: 2] [Cited by in RCA: 6] [Article Influence: 1.5] [Reference Citation Analysis (0)] |
| 31. | Gorsi U, Gupta P, Mandavdhare HS, Singh H, Dutta U, Sharma V. The use of computed tomography in the diagnosis of abdominal cocoon. Clin Imaging. 2018;50:171-174. [RCA] [PubMed] [DOI] [Full Text] [Cited by in Crossref: 16] [Cited by in RCA: 16] [Article Influence: 2.3] [Reference Citation Analysis (0)] |
| 32. | Sharma V, Singh H, Mandavdhare HS. Tubercular Abdominal Cocoon: Systematic Review of an Uncommon Form of Tuberculosis. Surg Infect (Larchmt). 2017;18:736-741. [RCA] [PubMed] [DOI] [Full Text] [Cited by in Crossref: 30] [Cited by in RCA: 25] [Article Influence: 3.1] [Reference Citation Analysis (0)] |
| 33. | Ling J, Dyer RB. The "hot air balloon" sign. Abdom Radiol (NY). 2019;44:2663-2664. [RCA] [PubMed] [DOI] [Full Text] [Reference Citation Analysis (0)] |
| 34. | LoVerde ZJ, Dyer RB. "Lâcher de ballons" or "release of balloons" sign. Abdom Radiol (NY). 2018;43:2208-2209. [RCA] [PubMed] [DOI] [Full Text] [Reference Citation Analysis (0)] |
| 35. | Rodríguez-Otero Luppi C, Rodríguez Blanco M, Bollo Rodríguez J, Méndez A, Merlo Más J. Laparoscopic resection of a giant colonic diverticulum - the 'lifting balloon' sign - a video vignette. Colorectal Dis. 2019;21:1096-1098. [RCA] [PubMed] [DOI] [Full Text] [Cited by in Crossref: 2] [Cited by in RCA: 2] [Article Influence: 0.3] [Reference Citation Analysis (0)] |
| 36. | Heylen CE, Pringot J, Van Belle K. The Lifting Balloon: Sign of a Giant Colonic Diverticulum. J Belg Soc Radiol. 2017;101:26. [RCA] [PubMed] [DOI] [Full Text] [Full Text (PDF)] [Cited by in Crossref: 3] [Cited by in RCA: 8] [Article Influence: 1.0] [Reference Citation Analysis (0)] |
| 37. | Wang J, Erlacher M, Fernandez-Orth J. The role of inflammation in hematopoiesis and bone marrow failure: What can we learn from mouse models? Front Immunol. 2022;13:951937. [RCA] [PubMed] [DOI] [Full Text] [Full Text (PDF)] [Cited by in RCA: 22] [Reference Citation Analysis (0)] |
| 38. | Espinoza JL, Kotecha R, Nakao S. Microbe-Induced Inflammatory Signals Triggering Acquired Bone Marrow Failure Syndromes. Front Immunol. 2017;8:186. [RCA] [PubMed] [DOI] [Full Text] [Full Text (PDF)] [Cited by in Crossref: 9] [Cited by in RCA: 14] [Article Influence: 1.8] [Reference Citation Analysis (0)] |
| 39. | Boiko JR, Borghesi L. Hematopoiesis sculpted by pathogens: Toll-like receptors and inflammatory mediators directly activate stem cells. Cytokine. 2012;57:1-8. [RCA] [PubMed] [DOI] [Full Text] [Cited by in Crossref: 64] [Cited by in RCA: 66] [Article Influence: 5.1] [Reference Citation Analysis (0)] |
| 40. | Chiba Y, Mizoguchi I, Hasegawa H, Ohashi M, Orii N, Nagai T, Sugahara M, Miyamoto Y, Xu M, Owaki T, Yoshimoto T. Regulation of myelopoiesis by proinflammatory cytokines in infectious diseases. Cell Mol Life Sci. 2018;75:1363-1376. [RCA] [PubMed] [DOI] [Full Text] [Cited by in Crossref: 63] [Cited by in RCA: 67] [Article Influence: 9.6] [Reference Citation Analysis (0)] |
| 41. | Esplin BL, Shimazu T, Welner RS, Garrett KP, Nie L, Zhang Q, Humphrey MB, Yang Q, Borghesi LA, Kincade PW. Chronic exposure to a TLR ligand injures hematopoietic stem cells. J Immunol. 2011;186:5367-5375. [RCA] [PubMed] [DOI] [Full Text] [Full Text (PDF)] [Cited by in Crossref: 289] [Cited by in RCA: 269] [Article Influence: 19.2] [Reference Citation Analysis (0)] |
| 42. | MacNamara KC, Racine R, Chatterjee M, Borjesson D, Winslow GM. Diminished hematopoietic activity associated with alterations in innate and adaptive immunity in a mouse model of human monocytic ehrlichiosis. Infect Immun. 2009;77:4061-4069. [RCA] [PubMed] [DOI] [Full Text] [Cited by in Crossref: 43] [Cited by in RCA: 48] [Article Influence: 3.0] [Reference Citation Analysis (0)] |
| 43. | Rodriguez S, Chora A, Goumnerov B, Mumaw C, Goebel WS, Fernandez L, Baydoun H, HogenEsch H, Dombkowski DM, Karlewicz CA, Rice S, Rahme LG, Carlesso N. Dysfunctional expansion of hematopoietic stem cells and block of myeloid differentiation in lethal sepsis. Blood. 2009;114:4064-4076. [RCA] [PubMed] [DOI] [Full Text] [Cited by in Crossref: 118] [Cited by in RCA: 113] [Article Influence: 7.1] [Reference Citation Analysis (0)] |
| 44. | Maratheftis CI, Andreakos E, Moutsopoulos HM, Voulgarelis M. Toll-like receptor-4 is up-regulated in hematopoietic progenitor cells and contributes to increased apoptosis in myelodysplastic syndromes. Clin Cancer Res. 2007;13:1154-1160. [RCA] [PubMed] [DOI] [Full Text] [Cited by in Crossref: 102] [Cited by in RCA: 127] [Article Influence: 7.1] [Reference Citation Analysis (0)] |
| 45. | Giudice V, Feng X, Lin Z, Hu W, Zhang F, Qiao W, Ibanez MDPF, Rios O, Young NS. Deep sequencing and flow cytometric characterization of expanded effector memory CD8(+)CD57(+) T cells frequently reveals T-cell receptor Vβ oligoclonality and CDR3 homology in acquired aplastic anemia. Haematologica. 2018;103:759-769. [RCA] [PubMed] [DOI] [Full Text] [Full Text (PDF)] [Cited by in Crossref: 35] [Cited by in RCA: 73] [Article Influence: 10.4] [Reference Citation Analysis (0)] |
| 46. | Chaturvedi CP, Tripathy NK, Minocha E, Sharma A, Rahman K, Nityanand S. Altered Expression of Hematopoiesis Regulatory Molecules in Lipopolysaccharide-Induced Bone Marrow Mesenchymal Stem Cells of Patients with Aplastic Anemia. Stem Cells Int. 2018;2018:6901761. [RCA] [PubMed] [DOI] [Full Text] [Full Text (PDF)] [Cited by in Crossref: 5] [Cited by in RCA: 11] [Article Influence: 1.6] [Reference Citation Analysis (0)] |
| 47. | Adolph TE, Zhang J. Diet fuelling inflammatory bowel diseases: preclinical and clinical concepts. Gut. 2022;71:2574-2586. [RCA] [PubMed] [DOI] [Full Text] [Full Text (PDF)] [Cited by in Crossref: 75] [Cited by in RCA: 79] [Article Influence: 26.3] [Reference Citation Analysis (0)] |
| 48. | Sugihara K, Kamada N. Diet-Microbiota Interactions in Inflammatory Bowel Disease. Nutrients. 2021;13. [RCA] [PubMed] [DOI] [Full Text] [Full Text (PDF)] [Cited by in Crossref: 45] [Cited by in RCA: 58] [Article Influence: 14.5] [Reference Citation Analysis (0)] |
| 49. | Zhang P. Influence of Foods and Nutrition on the Gut Microbiome and Implications for Intestinal Health. Int J Mol Sci. 2022;23. [RCA] [PubMed] [DOI] [Full Text] [Full Text (PDF)] [Cited by in RCA: 152] [Reference Citation Analysis (0)] |
| 50. | Mamieva Z, Poluektova E, Svistushkin V, Sobolev V, Shifrin O, Guarner F, Ivashkin V. Antibiotics, gut microbiota, and irritable bowel syndrome: What are the relations? World J Gastroenterol. 2022;28:1204-1219. [RCA] [PubMed] [DOI] [Full Text] [Full Text (PDF)] [Cited by in CrossRef: 11] [Cited by in RCA: 33] [Article Influence: 11.0] [Reference Citation Analysis (6)] |
| 51. | Gobbo MM, Bomfim MB, Alves WY, Oliveira KC, Corsetti PP, de Almeida LA. Antibiotic-induced gut dysbiosis and autoimmune disease: A systematic review of preclinical studies. Autoimmun Rev. 2022;21:103140. [RCA] [PubMed] [DOI] [Full Text] [Cited by in RCA: 9] [Reference Citation Analysis (0)] |
| 52. | Black J, Sweeney L, Yuan Y, Singh H, Norton C, Czuber-Dochan W. Systematic review: the role of psychological stress in inflammatory bowel disease. Aliment Pharmacol Ther. 2022;56:1235-1249. [RCA] [PubMed] [DOI] [Full Text] [Full Text (PDF)] [Cited by in Crossref: 1] [Cited by in RCA: 30] [Article Influence: 10.0] [Reference Citation Analysis (0)] |
| 53. | Bonaz B. Anti-inflammatory effects of vagal nerve stimulation with a special attention to intestinal barrier dysfunction. Neurogastroenterol Motil. 2022;34:e14456. [RCA] [PubMed] [DOI] [Full Text] [Full Text (PDF)] [Cited by in Crossref: 2] [Cited by in RCA: 40] [Article Influence: 13.3] [Reference Citation Analysis (0)] |
| 54. | Fakharian F, Asgari B, Nabavi-Rad A, Sadeghi A, Soleimani N, Yadegar A, Zali MR. The interplay between Helicobacter pylori and the gut microbiota: An emerging driver influencing the immune system homeostasis and gastric carcinogenesis. Front Cell Infect Microbiol. 2022;12:953718. [RCA] [PubMed] [DOI] [Full Text] [Full Text (PDF)] [Cited by in Crossref: 37] [Cited by in RCA: 40] [Article Influence: 13.3] [Reference Citation Analysis (0)] |
| 55. | Peng W, Zhao X, Li X. Helicobacter bilis Contributes to the Occurrence of Inflammatory Bowel Disease by Inducing Host Immune Disorders. Biomed Res Int. 2022;2022:1837850. [RCA] [PubMed] [DOI] [Full Text] [Full Text (PDF)] [Reference Citation Analysis (0)] |
| 56. | Qi Y, Zang SQ, Wei J, Yu HC, Yang Z, Wu HM, Kang Y, Tao H, Yang MF, Jin L, Zen K, Wang FY. High-throughput sequencing provides insights into oral microbiota dysbiosis in association with inflammatory bowel disease. Genomics. 2021;113:664-676. [RCA] [PubMed] [DOI] [Full Text] [Cited by in Crossref: 20] [Cited by in RCA: 49] [Article Influence: 9.8] [Reference Citation Analysis (0)] |
| 57. | Eraksoy H. Gastrointestinal and Abdominal Tuberculosis. Gastroenterol Clin North Am. 2021;50:341-360. [RCA] [PubMed] [DOI] [Full Text] [Cited by in Crossref: 8] [Cited by in RCA: 30] [Article Influence: 7.5] [Reference Citation Analysis (0)] |
| 58. | Gupta P, Kumar S, Sharma V, Mandavdhare H, Dhaka N, Sinha SK, Dutta U, Kochhar R. Common and uncommon imaging features of abdominal tuberculosis. J Med Imaging Radiat Oncol. 2019;63:329-339. [RCA] [PubMed] [DOI] [Full Text] [Cited by in Crossref: 43] [Cited by in RCA: 34] [Article Influence: 5.7] [Reference Citation Analysis (0)] |
| 59. | Deshpande SS, Joshi AR, Deshpande SS, Phajlani SA. Computed tomographic features of abdominal tuberculosis: unmask the impersonator! Abdom Radiol (NY). 2019;44:11-21. [RCA] [PubMed] [DOI] [Full Text] [Cited by in Crossref: 9] [Cited by in RCA: 17] [Article Influence: 2.8] [Reference Citation Analysis (0)] |


