Published online Dec 6, 2022. doi: 10.12998/wjcc.v10.i34.12594
Peer-review started: September 12, 2022
First decision: September 27, 2022
Revised: September 29, 2022
Accepted: November 8, 2022
Article in press: November 8, 2022
Published online: December 6, 2022
Processing time: 81 Days and 1.7 Hours
Neurovascular compression (NVC) is the main cause of primary trigeminal neuralgia (TN) and hemifacial spasm (HFS). Microvascular decompression (MVD) is an effective surgical method for the treatment of TN and HFS caused by NVC. The judgement of NVC is a critical step in the preoperative evaluation of MVD, which is related to the effect of MVD treatment. Magnetic resonance imaging (MRI) technology has been used to detect NVC prior to MVD for several years. Among many MRI sequences, three-dimensional time-of-flight magnetic resonance angiography (3D TOF MRA) is the most widely used. However, 3D TOF MRA has some shortcomings in detecting NVC. Therefore, 3D TOF MRA combined with high resolution T2-weighted imaging (HR T2WI) is considered to be a more effective method to detect NVC.
To determine the value of 3D TOF MRA combined with HR T2WI in the judgment of NVC, and thus to assess its value in the preoperative evaluation of MVD.
Related studies published from inception to September 2022 based on PubMed, Embase, Web of Science, and the Cochrane Library were retrieved. Studies that investigated 3D TOF MRA combined with HR T2WI to judge NVC in patients with TN or HFS were included according to the inclusion criteria. Studies without complete data or not relevant to the research topics were excluded. The Quality Assessment of Diagnostic Accuracy Studies checklist was used to assess the quality of included studies. The publication bias of the included literature was examined by Deeks’ test. An exact binomial rendition of the bivariate mixed-effects regression model was used to synthesize data. Data analysis was performed using the MIDAS module of statistical software Stata 16.0. Two independent investigators extracted patient and study characteristics, and discrepancies were resolved by consensus. Individual and pooled sensitivities and specificities were calculated. The I² statistic and Q test were used to test heterogeneity. The study was registered on the website of PROSERO (registration No. CRD42022357158).
Our search identified 595 articles, of which 12 (including 855 patients) fulfilled the inclusion criteria. Bivariate analysis showed that the pooled sensitivity and specificity of 3D TOF MRA combined with HR T2WI for detecting NVC were 0.96 [95% confidence interval (CI): 0.92-0.98] and 0.92 (95%CI: 0.74-0.98), respectively. The pooled positive likelihood ratio was 12.4 (95%CI: 3.2-47.8), pooled negative likelihood ratio was 0.04 (95%CI: 0.02-0.09), and pooled diagnostic odds ratio was 283 (95%CI: 50-1620). The area under the receiver operating characteristic curve was 0.98 (95%CI: 0.97-0.99). The studies showed no substantial heterogeneity (I2= 0, Q = 0.001 P = 0.50).
Our results suggest that 3D TOF MRA combined with HR T2WI has excellent sensitivity and specificity for judging NVC in patients with TN or HFS. This method can be used as an effective tool for preoperative evaluation of MVD.
Core Tip: This meta-analysis included a total of 855 patients from 12 studies. The results indicated that three-dimensional time-of-flight magnetic resonance angiography combined with high resolution T2-weighted imaging has excellent diagnostic accuracy for judging neurovascular compression in patients with trigeminal neuralgia or hemifacial spasm. It can be used as an effective tool for preoperative evaluation of microvascular decompression.
- Citation: Liang C, Yang L, Zhang BB, Guo SW, Li RC. Three-dimensional time-of-flight magnetic resonance angiography combined with high resolution T2-weighted imaging in preoperative evaluation of microvascular decompression. World J Clin Cases 2022; 10(34): 12594-12604
- URL: https://www.wjgnet.com/2307-8960/full/v10/i34/12594.htm
- DOI: https://dx.doi.org/10.12998/wjcc.v10.i34.12594
Neurovascular compression (NVC) is considered the main cause of primary trigeminal neuralgia (TN) and hemifacial spasm (HFS), which usually occurs in the root entry zone (REZ) of the trigeminal nerve or facial nerve[1,2]. Microvascular decompression (MVD) is an effective surgical method for treating TN and HFS caused by NVC[3,4]. Although this operation is safe and effective for skillful and experienced neurosurgeons, it does not seem to be the best choice for patients with TN or HFS not caused by NVC[5]. Therefore, the judgement of NVC is a critical step in the preoperative evaluation of MVD, which is related to optimal decision-making for neurosurgeons and the effect of MVD treatment.
Magnetic resonance imaging (MRI) technology has been used to detect NVC prior to MVD for several years. However, the routine T1-weighted and T2-weighted images (T1WI and T2WI) do not adequately delineate neurovascular relationships at the REZ of the nerve[6]. Continuous advancements in MRI scanning sequence and imaging technology have enabled clear visualization of the cerebrovascular and intracranial segments of cranial nerves. Among the many MRI sequences, three-dimensional time-of-flight magnetic resonance angiography (3D TOF MRA) is the most widely used. TOF MRA selectively demonstrates fast-flowing blood and provides visualization of arteries and nerves[7]. However, the shortcoming of TOF MRA is that veins are insufficiently visualized[8]. High resolution T2WI (HR T2WI) can be obtained by different technologies, including 3D balanced steady state gradient echo and 3D fast turbo spin echo[7]. Different manufactures have different names for these technologies, such as Constructive Interference Steady State (CISS), Fast Imaging Employing Steady-state Acquisition (FIESTA), balanced-Fast Field Echo, Sampling Perfection with Application optimized Contrast using different flip angle Evolution (SPACE), balanced Steady State Free Precession (bSSFP), and TSE Driven Equilibrium (DRIVE). HR T2WI has an excellent contrast between structures, including cerebrospinal fluid, nerves, and adjacent blood vessels[8]. Therefore, 3D TOF MRA combined with HR T2WI is considered to be a more effective method to detect NVC. These two MRI techniques may be used to accurately visualize the fine anatomical structures at the REZ of the trigeminal nerve and facial nerve and differentiate the vein from the artery. The present meta-analysis was designed to determine the value of 3D TOF MRA combined with HR T2WI in the judgment of NVC, and thus to assess its value in preoperative evaluation of MVD.
PubMed, Embase, Web of Science, and the Cochrane Library were systematically searched. The medical subject heading (MeSH) or Emtree terms were “Magnetic Resonance Angiography” and “Microvascular Decompression Surgery”. The search query was “((Microvascular Decompression Surgery) OR (Decompression Surgeries, Microvascular) OR (Decompression Surgery, Microvascular) OR (Microvascular Decompression Surgeries) OR (Surgeries, Microvascular Decompression) OR (Surgery, Microvascular Decompression) OR (Microvascular Decompression) OR (Decompression, Microvascular) OR (Decompressions, Microvascular) OR (Microvascular Decompressions)) AND ((Magnetic Resonance Angiography) OR (MRI Angiography) OR (Angiographies, MRI) OR (Angiography, MRI) OR (MRI Angiographies) OR (MRI Angiographies) OR (Angiographies, Magnetic Resonance) OR (Magnetic Resonance Angiographies) OR (Perfusion Magnetic Resonance Imaging) OR (Perfusion Weighted MRI) OR (MRI, Perfusion Weighted) OR (time-of-flight))”. Studies published from inception to September 2022 based on these databases were retrieved.
After deleting duplicate publications, reasonable inclusion criteria and exclusion criteria were developed to review the remaining studies. The inclusion criteria were: (1) The purpose of the study was to investigate 3D TOF MRA combined with HR T2WI to judge NVC in patients with TN or HFS; (2) The study design was prospective or retrospective; and (3) The intraoperative findings were used as the reference standard for NVC diagnosis. The exclusion criteria were: (1) Reviews, case reports, editorials, correspondence, comments, or meeting abstracts/meeting minutes; (2) 3D TOF MRA combined with HR T2WI was not used as a method to judge NVC; (3) The patients in the study received only MRI evaluation and did not receive MVD; and (4) Studies without sufficient data to construct the 2 × 2 contingency table.
Two investigators (Li RC and Zhang BB) independently extracted the data, including the quality assessment from the retrieved studies. Discrepancies were resolved in a consensus meeting or, if agreement could not be reached, they were resolved by referral to a third investigator (Guo SW). The extracted data included: (1) Basic research information, including the first author, publication year, country of the first author, sample size, and type of the research design; (2) The characteristics of the patients, including their age and diagnosis; (3) The MRI sequences used; and (4) The research results, including the number of true positives (TP), false positives (FP), false negatives (FN), and true negatives (TN).
The methodological quality of the included studies was assessed by two researchers on the basis of the Quality Assessment of Diagnostic Accuracy Studies (QUADAS) checklist. Review Manager 5.4.1 software (The Cochrane Collaboration, United Kingdom) was used to generate a methodological quality graph and methodological quality graph summary.
An exact binomial rendition of the bivariate mixed-effects regression model was used to synthesize the data. Data analyses were performed using the MIDAS module of STATA 16.0 software (StataCorp LLC, United States). The pooled sensitivity, specificity, positive likelihood ratio (PLR), negative likelihood ratio (NLR), and diagnostic odds ratio (DOR), the area under the receiver operating characteristic curve (AUROC), and 95% confidence intervals (CIs) were calculated. The I² statistic and Q test were used to assess heterogeneity. The publication bias of the included literature was examined by Deeks’ test on Stata 16.0. The clinical application value of 3D TOF MRA combined with HR T2WI in the judgment of NVC was evaluated by the Fagan nomogram and likelihood ratio scatter plot. Graphs were produced with the MIDAS module for STATA 16.0 and Review Manager 5.4.1 software. This meta-analysis was registered on the website of PROSERO (registration No. CRD42022357158).
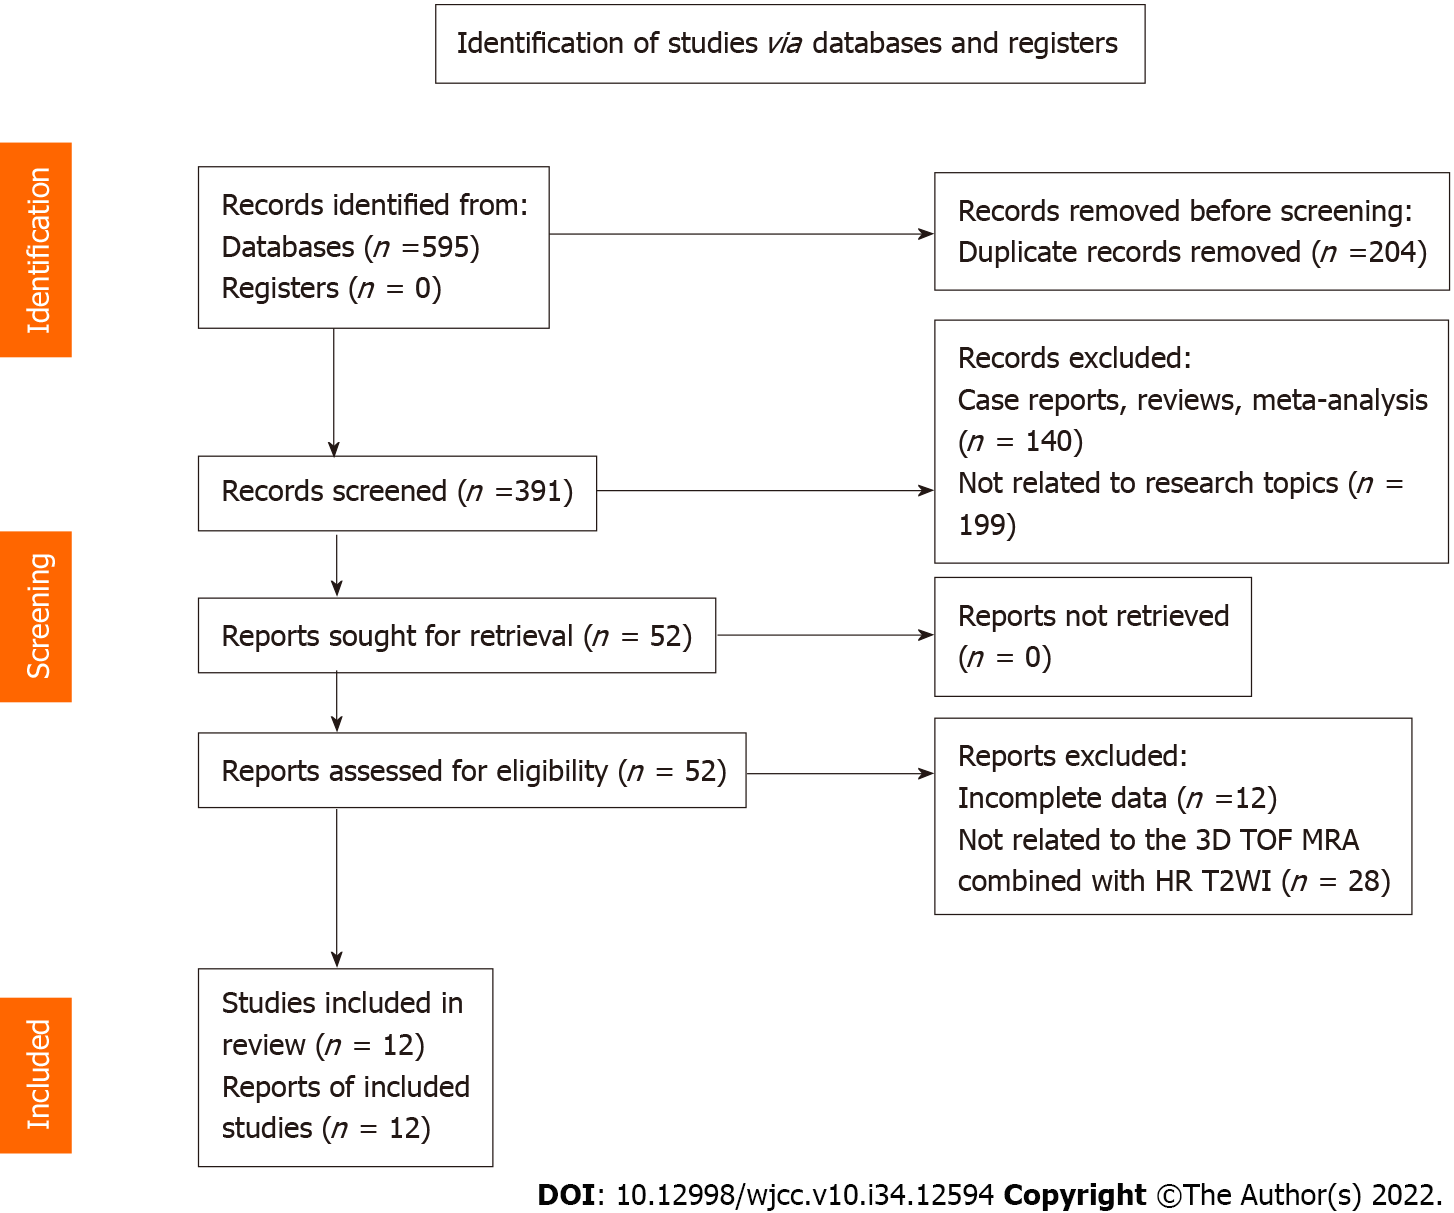
We identified 595 articles after the search, and 391 articles remained after deleting duplicate records. Full-text analysis was performed on the 52 articles remaining after screening by titles and abstracts, of which 12 articles without complete data and 28 articles using different MRI sequences were excluded. Finally, 12 articles were included in this analysis (Figure 1).
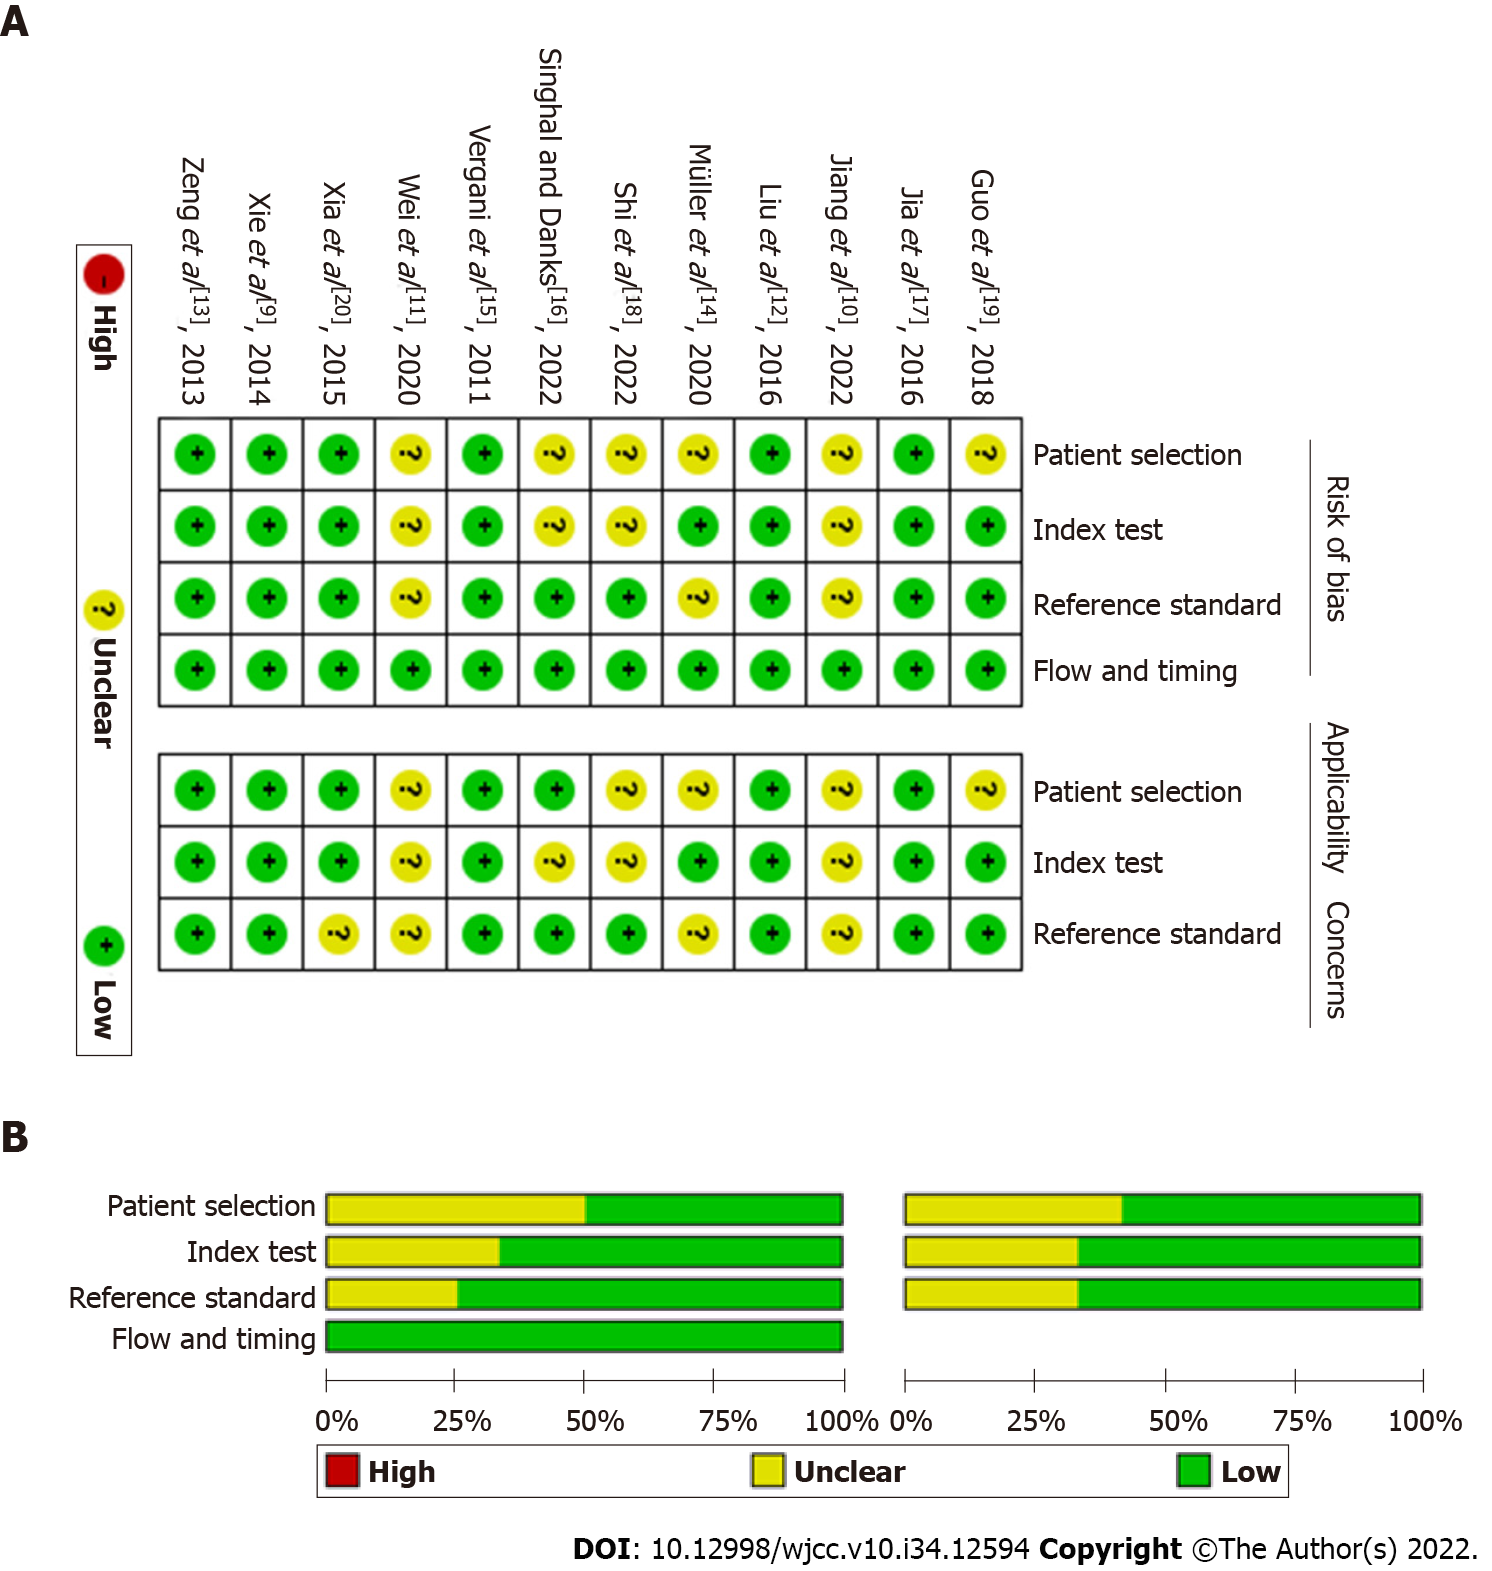
The basic characteristics of the literature included in this study are shown in Table 1. A total of 855 patients were included in the 12 studies. Among them, 8 studies focused on TN[9-16], 2 on HFS[17,18], and 2 on both[19,20]. Three of the 12 studies were performed with 3D TOF MRA combined with 3D CISS[9,16,17], 6 with 3D TOF MRA combined with 3D FIESTA[10-13,18,19], 1 with 3D TOF MRA combined with 3D SPACE[20], 1 with 3D TOF MRA combined with bSSFP/FSE[14], and 1 with 3D TOF MRA combined with 3D TSE DRIVE[15]. Four of the 12 were prospective studies and the remaining 8 were retrospective studies[10,12,13,17]. According to the methodological quality assessment conducted using the QUADAS checklist, the quality of the literature included in this study was acceptable (Figure 2).
| Ref. | Country | Sample size | Age (range, yr) | Diagnosis | Research type | Methods | TP | FP | FN | TN |
| Singhal and Danks[16], 2022 | Australia | 68 | 62 (21-87) | TN | Retrospective | 3D TOF MRA + 3D CISS | 50 | 3 | 7 | 8 |
| Jia et al[17], 2016 | China | 95 | 49.2 | HFS | Prospective | 3D TOF MRA + 3D CISS | 94 | 0 | 0 | 1 |
| Xie et al[9], 2014 | China | 90 | 56.8 (31-76) | TN | Retrospective | 3D TOF MRA + 3D CISS | 81 | 0 | 6 | 3 |
| Shi et al[18], 2022 | China | 40 | 49.6 (24-66) | HFS | Retrospective | 3D TOF MRA + 3D FIESTA | 35 | 0 | 4 | 1 |
| Jiang et al[10], 2022 | China | 49 | 53.1 (30-77) | TN | Prospective | 3D TOF MRA + 3D FIESTA | 48 | 0 | 0 | 1 |
| Wei et al[11], 2020 | China | 146 | 56 (32-83) | TN | Retrospective | 3D TOF MRA + 3D FIESTA | 129 | 0 | 14 | 3 |
| Guo et al[19], 2018 | China | 36 | 55.8 (31-80) | TN | Retrospective | 3D TOF MRA + 3D FIESTA | 33 | 0 | 1 | 2 |
| 31 | 51.5 (39-64) | HFS | 3D TOF MRA + 3D FIESTA | 28 | 1 | 1 | 1 | |||
| Liu et al[12], 2016 | China | 52 | 53.7 (35-72) | TN | Prospective | 3D TOF MRA + 3D FIESTA | 44 | 0 | 5 | 3 |
| Zeng et al[13], 2013 | China | 37 | 56.3 (22-81) | TN | Prospective | 3D TOF MRA + 3D FIESTA | 35 | 0 | 1 | 1 |
| Xia et al[20], 2015 | China | 106 | 51.9 (26-81) | TN/HFS | Retrospective | 3D TOF MRA + 3D SPACE | 97 | 0 | 2 | 7 |
| Müller et al[14], 2020 | Germany | 38 | 59.63 ± 13.56 | TN | Retrospective | 3D TOF MRA + bSSFP/FSE | 31 | 0 | 0 | 7 |
| Vergani et al[15], 2011 | United Kingdom | 67 | 59.8 (32-84) | TN | Retrospective | 3D TOF MRA + 3D TSE DRIVE | 60 | 1 | 3 | 3 |
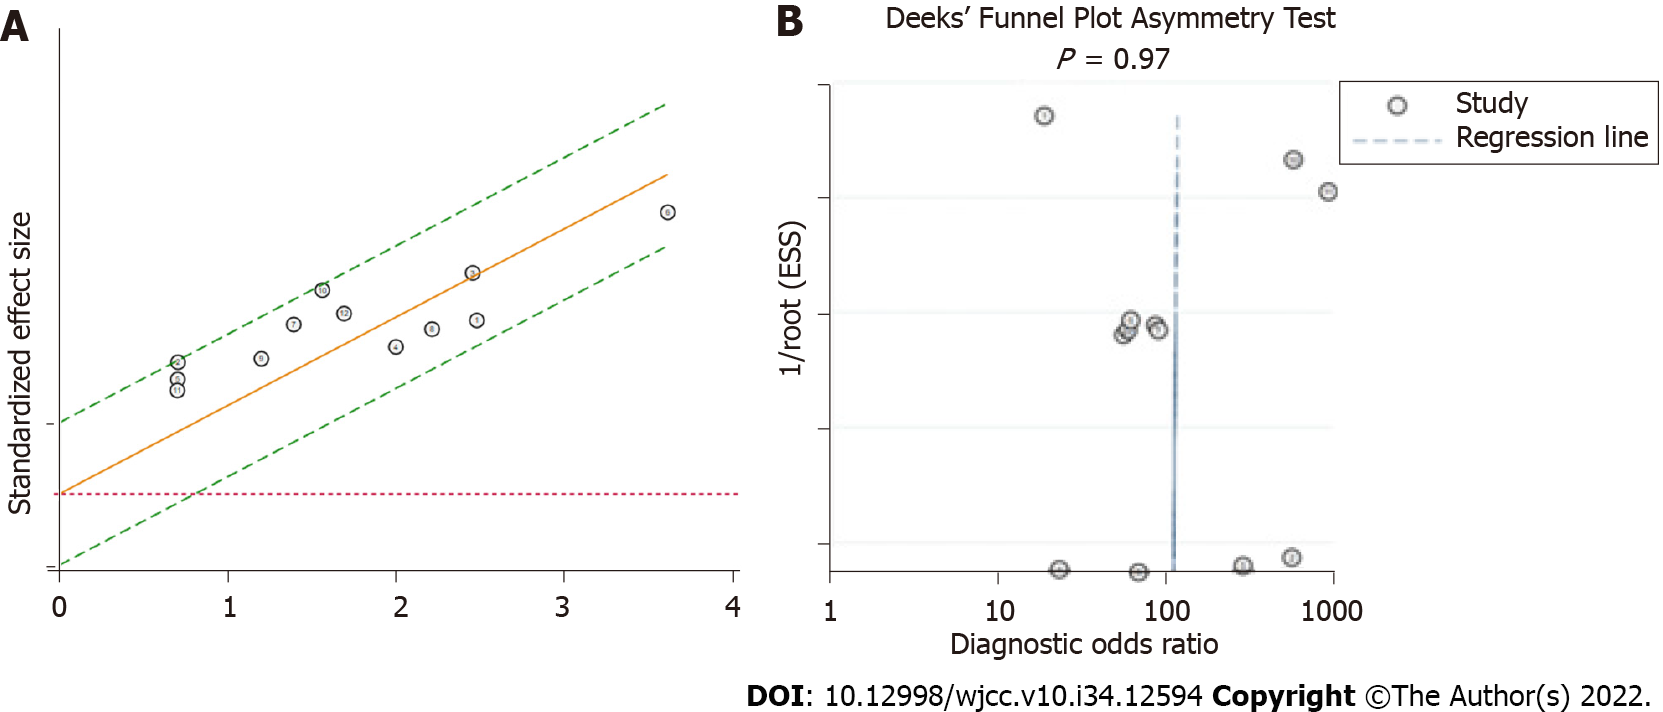
Heterogeneity of the meta-analysis: The I2 statistic and Q tests were used to assess heterogeneity. The results indicated that the studies in this meta-analysis had no substantial heterogeneity (I2= 0, Q = 0.001, P = 0.50). The same result can be observed from the Galbraith plot (Figure 3A).
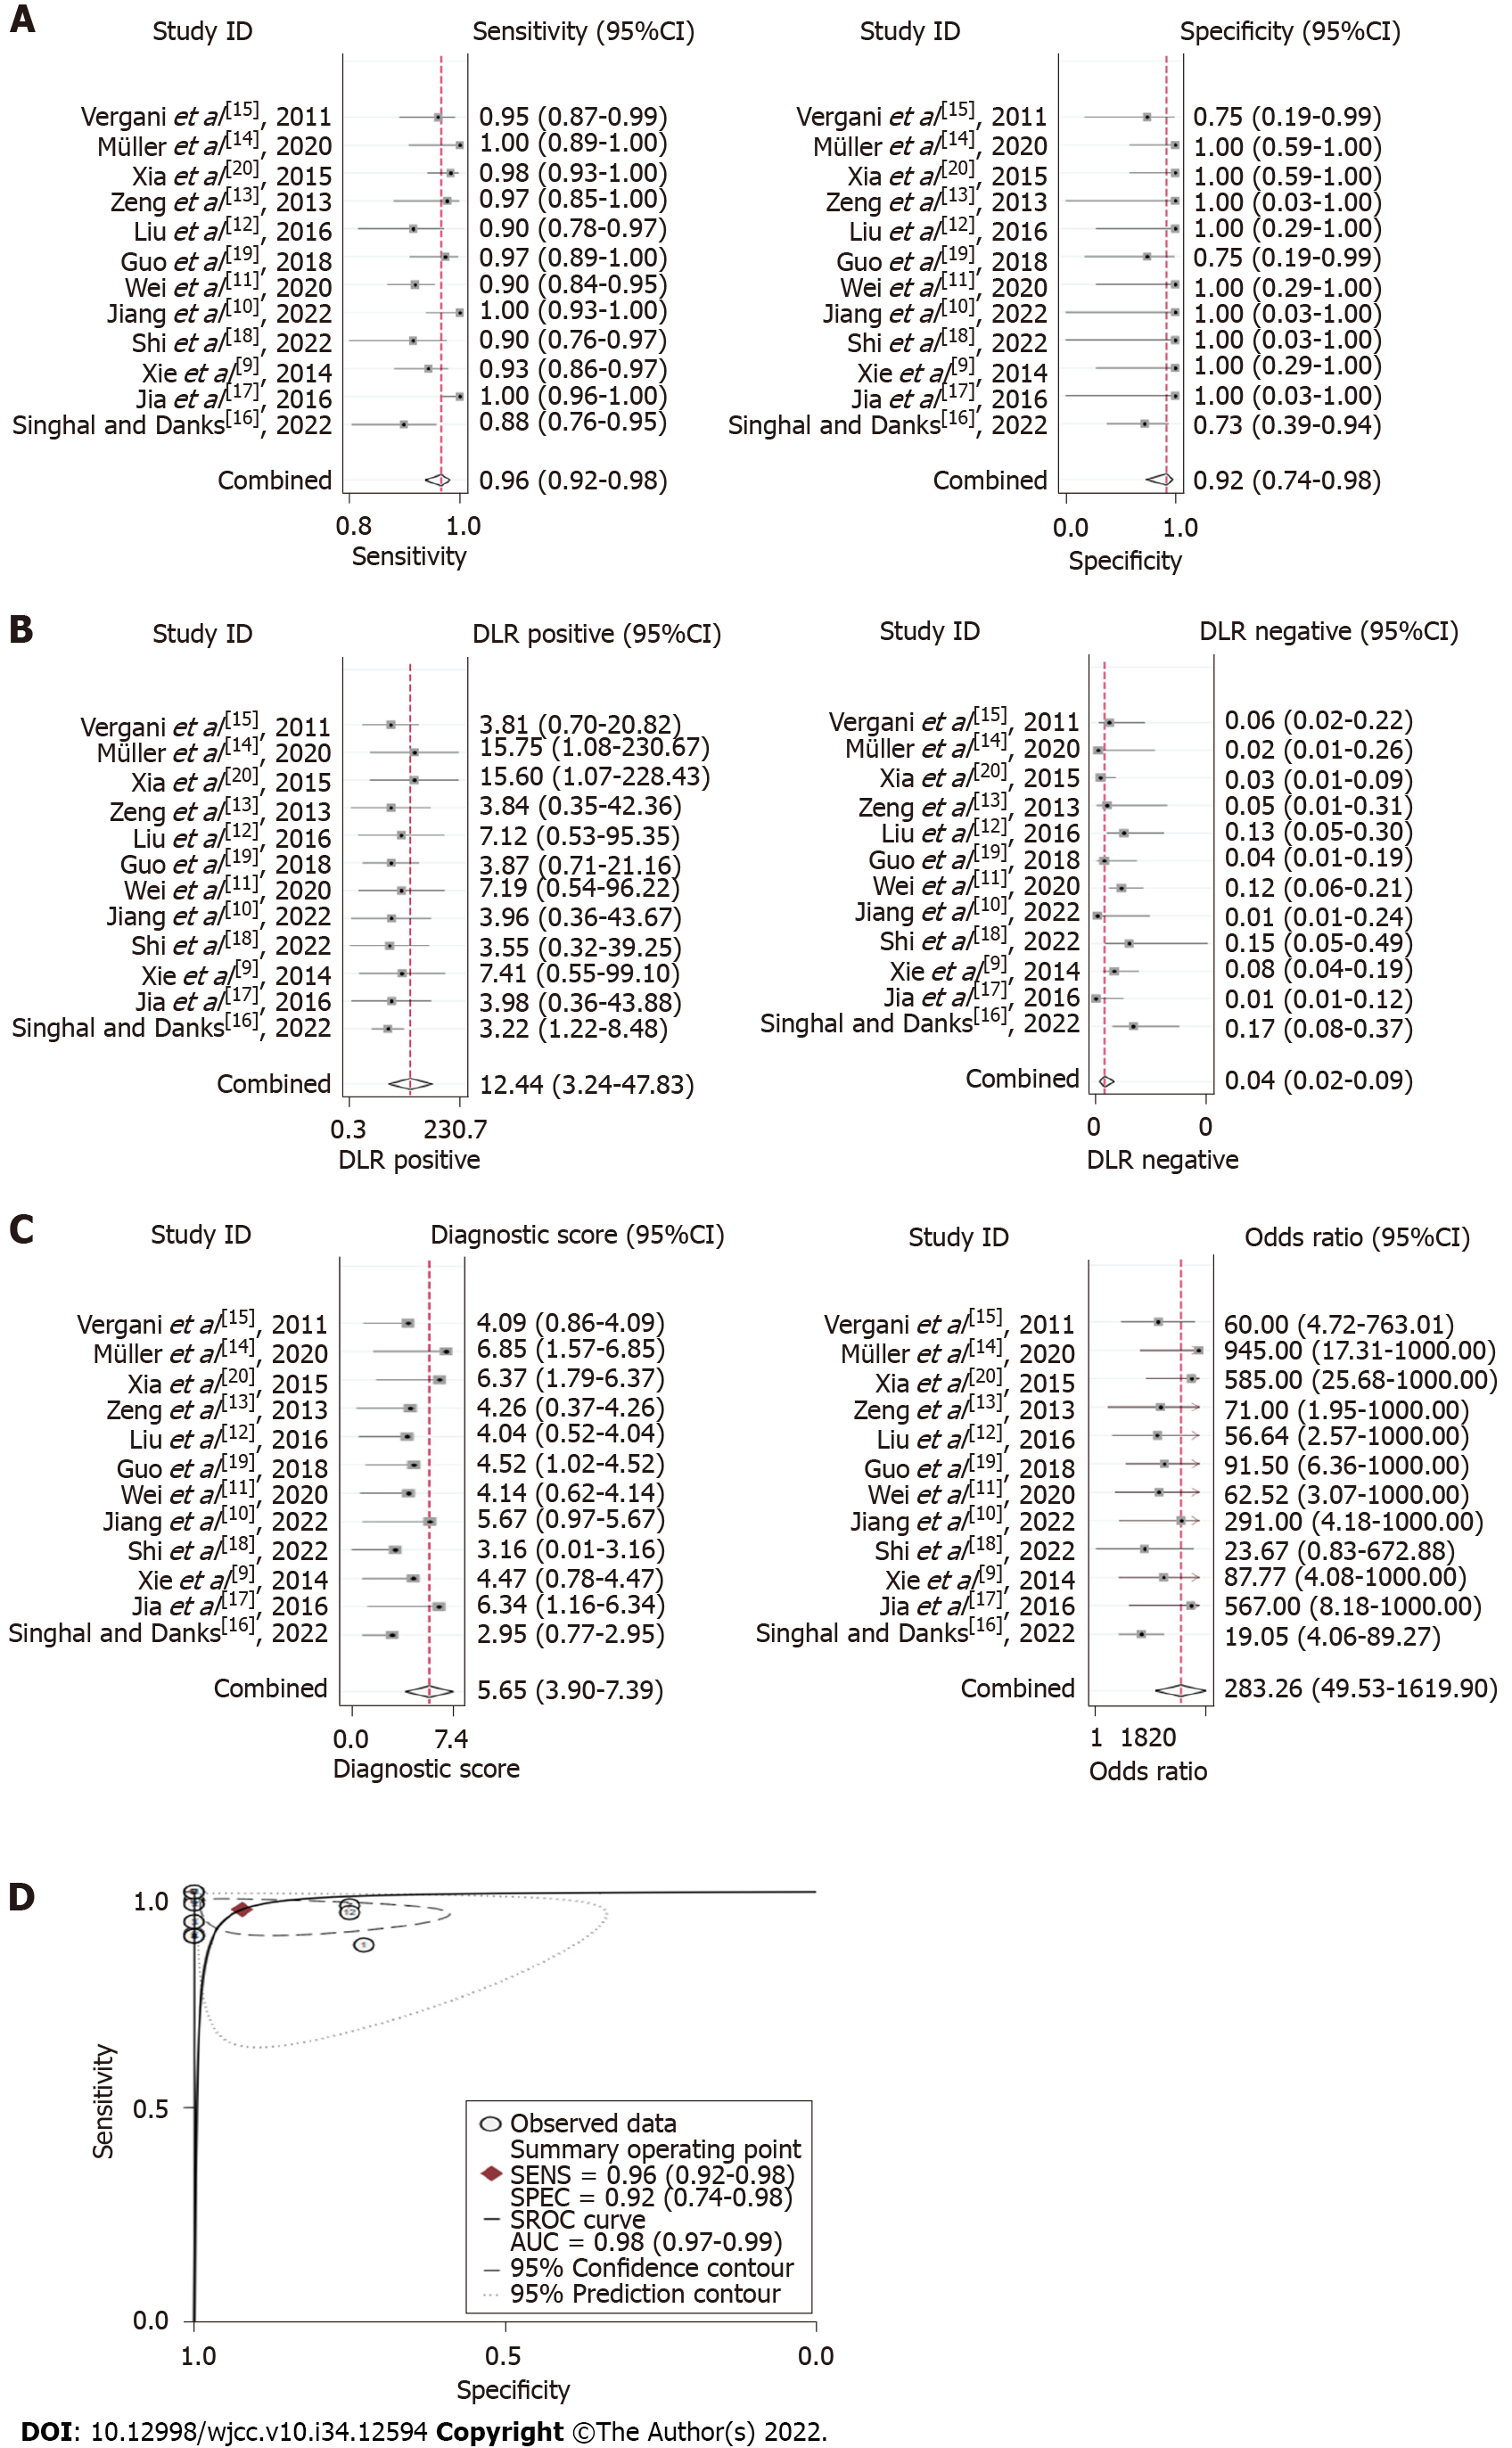
Summary effect size: Bivariate analysis revealed that the pooled sensitivity and specificity of 3D TOF MRA combined with HR T2WI for the detection of NVC were 0.96 (95%CI: 0.92-0.98) and 0.92 (95%CI: 0.74-0.98), respectively (Figure 4A). The pooled PLR was 12.44 (95%CI: 3.24-47.83), pooled NLR was 0.04 (95%CI: 0.02-0.09) (Figure 4B), and pooled DOR was 283.26 (95%CI: 49.53-1619.90) (Figure 4C). The AUROC was 0.98 (95%CI: 0.97-0.99) (Figure 4D).
Publication bias: Deeks’ funnel plot asymmetry test was conducted to assess the publication bias of the studies in the meta-analysis, with P = 0.97 indicating no significant publication bias in the included literature (Figure 3B).
Sensitivity analysis: Sensitivity analysis was performed by removing each included study one by one and calculating the summary effect size. The pooled sensitivity and AUROC were used as evaluation indicators. The results showed that excluding any study did not significantly change the pooled sensitivity and AUROC (Table 2), which suggested that the results of this meta-analysis were robust and reliable.
| Ref. | Pooled sensitivity (95%CI) | Pooled AUROC (95%CI) |
| Singhal and Danks[16], 2022 | 0.96 (0.93-0.98) | 0.96 (0.93-0.97) |
| Jia et al[17], 2016 | 0.95 (0.91-0.97) | 0.98 (0.96-0.99) |
| Xie et al[9], 2014 | 0.96 (0.92-0.98) | 0.98 (0.97-0.99) |
| Shi et al[18], 2022 | 0.96 (0.93-0.98) | 0.99 (0.97-0.99) |
| Jiang et al[10], 2022 | 0.95 (0.92-0.97) | 0.98 (0.96-0.99) |
| Wei et al[11], 2020 | 0.96 (0.93-0.98) | 0.99 (0.97-0.99) |
| Guo et al[19], 2018 | 0.96 (0.92-0.98) | 0.99 (0.97-0.99) |
| Liu et al[12], 2016 | 0.96 (0.93-0.98) | 0.98 (0.97-0.99) |
| Zeng et al[13], 2013 | 0.96 (0.92-0.98) | 0.98 (0.97-0.99) |
| Xia et al[20], 2015 | 0.96 (0.92-0.98) | 0.97 (0.96-0.98) |
| Müller et al[14], 2020 | 0.95 (0.92-0.97) | 0.97 (0.96-0.98) |
| Vergani et al[15], 2011 | 0.96 (0.92-0.98) | 0.99 (0.97-0.99) |
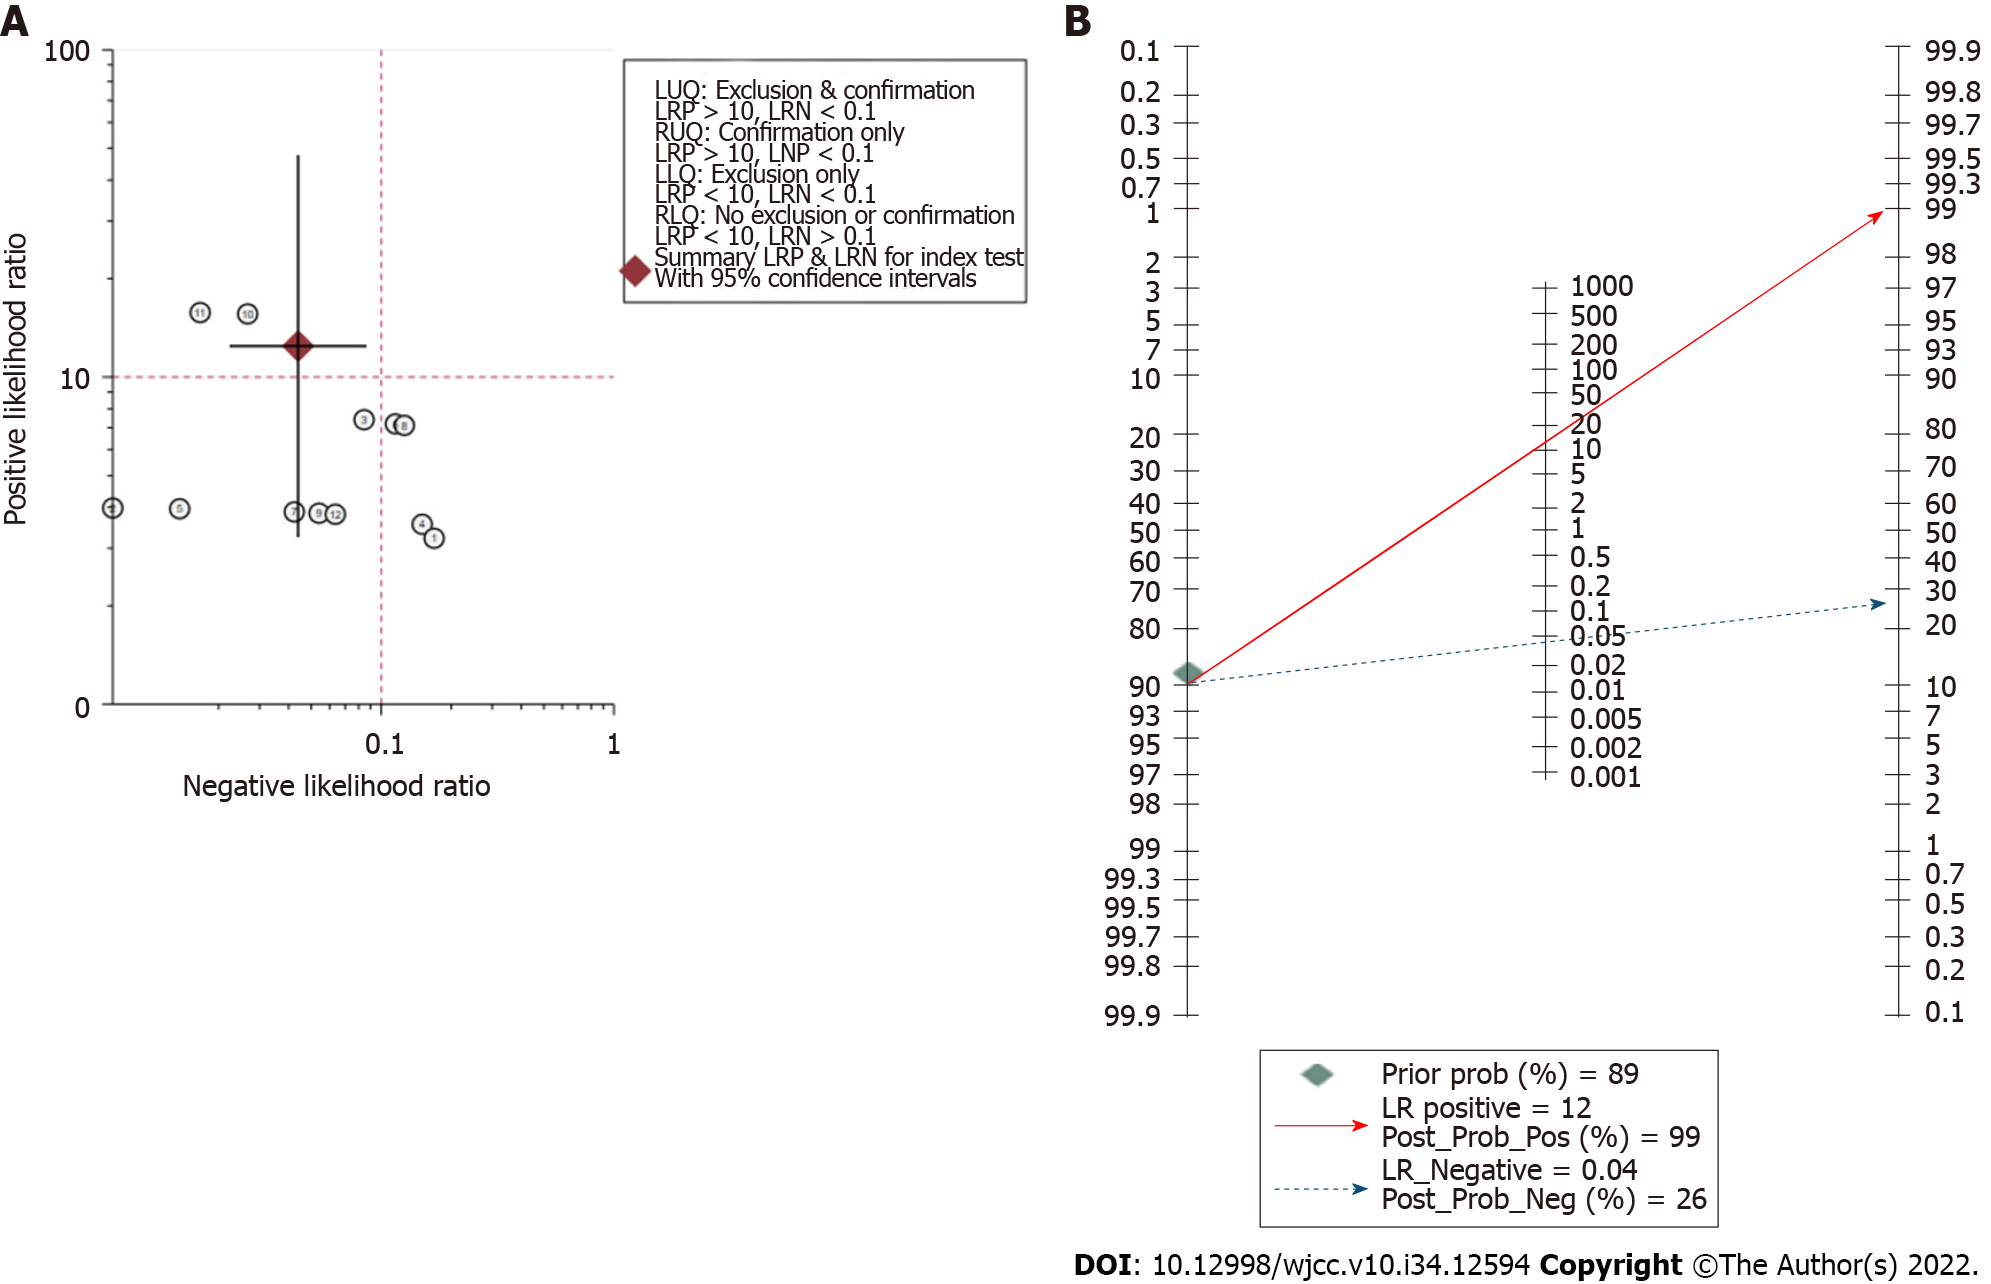
Assessment of clinical application value: The likelihood ratio scatter plot based on summary PLR and NLR was in the left upper quadrant (Figure 5A). According to the data of this meta-analysis, it was estimated that the incidence rate of NVC in TN and HFS patients was 89.47%, which was consistent with the reported results[2]. Therefore, given a pretest probability of 0.89, the Fagan nomogram showed that the positive post-test probability was 99% and negative post-test probability was 26% (Figure 5B).
In the present meta-analysis, we analyzed the sensitivity, specificity, PLR, NLR, DOR, and AUROC of 3D TOF MRA combined with HR T2WI for detecting NVC. The results showed high diagnostic ability of this combination method with high sensitivity and specificity. In a meta-analysis in 2015, the authors reported that 3D TOF MRA had a sensitivity of 95% (95%CI: 0.93-0.96) and specificity of 77% (95%CI: 0.66-0.86) in identifying NVC in TN patients[21]. According to our results, when combined with HR T2WI, the specificity of 3D TOF MRA could be significantly improved in diagnosing NVC. Higher specificity means less FP. This is very important for MVD when using MRI findings as the main basis for preoperative diagnosis. Fewer FP can reduce the potential risk of unnecessary MVD surgery in TN or HFS patients without NVC. For these patients, alternative procedures such as balloon compression, radiofrequency lesioning, glycerol injection, or stereotactic radiotherapy are less invasive and might be preferable to MVD[16]. Likelihood ratio and DOR are composite indicators that can simultaneously reflect sensitivity and specificity. According to a previous report, the DOR of 3D TOF MRA in diagnosing NVC was 52.92 (95%CI: 26.39-106.11)[21]. Compared with 3D TOF MRA, combined 3D TOF MRA and HR T2WI had higher PLR and lower NLR, and its DOR reached 283 (95%CI: 50-1620). These results suggested that combining 3D TOF MRA and HR T2WI has more advantages in diagnosing NVC in terms of diagnostic accuracy. Similar results were also shown by the AUROC. The AUROC value is correlated with the overall performance of the diagnostic test with larger AUROC values (closer to 1) indicating greater accuracy, sensitivity, and specificity[22]. The AUROC of 3D TOF MRA combined with HR T2WI in diagnosing NVC was 0.98 (95%CI: 0.97-0.99), showing high utility performance in the clinical diagnosis of NVC.
The post-test probabilities are also relevant for clinical diagnosis[23]. They provide information on the probability of whether the patient has NVC after obtaining the test results. In the present study, the post-test probability was also excellent. The post-test probability for a positive test result was 99%, indicating high clinical application value of 3D TOF MRA combined with HR T2WI in diagnosing NVC. The likelihood ratio scatter plot is a qualitative effect size rating approach for diagnostic test accuracy, which divides the effects rating of the diagnostic test by quadrant[24]. The likelihood ratio scatter plot based on summary PLR and NLR was in the left upper quadrant, indicating high clinical validity. This means that 3D TOF MRA combined with HR T2WI has the ability to exclude and confirm the diagnosis of NVC and the diagnostic accuracy of this test has a “Substantial” effect rating.
There are still some limitations in this meta-analysis: (1) NVC can also cause glossopharyngeal neuralgia (GN), but due to the lack of relevant clinical research data, patients with GN were not included in this meta-analysis; (2) Due to the small number of HFS cases, subgroup analysis was not performed for different diseases (TN/HFS); and (3) Of the 12 included studies, 8 were retrospective studies, which might cause more potential bias and confounding results than prospective studies.
Our results suggest that 3D TOF MRA combined with HR T2WI has excellent sensitivity and specificity for judging NVC in patients with TN or HFS. This method can be used as an effective tool for preoperative evaluation of MVD.
The judgement of neurovascular compression (NVC) is a critical step in the preoperative evaluation of microvascular decompression (MVD). Three-dimensional time-of-flight magnetic resonance angiography (3D TOF MRA) combined with high resolution T2-weighted imaging (HR T2WI) is considered to be a more effective method to detect NVC.
To assess the value of 3D TOF MRA combined with HR T2WI in the preoperative evaluation of MVD.
To determine the diagnostic value of 3D TOF MRA combined with HR T2WI in the judgment of NVC.
Related studies published from inception to September 2022 based on PubMed, Embase, Web of Science, and the Cochrane Library were retrieved. A meta-analysis was performed using the MIDAS module of STATA 16.0 software. The pooled sensitivity, specificity, positive likelihood ratio (PLR), negative likelihood ratio (NLR), and diagnostic odds ratio (DOR), the area under the receiver operating characteristic curve (AUROC), and 95% confidence intervals (CIs) were calculated.
Our search identified 595 articles, of which 12 (including 855 patients) fulfilled the inclusion criteria. The pooled sensitivity and specificity of 3D TOF MRA combined with HR T2WI for detecting NVC were 0.96 (95%CI: 0.92-0.98) and 0.92 (95%CI: 0.74-0.98), respectively. The pooled PLR was 12.4 (95%CI: 3.2-47.8), pooled NLR was 0.04 (95%CI: 0.02-0.09), and pooled DOR was 283 (95%CI: 50-1620). The AUROC was 0.98 (95%CI: 0.97-0.99).
3D TOF MRA combined with HR T2WI has excellent sensitivity and specificity for judging NVC in patients with trigeminal neuralgia or hydrosalpinx fluid.
3D TOF MRA combined with HR T2WI can be used as an effective tool for preoperative evaluation of MVD.
We would like to thank all authors of the included primary studies.
Provenance and peer review: Unsolicited article; Externally peer reviewed.
Peer-review model: Single blind
Specialty type: Medicine, research and experimental
Country/Territory of origin: China
Peer-review report’s scientific quality classification
Grade A (Excellent): A
Grade B (Very good): 0
Grade C (Good): C
Grade D (Fair): 0
Grade E (Poor): 0
P-Reviewer: Koopman J, Netherlands; Rakhshan V, Iran S-Editor: Wang JJ L-Editor: Wang TQ P-Editor: Wang JJ
| 1. | Lu AY, Yeung JT, Gerrard JL, Michaelides EM, Sekula RF Jr, Bulsara KR. Hemifacial spasm and neurovascular compression. Scientific World Journal. 2014;2014:349319. [RCA] [PubMed] [DOI] [Full Text] [Full Text (PDF)] [Cited by in Crossref: 35] [Cited by in RCA: 61] [Article Influence: 5.5] [Reference Citation Analysis (0)] |
| 2. | Bašić Kes V, Zadro Matovina L. Accommodation to Diagnosis of Trigeminal Neuralgia. Acta Clin Croat. 2017;56:157-161. [RCA] [PubMed] [DOI] [Full Text] [Cited by in Crossref: 7] [Cited by in RCA: 7] [Article Influence: 0.9] [Reference Citation Analysis (0)] |
| 3. | Cui Z, Ling Z. Advances in microvascular decompression for hemifacial spasm. J Otol. 2015;10:1-6. [RCA] [PubMed] [DOI] [Full Text] [Full Text (PDF)] [Cited by in Crossref: 2] [Cited by in RCA: 6] [Article Influence: 0.6] [Reference Citation Analysis (0)] |
| 4. | Sade B, Lee JH. Microvascular decompression for trigeminal neuralgia. Neurosurg Clin N Am. 2014;25:743-749. [RCA] [PubMed] [DOI] [Full Text] [Cited by in Crossref: 9] [Cited by in RCA: 15] [Article Influence: 1.4] [Reference Citation Analysis (0)] |
| 5. | Montano N, Conforti G, Di Bonaventura R, Meglio M, Fernandez E, Papacci F. Advances in diagnosis and treatment of trigeminal neuralgia. Ther Clin Risk Manag. 2015;11:289-299. [RCA] [PubMed] [DOI] [Full Text] [Full Text (PDF)] [Cited by in Crossref: 127] [Cited by in RCA: 125] [Article Influence: 12.5] [Reference Citation Analysis (0)] |
| 6. | Sindou M. Prediction of the vascular compression characteristics with magnetic resonance imaging for surgery of primary trigeminal neuralgias. World Neurosurg. 2013;80:298-299. [RCA] [PubMed] [DOI] [Full Text] [Cited by in Crossref: 1] [Cited by in RCA: 1] [Article Influence: 0.1] [Reference Citation Analysis (0)] |
| 7. | Chen SR. Neurological Imaging for Hemifacial Spasm. Int Ophthalmol Clin. 2018;58:97-109. [RCA] [PubMed] [DOI] [Full Text] [Cited by in Crossref: 3] [Cited by in RCA: 3] [Article Influence: 0.4] [Reference Citation Analysis (0)] |
| 8. | Donahue JH, Ornan DA, Mukherjee S. Imaging of Vascular Compression Syndromes. Radiol Clin North Am. 2017;55:123-138. [RCA] [PubMed] [DOI] [Full Text] [Cited by in Crossref: 38] [Cited by in RCA: 38] [Article Influence: 4.8] [Reference Citation Analysis (0)] |
| 9. | Xie Z, Sun T, Wang Y, Sun J, Zhang Q, Liu D, Zuo H, Jiang J. The value of MRI TOF and CISS sequence to the operation of trigeminal neuralgia decompression. Chin J Neurosurg. 2014;30:275-278. [DOI] [Full Text] |
| 10. | Jiang W, Liu B, Liu Y, Wang J, Ding Q, Ji H, Cui Y, Wang Y, Pang Q, Zeng Q. The evaluation of neurovascular relationships in trigeminal neuralgia: a pilot study on the optimal combination of high-resolution three-dimensional MR sequences. Int J Radiat Res. 2022;. [RCA] [DOI] [Full Text] [Reference Citation Analysis (0)] |
| 11. | Wei SC, Yu R, Meng Q, Qu C. Efficacy of microvascular decompression in patients with trigeminal neuralgia with negative neurovascular relationship shown by magnetic resonance tomography. Clin Neurol Neurosurg. 2020;197:106063. [RCA] [PubMed] [DOI] [Full Text] [Cited by in Crossref: 4] [Cited by in RCA: 9] [Article Influence: 1.8] [Reference Citation Analysis (0)] |
| 12. | Liu J, Chen Q, Chen Z, Liu R, Wang J, Shao L, Qin X, Lian H. Preoperative evaluation of trigeminal neuralgia using 3T three - dimensional time - of - flight magnetic resonance angiography and three - dimensional fast imaging employing steady-state acquisition. Chin J Exp Surg. 2016;33:502-504. [DOI] [Full Text] |
| 13. | Zeng Q, Zhou Q, Liu Z, Li C, Ni S, Xue F. Preoperative detection of the neurovascular relationship in trigeminal neuralgia using three-dimensional fast imaging employing steady-state acquisition (FIESTA) and magnetic resonance angiography (MRA). J Clin Neurosci. 2013;20:107-111. [RCA] [PubMed] [DOI] [Full Text] [Cited by in Crossref: 36] [Cited by in RCA: 45] [Article Influence: 3.8] [Reference Citation Analysis (0)] |
| 14. | Müller S, Khadhraoui E, Khanafer A, Psychogios M, Rohde V, Tanrikulu L. Differentiation of arterial and venous neurovascular conflicts estimates the clinical outcome after microvascular decompression in trigeminal neuralgia. BMC Neurol. 2020;20:279. [RCA] [PubMed] [DOI] [Full Text] [Full Text (PDF)] [Cited by in Crossref: 4] [Cited by in RCA: 14] [Article Influence: 2.8] [Reference Citation Analysis (0)] |
| 15. | Vergani F, Panaretos P, Penalosa A, English P, Nicholson C, Jenkins A. Preoperative MRI/MRA for microvascular decompression in trigeminal neuralgia: consecutive series of 67 patients. Acta Neurochir (Wien). 2011;153:2377-81; discussion 2382. [RCA] [PubMed] [DOI] [Full Text] [Cited by in Crossref: 21] [Cited by in RCA: 26] [Article Influence: 1.9] [Reference Citation Analysis (0)] |
| 16. | Singhal S, Danks RA. Radiologic and Neurosurgical Diagnosis of Arterial Neurovascular Conflict on Magnetic Resonance Imaging for Trigeminal Neuralgia in Routine Clinical Practice. World Neurosurg. 2022;157:e166-e172. [RCA] [PubMed] [DOI] [Full Text] [Cited by in Crossref: 1] [Cited by in RCA: 1] [Article Influence: 0.3] [Reference Citation Analysis (0)] |
| 17. | Jia JM, Guo H, Huo WJ, Hu SW, He F, Sun XD, Lin GJ. Preoperative Evaluation of Patients with Hemifacial Spasm by Three-dimensional Time-of-Flight (3D-TOF) and Three-dimensional Constructive Interference in Steady State (3D-CISS) Sequence. Clin Neuroradiol. 2016;26:431-438. [RCA] [PubMed] [DOI] [Full Text] [Cited by in Crossref: 16] [Cited by in RCA: 14] [Article Influence: 1.4] [Reference Citation Analysis (0)] |
| 18. | Shi H, Li Y, Wang Y, Guo W, Zhang K, Du Y, Shi H, Qian T. The preoperative evaluation value of 3D-slicer program before microsurgical vascular decompression in patients with hemifacial spasm. Clin Neurol Neurosurg. 2022;217:107241. [RCA] [PubMed] [DOI] [Full Text] [Cited by in RCA: 5] [Reference Citation Analysis (0)] |
| 19. | Guo T, Chen J, Miao Z, Zhu X, Liu X. 3.0T MR three-dimensional time-of-flight and fast imaging employing steady state acquisition sequences in pre-operative evaluation on spatial relationship among trigeminal nerve, facial nerve and peripheral vessels. Chin J Med Imaging Technol. 2018;34:836-840. [DOI] [Full Text] |
| 20. | Xia H, Kong M, Lu H, Luo S, Xu D, Zhang J. Value of MR 3D FLASH-WE Combined with 3D SPACE Sequences Applied in Cranial Nerve Diseases. Chin Comput Med Imaging. 2015;21:505-509. [DOI] [Full Text] |
| 21. | Cai J, Xin ZX, Zhang YQ, Sun J, Lu JL, Xie F. Diagnostic value of 3D time-of-flight MRA in trigeminal neuralgia. J Clin Neurosci. 2015;22:1343-1348. [RCA] [PubMed] [DOI] [Full Text] [Cited by in Crossref: 5] [Cited by in RCA: 9] [Article Influence: 0.9] [Reference Citation Analysis (0)] |
| 22. | Kumar R, Indrayan A. Receiver operating characteristic (ROC) curve for medical researchers. Indian Pediatr. 2011;48:277-287. [RCA] [PubMed] [DOI] [Full Text] [Cited by in Crossref: 440] [Cited by in RCA: 494] [Article Influence: 35.3] [Reference Citation Analysis (0)] |
| 23. | Choi BC. Slopes of a receiver operating characteristic curve and likelihood ratios for a diagnostic test. Am J Epidemiol. 1998;148:1127-1132. [RCA] [PubMed] [DOI] [Full Text] [Cited by in Crossref: 124] [Cited by in RCA: 137] [Article Influence: 5.1] [Reference Citation Analysis (0)] |
| 24. | Rubinstein ML, Kraft CS, Parrott JS. Determining qualitative effect size ratings using a likelihood ratio scatter matrix in diagnostic test accuracy systematic reviews. Diagnosis (Berl). 2018;5:205-214. [RCA] [PubMed] [DOI] [Full Text] [Cited by in Crossref: 10] [Cited by in RCA: 21] [Article Influence: 3.5] [Reference Citation Analysis (0)] |


