Published online Nov 26, 2022. doi: 10.12998/wjcc.v10.i33.12116
Peer-review started: July 26, 2022
First decision: September 26, 2022
Revised: September 27, 2022
Accepted: October 27, 2022
Article in press: October 27, 2022
Published online: November 26, 2022
Processing time: 119 Days and 21.4 Hours
Ulcerative colitis (UC) is a complicated disease caused by the interaction between genetic and environmental factors that affects mucosal homeostasis and triggers an inappropriate immune response. Single-cell RNA sequencing (scRNA-seq) can be used to rapidly obtain the precise gene expression patterns of thousands of cells in the intestine, analyze the characteristics of cells with the same phenotype, and provide new insights into the growth and development of intestinal organs, the clonal evolution of cells, and immune cell changes. These findings can provide new ideas for the diagnosis and treatment of intestinal diseases.
To identify clinical phenotypes and biomarkers that can predict the response of UC patients to specific therapeutic drugs and thus aid the diagnosis and treatment of UC.
Using the Gene Expression Omnibus (GEO) database, we analyzed peripheral blood cell subtypes of patients with UC by scRNA-seq combined with bulk RNA sequencing (RNA-seq) to reveal the core genes of UC. We then combined weighted gene correlation network analysis (WGCNA) and least absolute shrinkage and selection operator (LASSO) analysis to reveal diagnostic markers of UC.
After processing the scRNA-seq data, we obtained data from approximately 24340 cells and identified 17 cell types. Through intercellular communication analysis, we selected monocyte marker genes as the candidate gene set for the prediction model. Construction of a WGCNA coexpression network identified RhoB, cathepsin D (CTSD) and zyxin (ZYX) as core genes. Immune infiltration analysis showed that these three core genes were strongly correlated with immune cells. Functional enrichment analysis showed that the differentially expressed genes were closely related to immune and inflammatory responses, which are associated with many challenges in the diagnosis and treatment of UC.
Through scRNA-seq analysis, LASSO diagnostic model building and WGCNA, we identified RhoB, CTSD and ZYX as core genes of UC that are closely related to monocyte infiltration that may serve as diagnostic markers and molecular targets for UC therapeutic intervention.
Core Tip: Using the Gene Expression Omnibus database, we analyzed peripheral blood cell subtypes of patients with ulcerative colitis (UC) by single-cell RNA sequencing (scRNA-seq) combined with bulk RNA sequencing (RNA-seq) to reveal the core genes of UC. Through scRNA-seq analysis, least absolute shrinkage and selection operator diagnostic model building and weighted gene correlation network analysis, we identified RhoB, cathepsin D and zyxin as core genes of UC that are closely related to monocyte infiltration that may serve as diagnostic markers and molecular targets for UC therapeutic intervention.
- Citation: Dai YC, Qiao D, Fang CY, Chen QQ, Que RY, Xiao TG, Zheng L, Wang LJ, Zhang YL. Single-cell RNA-sequencing combined with bulk RNA-sequencing analysis of peripheral blood reveals the characteristics and key immune cell genes of ulcerative colitis . World J Clin Cases 2022; 10(33): 12116-12135
- URL: https://www.wjgnet.com/2307-8960/full/v10/i33/12116.htm
- DOI: https://dx.doi.org/10.12998/wjcc.v10.i33.12116
Ulcerative colitis (UC) is a chronic nonspecific intestinal inflammatory disease with persistent or recurrent episodes of diarrhea, mucous−purulent bloody stool, abdominal pain, and tenesmus[1]. The course of UC often alternates between active and remission phases and requires constant maintenance therapy, which can place substantial psychological, physical and financial burdens on patients and families[2]. In China, the incidence of UC has been on the rise in recent years, and the recurrent nature of the disease reduces the quality of life of UC patients[3]. The current goals for UC control include a clinical response, clinical remission, normalization of the C-reactive protein (CRP) and fecal calprotectin levels, endoscopic healing, and normalization of the quality of life without disability, and future goals should include histological healing[4]. 5-Aminosalicylic acid, glucocorticoids, and immunosuppressants are the main therapeutic agents for UC. Antitumor necrosis factor-α (TNF-α) drugs, anti-integrin monoclonal antibodies (mAbs), anti-interleukin-12/23 (IL-12/23) mAbs, Janus kinase (JAK) inhibitors, and sphingosine-1-phosphate receptor (S1PRs) modulators have also been approved for UC treatment, but some patients stop responding to these treatments[5]. Delayed diagnosis of UC is one of the risk factors for adverse outcomes, and early diagnosis is critical for obtaining the best treatment response rates. Selection of the drug for initial treatment is vital, and timely use of immunosuppressive or biological agents is associated with better outcomes. Therefore, identification of clinical phenotypes and biomarkers to predict the response of patients to specific therapeutic drugs has important implications for the diagnosis and treatment of UC[6].
Single-cell RNA sequencing (scRNA-seq) can increase understanding of the development of intestinal diseases at the individual cell level. ScRNA-seq can be used to rapidly obtain the precise gene expression patterns of thousands of cells in the intestine, analyze the characteristics of cells with the same phenotype, and provide new insights into the growth and development of intestinal organs, the clonal evolution of cells, and immune cell changes. These findings can provide new ideas for the diagnosis and treatment of intestinal diseases[7]. Li et al[8] found that UC risk-related genes are enriched in progenitor cells, glial cells and immune cells and showed consistently altered expression in immune cells of both inflammatory and noninflammatory tissues, whereas drug target genes were differentially expressed in antigen-presenting cells. T helper 17 (Th17)-cell activation was observed in both the epithelial cell lineage and immune cell lineage of UC patients, indicating systematic changes in Th17-driven immune activity. Devlin et al[9] found that nonresponsiveness to anti-integrin biologic therapies in patients with pouchitis and UC after ileal pouch anal anastomosis was associated with the IL-1β+LYZ+ myeloid cell signature in a subset of patients, and these results may provide biomarkers for personalized therapy for patients with UC. The detection of peripheral blood-related indicators in patients with UC also provides an objective basis for the diagnosis and treatment of disease. Compared with colonoscopy, these detection methods taking advantage of such indicators are more convenient, and patients are more likely to agree to undergoing these analyses. Gryglewski et al[10] found that patients with progressive UC have reduced γδ T cells in the peripheral blood, increased αβ/γδ T-cell ratios, and significantly increased percentages of γδTCD25, γδTCD54, and γδTCD62L lymphocytes compared with patients with stable UC. These observations might provide markers for predicting exacerbations in UC patients. Furukawa S et al[11] suggested that the peripheral blood monocyte count could be used as a supplemental serum marker of mucosal healing in UC patients with low CRP levels.
Based on the above research, we analyzed peripheral blood cell subtypes of UC patients by scRNA-seq combined with bulk RNA sequencing (RNA-seq) using the Gene Expression Omnibus (GEO) database, revealed markers of UC cell subtypes, and performed weighted gene correlation network analysis (WGCNA) and least absolute shrinkage and selection operator (LASSO) analysis to reveal diagnostic markers of UC with the aim of providing experimental research ideas and a theoretical basis for the discovery of new UC molecular mechanisms and therapeutic drugs.
The GEO database (https://www.ncbi.nlm.nih.gov/gds/) is a database for storing chip sequencing, second-generation sequencing and other high-throughput sequencing data. The GSE125527 data file was downloaded from the NCBI GEO public database and annotated with the GPL24676 platform, and the data from 15 samples of peripheral blood mononuclear cells (PBMCs) with complete expression profiles (including 7 samples from UC patients and 8 normal samples) were downloaded for analysis. The Series Matrix File of GSE3365 was downloaded (the annotation platform was GPL96). The data from 68 UC patients with complete expression profiles were downloaded for this analysis. The Series Matrix File of GSE126124 was downloaded (the annotation platform was GPL96). The data from 57 UC patients with complete expression profiles were downloaded for this analysis.
First, the expression profiles were processed using the Seurat package, and low-expression genes were filtered out (nfeature_rna > 50 & percent; MT < 5). The data were successively processed by normalization, homogenization, principle component analysis (PCA), and uniform manifold approximation and projection (UMAP) analysis. The optimal number of principle components (PCs) was determined with ElbowPlot, and the positional relationship between each cluster was obtained by TSNE analysis. Each cluster was annotated with the MonacoImmuneData annotation file of the Celldex package, which provides annotation for some cells that are important for disease occurrence. Finally, we extracted the marker genes for each cell subtype from the single-cell expression profile by setting the logfc.threshold parameter of FindAllMarkers to 1. Genes with |avg log2FC| > 1 and p adj < 0.05 were identified as specific marker genes for each cell subtype.
Functional annotation of target genes was performed using clusterProfiler to fully explore their functional relevance. Gene ontology (GO) and Kyoto Encyclopedia of Genes and Genomes (KEGG) analyses were conducted to assess relevant functional categories. The terms with P and Q values less than 0.05 identified from the GO and KEGG pathway enrichment analyses were considered significant.
CellChat is a tool that enables quantitative inference and analysis of intercellular communication networks from single-cell data. The main cell input and output signals are assessed, and the coordinate functions of these cells and signals are identified and analyzed using the CellChat network. In this analysis, we used the standardized single-cell expression profile as the input data, obtained the cell subtypes by single-cell analysis, used these subtypes as the cell information, analyzed the interactions related to signaling, and quantified the closeness of the interaction relationship based on the interaction weights and counts between cells to observe the activity and influence of each type of cell in the disease.
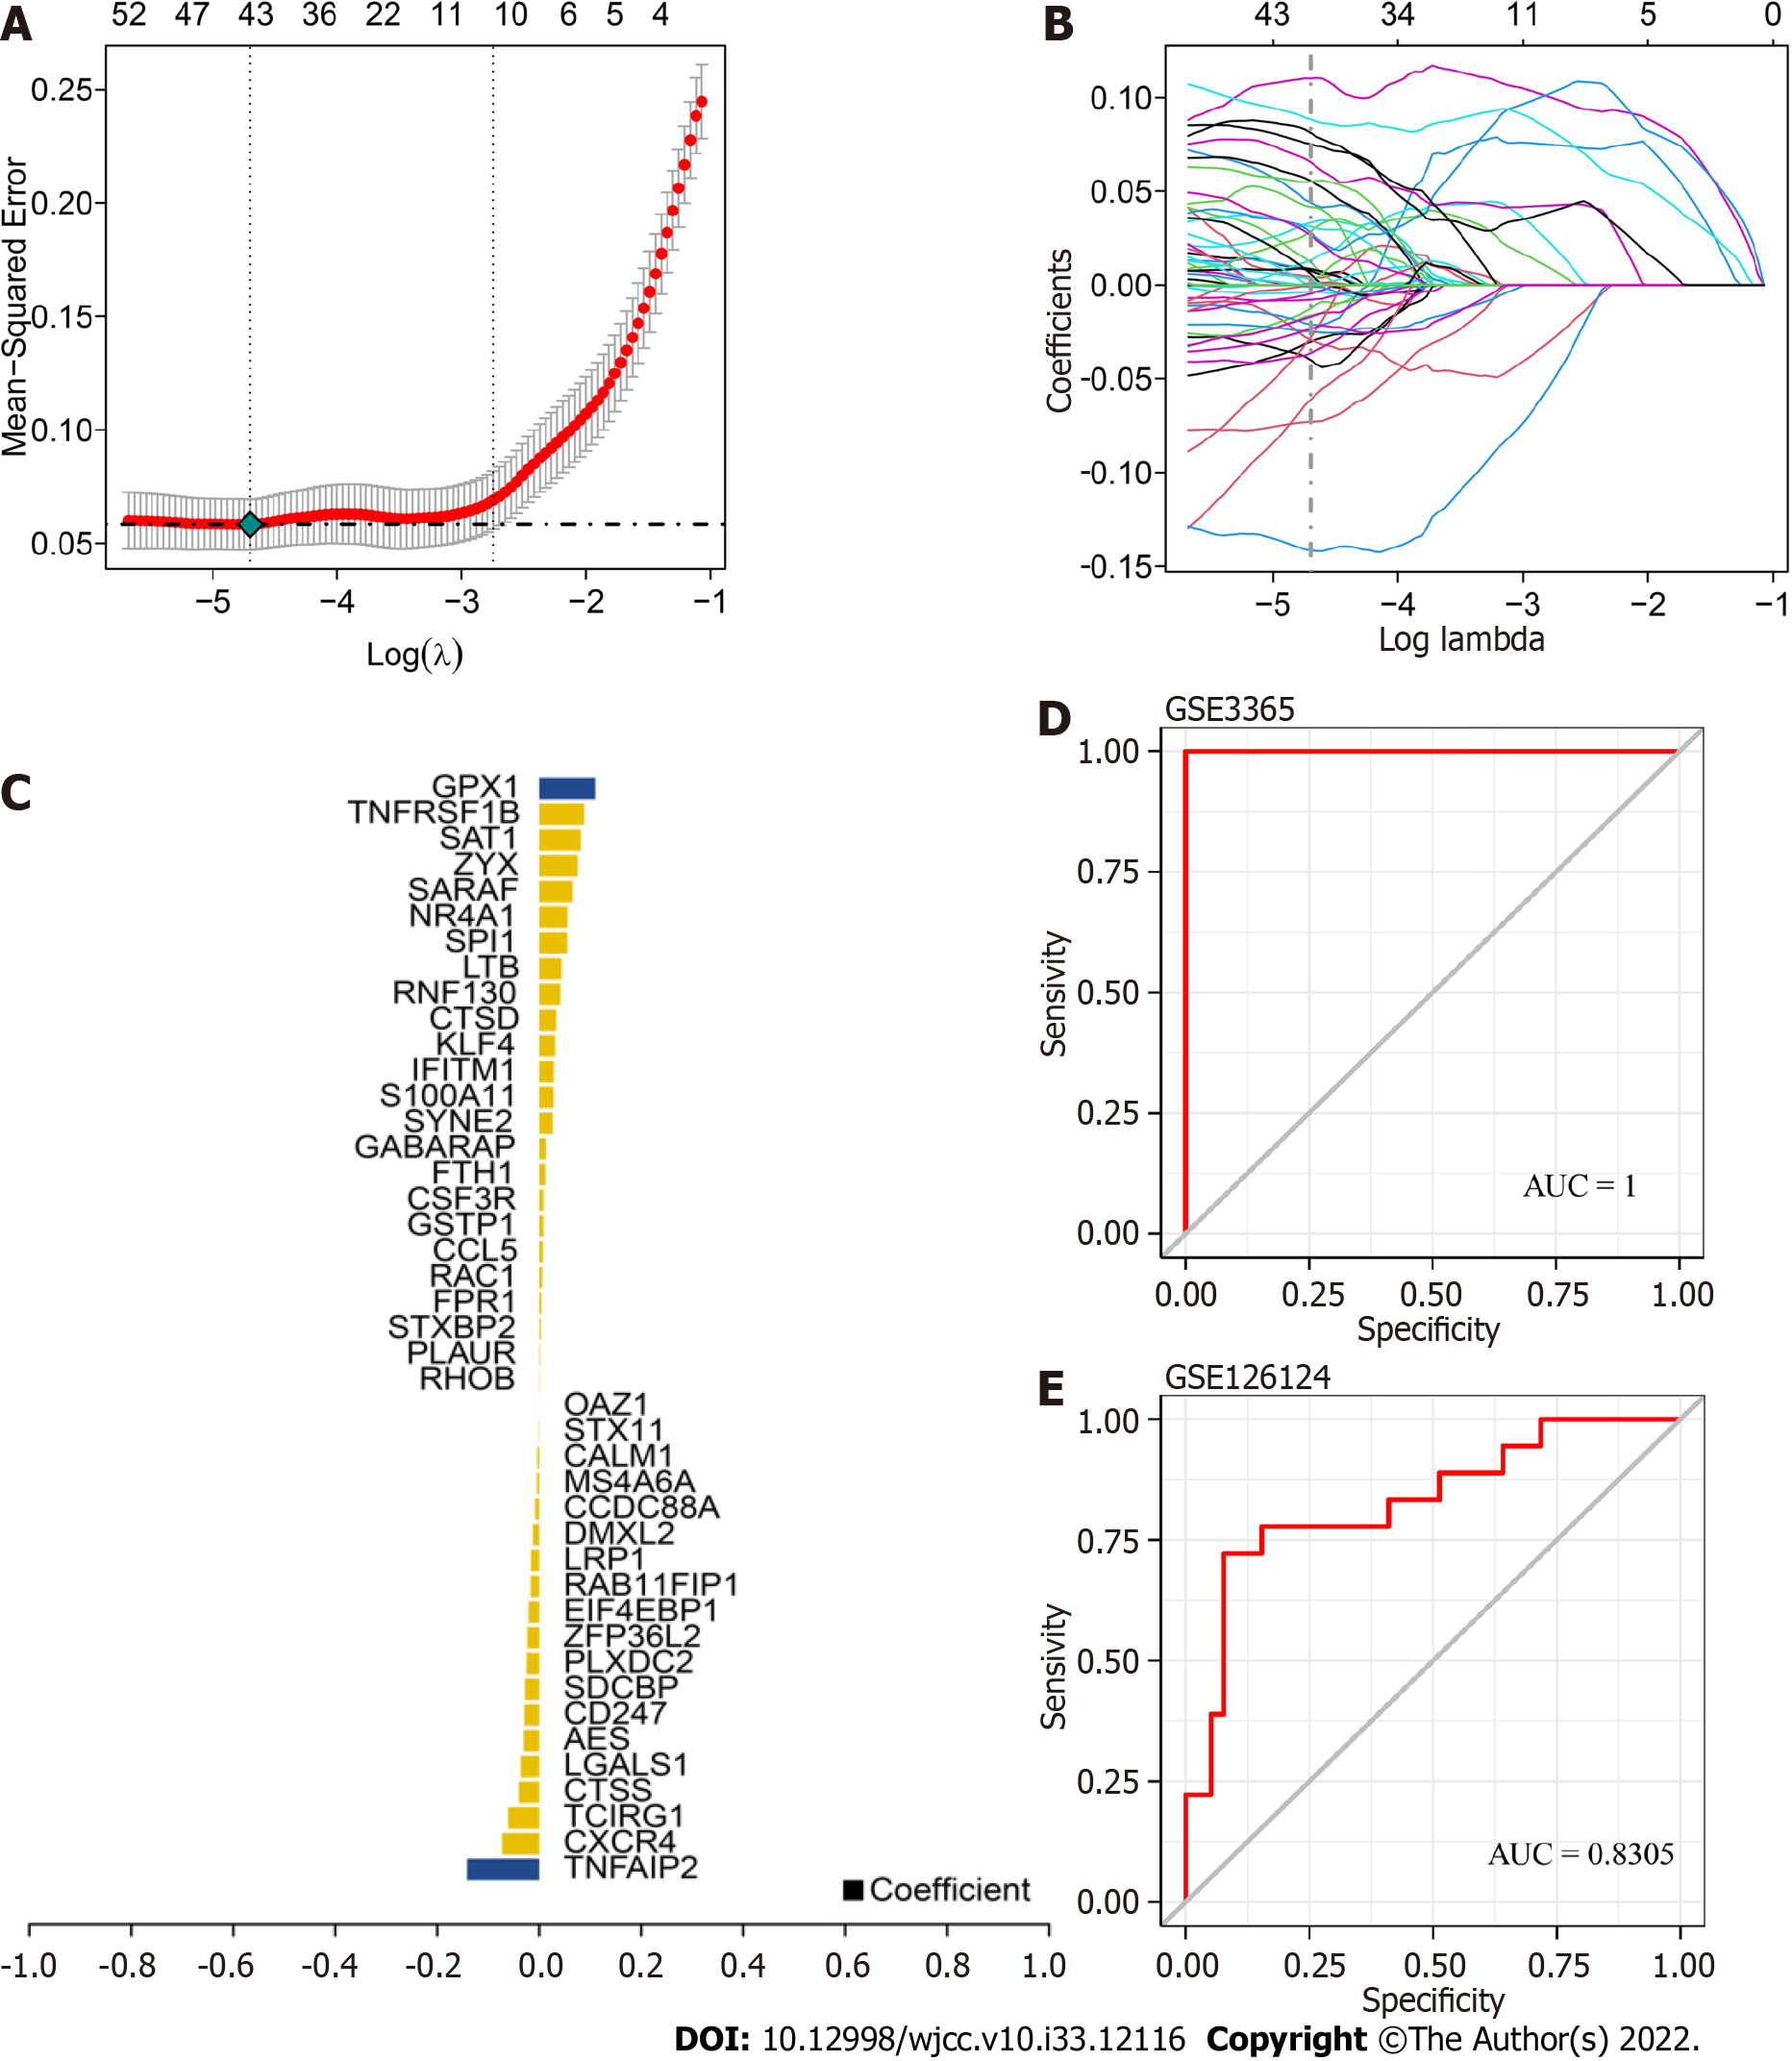
The target genes were selected, and LASSO regression was used to further construct the diagnostic model. After inclusion of the expression values for each specific gene, the risk score formula was constructed based on the data from each patient and weighted with the regression coefficients estimated from the LASSO regression analysis. According to the risk score formula, the patients were divided into high- and low-score groups using the median risk score as the cutoff point, and a receiver operating characteristic (ROC) curve was used to study the predictive accuracy of the model. The model formula was as follows: TNFAIP2 * (-0.141)+CXCR4 * (-0.073)+ TCIRG1 * (-0.061)+ CTSS * (-0.040)+ LGALS1 * (-0.036)+ AES * (-0.030)+ CD247 * (-0.029)+ SDCBP * (-0.028)+ PLXDC2 * (-0.024)+ ZFP36L2 * (-0.023)+ EIF4EBP1 * (-0.020)+ RAB11FIP1 * (-0.016)+ LRP1* (-0.016)+ DMXL2 * (-0.012)+ CCDC88A * (-0.007)+ MS4A6A * (-0.004)+ CALM1 * (-0.003)+ STX11 * (-0.01)+ OAZ1 * (-1.793)+ RHOB * 0.0008+ PLAUR* 0.001+ STXBP2 * 0.002+ FPR1 * 0.004+ RAC1 *0.005+ CCL5 * 0.007+ GSTP1 * 0.008+ CSF3R * 0.008+ FTH1 * 0.011+ GABARAP * 0.013+ SYNE2 * 0.026+ S100A11 * 0.028+ IFITM1 * 0.028+ KLF4 * 0.031+ CTSD * 0.033+ RNF130 * 0.041+ LTB * 0.043+ SPI1 * 0.055+ NR4A1 * 0.055+ SARAF * 0.065+ ZYX * 0.075+ SAT1 * 0.081+TNFRSF1B * 0.088+ GPX1 * 0.109.
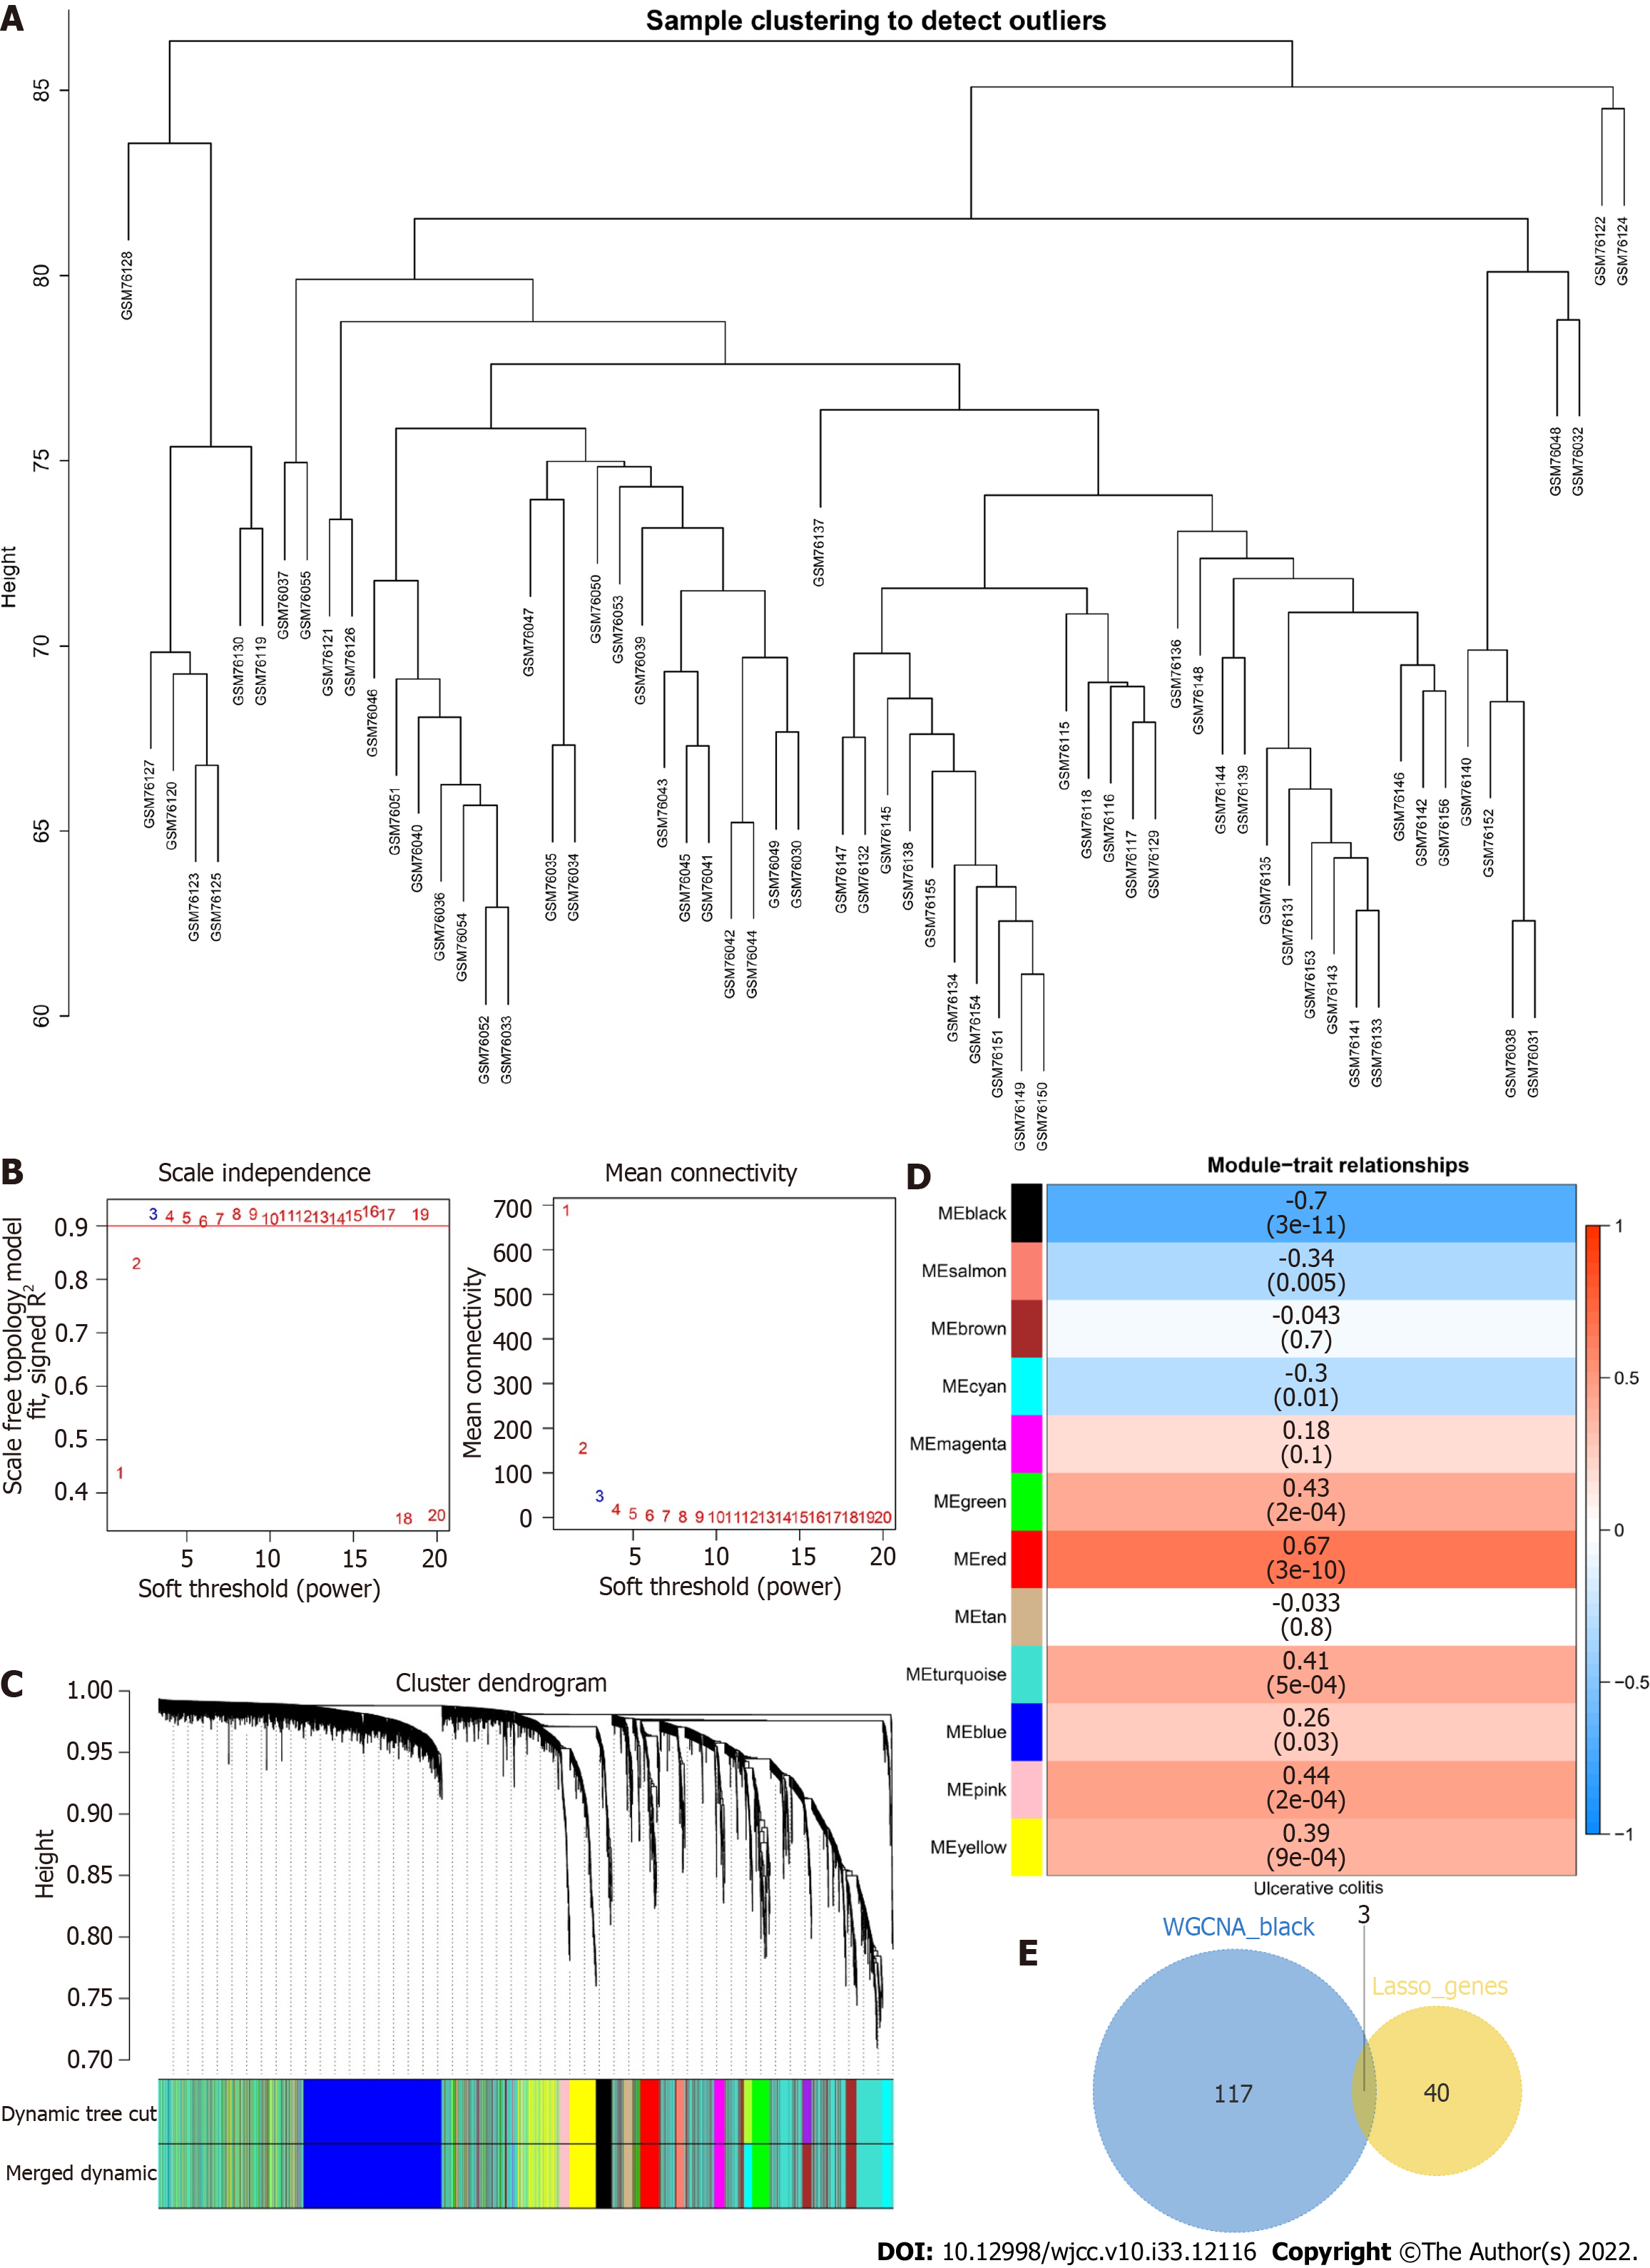
We constructed weighted gene coexpression networks to search for coexpressed gene modules and explored the association between gene networks and phenotypes and the core genes in the networks. The WGCNA-R package was used to construct a coexpression network of genes with variance values in the top 5000 in the GSE3365 dataset based on a soft threshold of 3. The weighted adjacency matrix was transformed into a topological overlap matrix (TOM) to estimate the network connectivity, and the agglomerative hierarchical clustering method was applied to construct the clustering tree structure of the TOM matrix. Different branches of the clustering tree represent different gene modules, and different colors indicate different modules. Based on their weighted correlation coefficients, genes were classified according to their expression patterns; genes with similar patterns were grouped into one module, and all the genes were divided into multiple modules based on gene expression patterns.
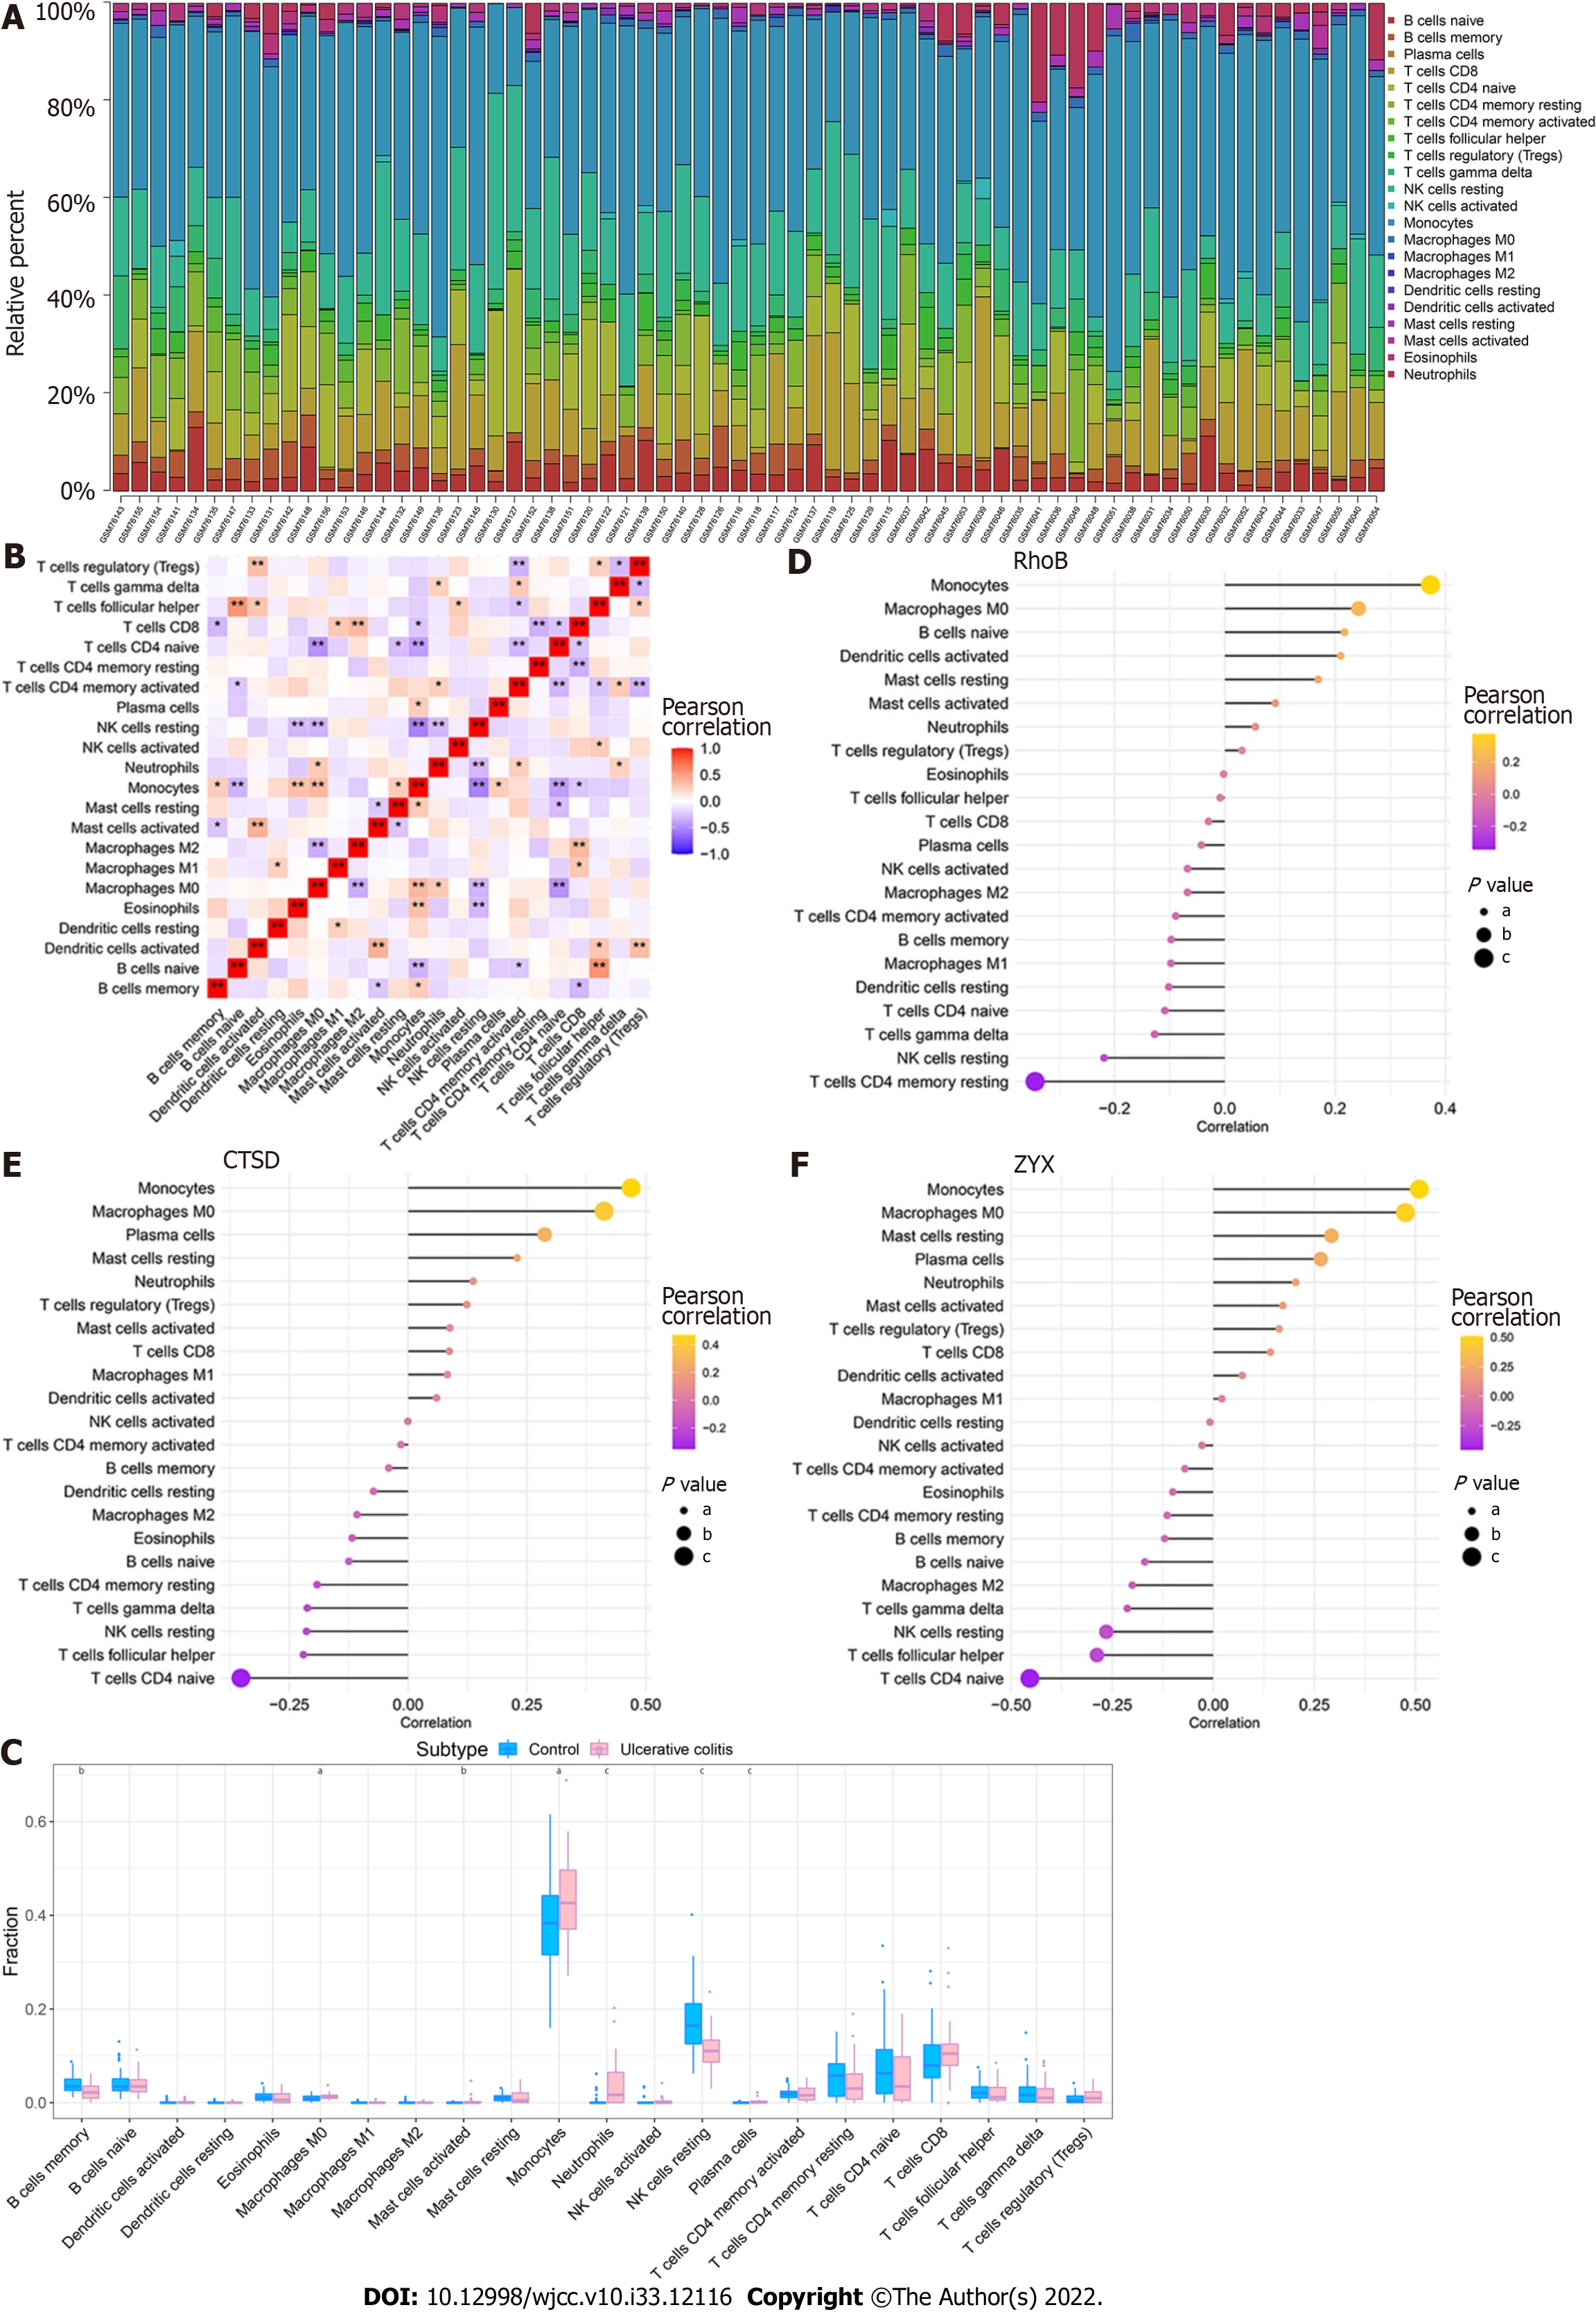
The CIBERSORT method is a widely used method for the evaluation of immune cell types in a microenvironment. Based on the principle of support vector regression, this method deconvolutes expression matrixes of immune cell subtypes and considers 547 biomarkers that distinguish 22 human immune cell phenotypes, including T cell, B cell, plasma cell, and myeloid cell subsets. RNA-seq data from patients with UC were analyzed using the CIBERSORT algorithm to infer the relative proportions of 22 infiltrating immune cells, and Pearson correlation analysis of gene expression and immune cell content was performed. P < 0.05 was considered to indicate a significant difference.
Gene set variation analysis (GSVA) is a nonparametric unsupervised method for assessing the enrichment of transcriptome genes. GSVA translates gene-level changes into pathway-level changes by combining gene sets of interest and thus determines the biological functions of genes enriched in samples. In this study, we downloaded gene sets from the Molecular Signatures Database (version v7.0) and used GSVA to comprehensively score each gene set and thus evaluate the potential changes in biological functions of different samples.
Statistical analyses were performed using R language (R version 4.1.2). All statistical tests were two-sided, and P < 0.05 was considered to indicate statistical significance.
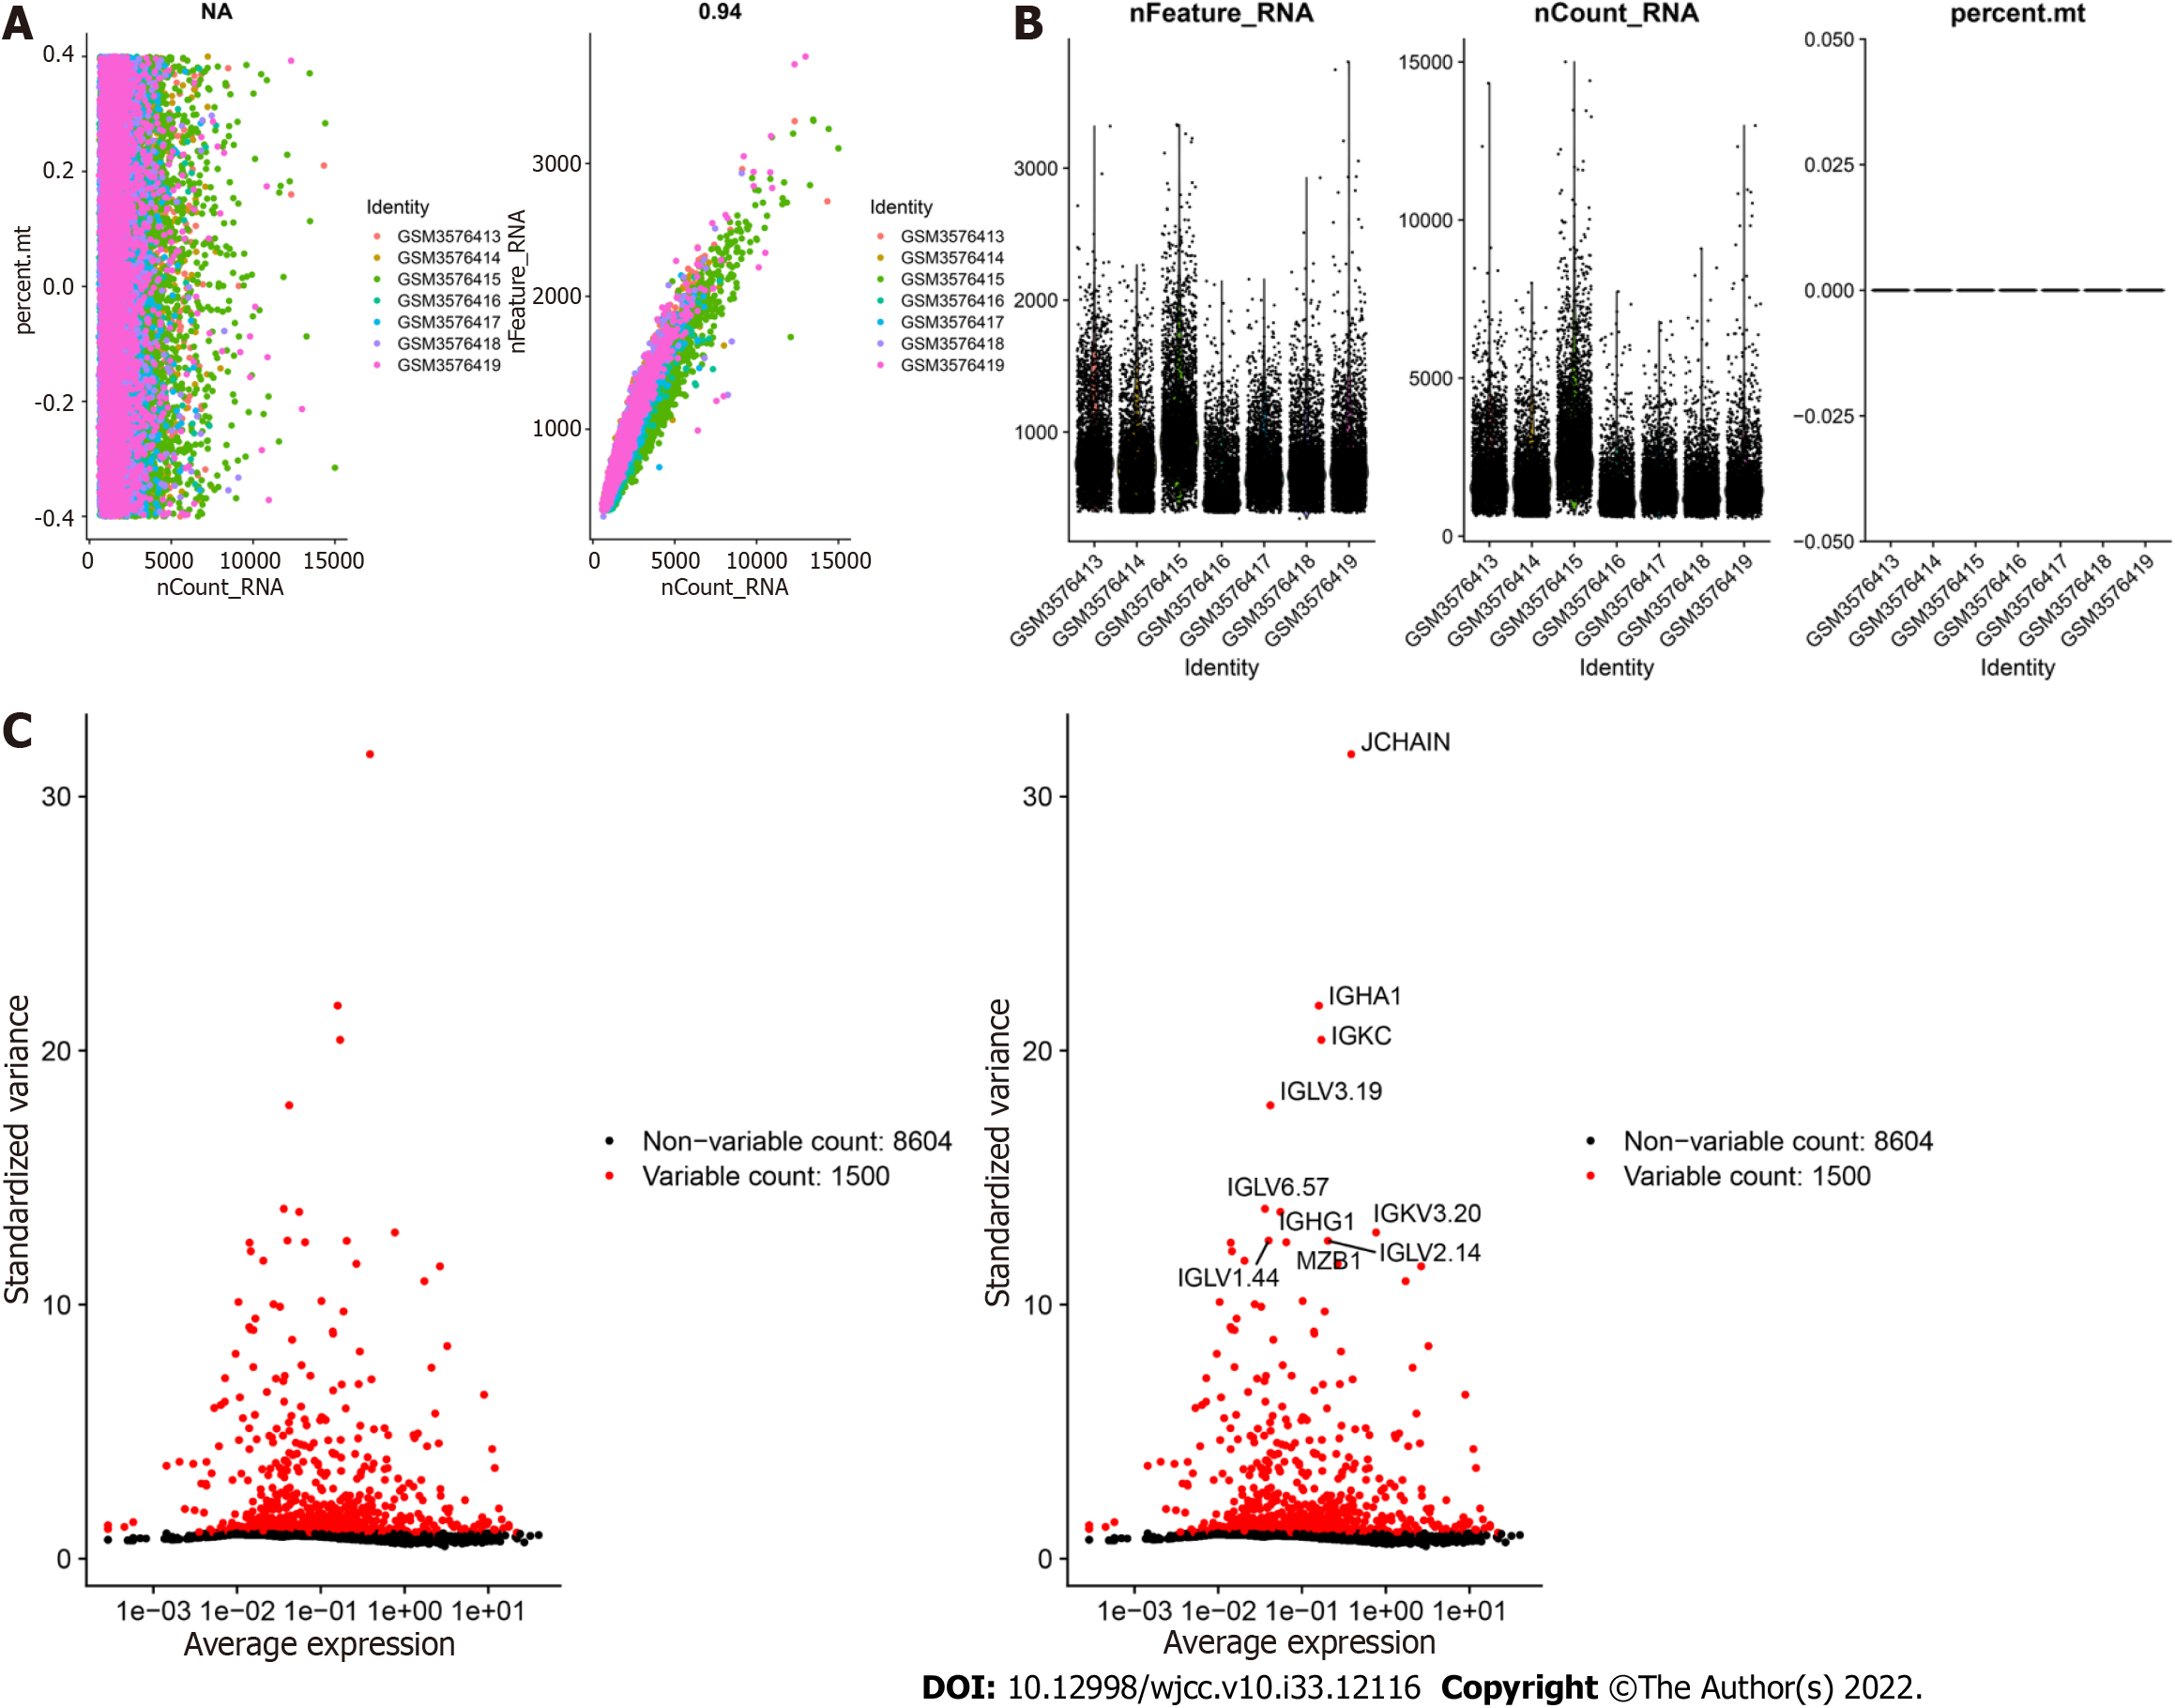
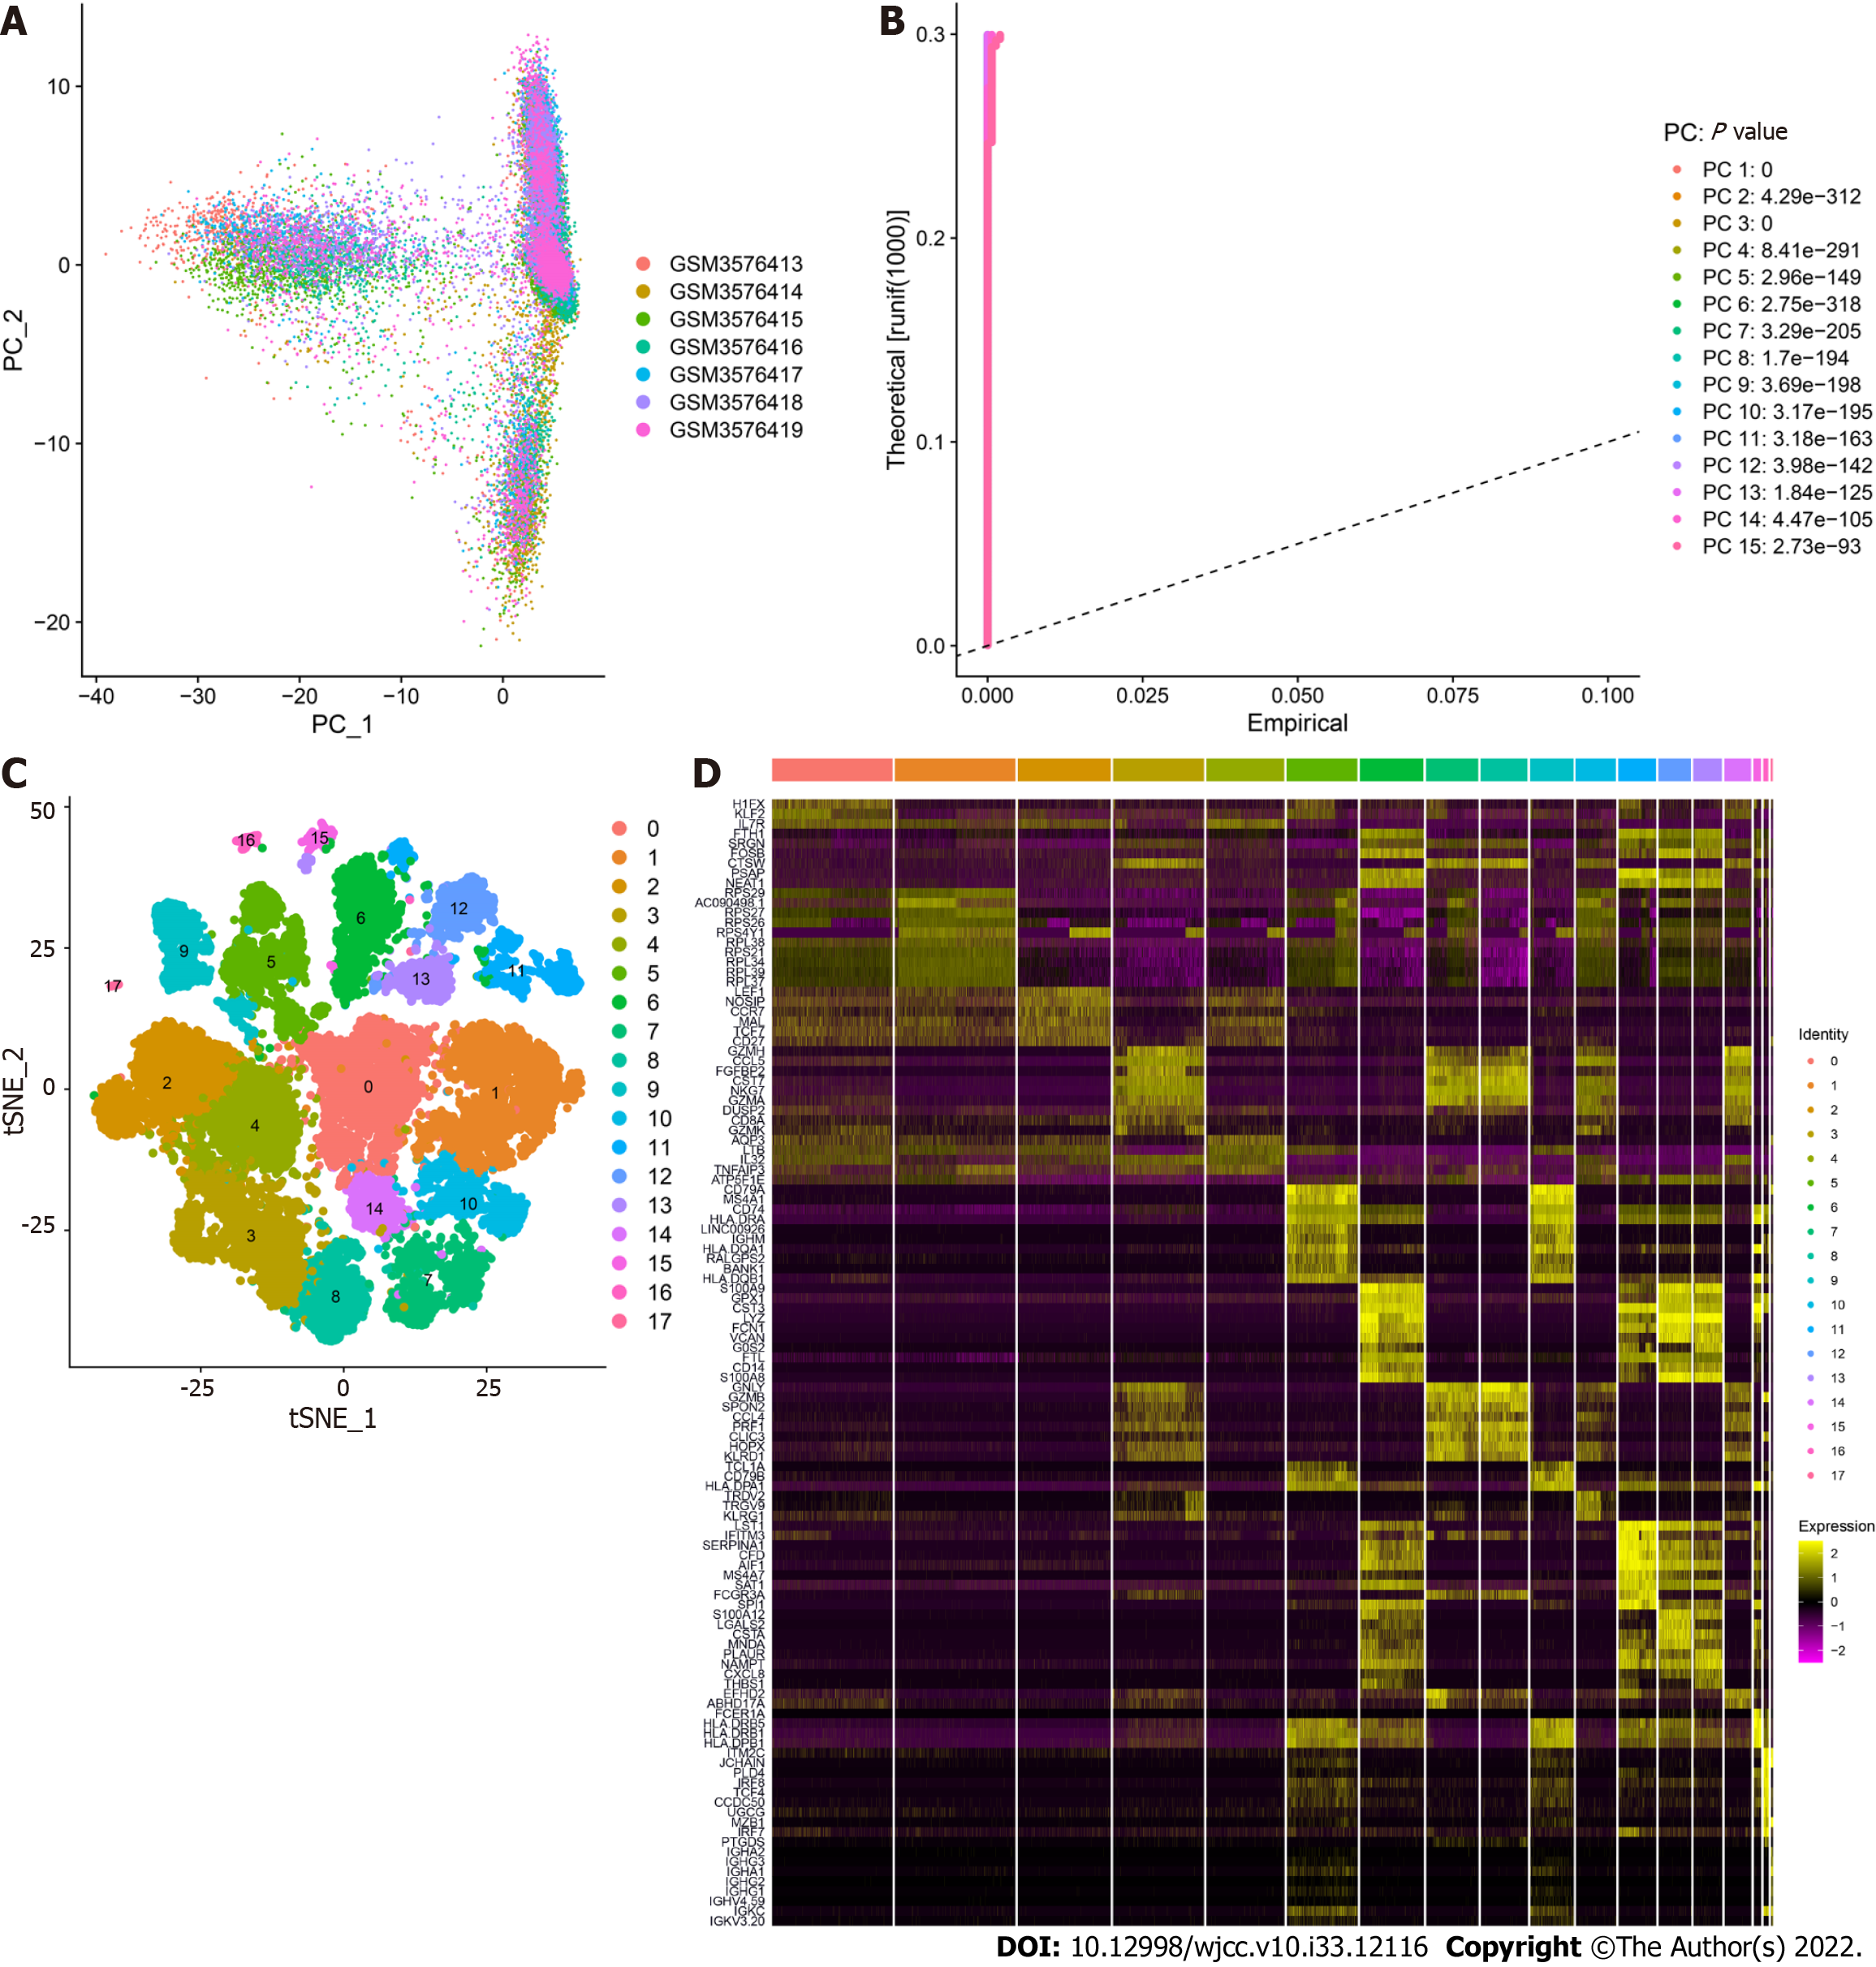
GSE125527 contains 103 samples. In this analysis, PBMC sample data from 7 patients with UC were extracted and preliminarily screened using nFeature_RNA and nCount_RNA (nFeature_RNA > 50 and percent.mt < 5) (Figure 1A and B). Ultimately, data from 24340 cells were included, and the 10 genes with the highest standard deviation are displayed in Figure 1C. PCA dimensionality reduction analysis showed that the batch effect between samples was not obvious (Figure 2A), and the optimal number of PCs was calculated as 15 (Figure 2B). A total of 17 subgroups were ultimately obtained through TSNE analysis (Figure 2C). The marker genes with the most obviously different expression levels among subtypes are shown (Figure 2D).
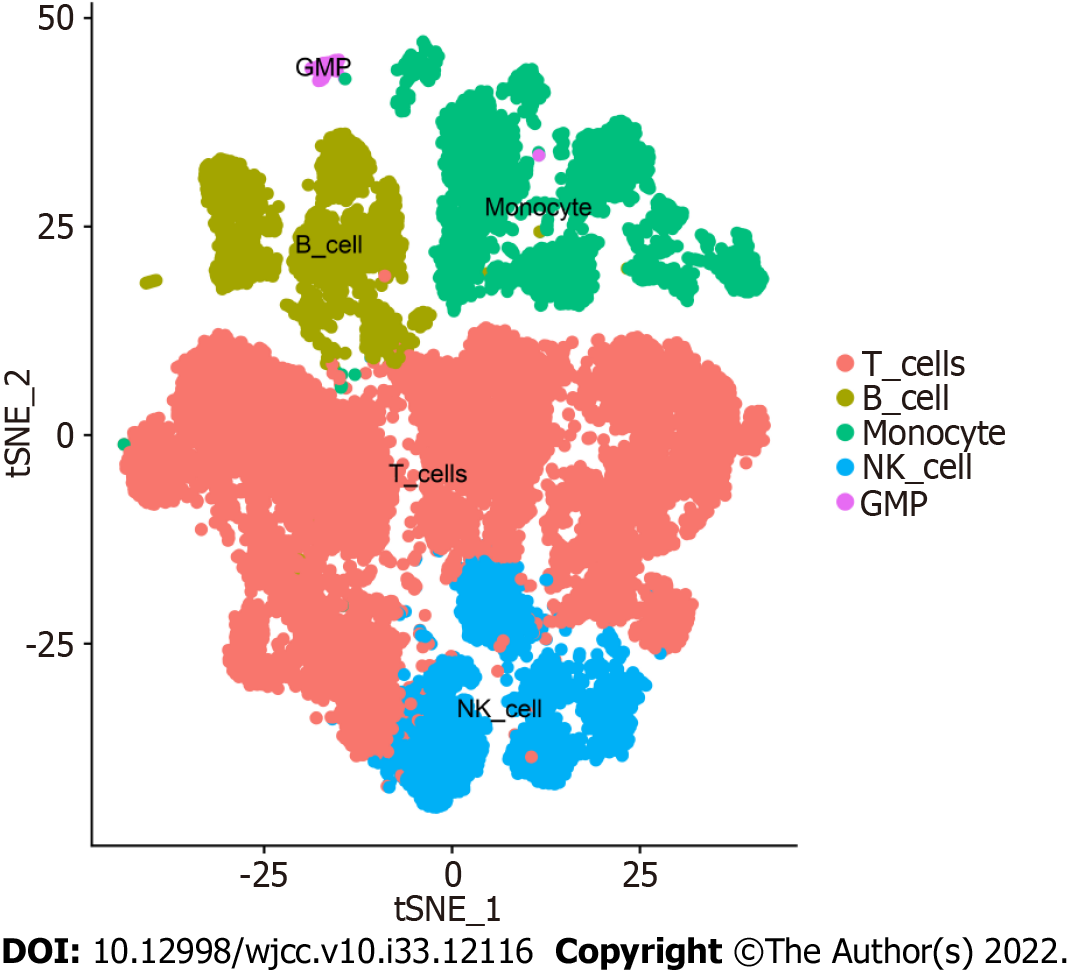
Overall, 17 clusters were annotated as five cell categories [T cells, B cells, monocytes, natural killer cells, and granulocyte-monocyte progenitors (GMPs)] using MonacoImmuneData as the annotation data file and the R package SingleR for each subtype (Figure 3). Ultimately, we extracted the marker genes unique to each cell subtype from the single-cell data using the FindAllMarkers function (cellMar
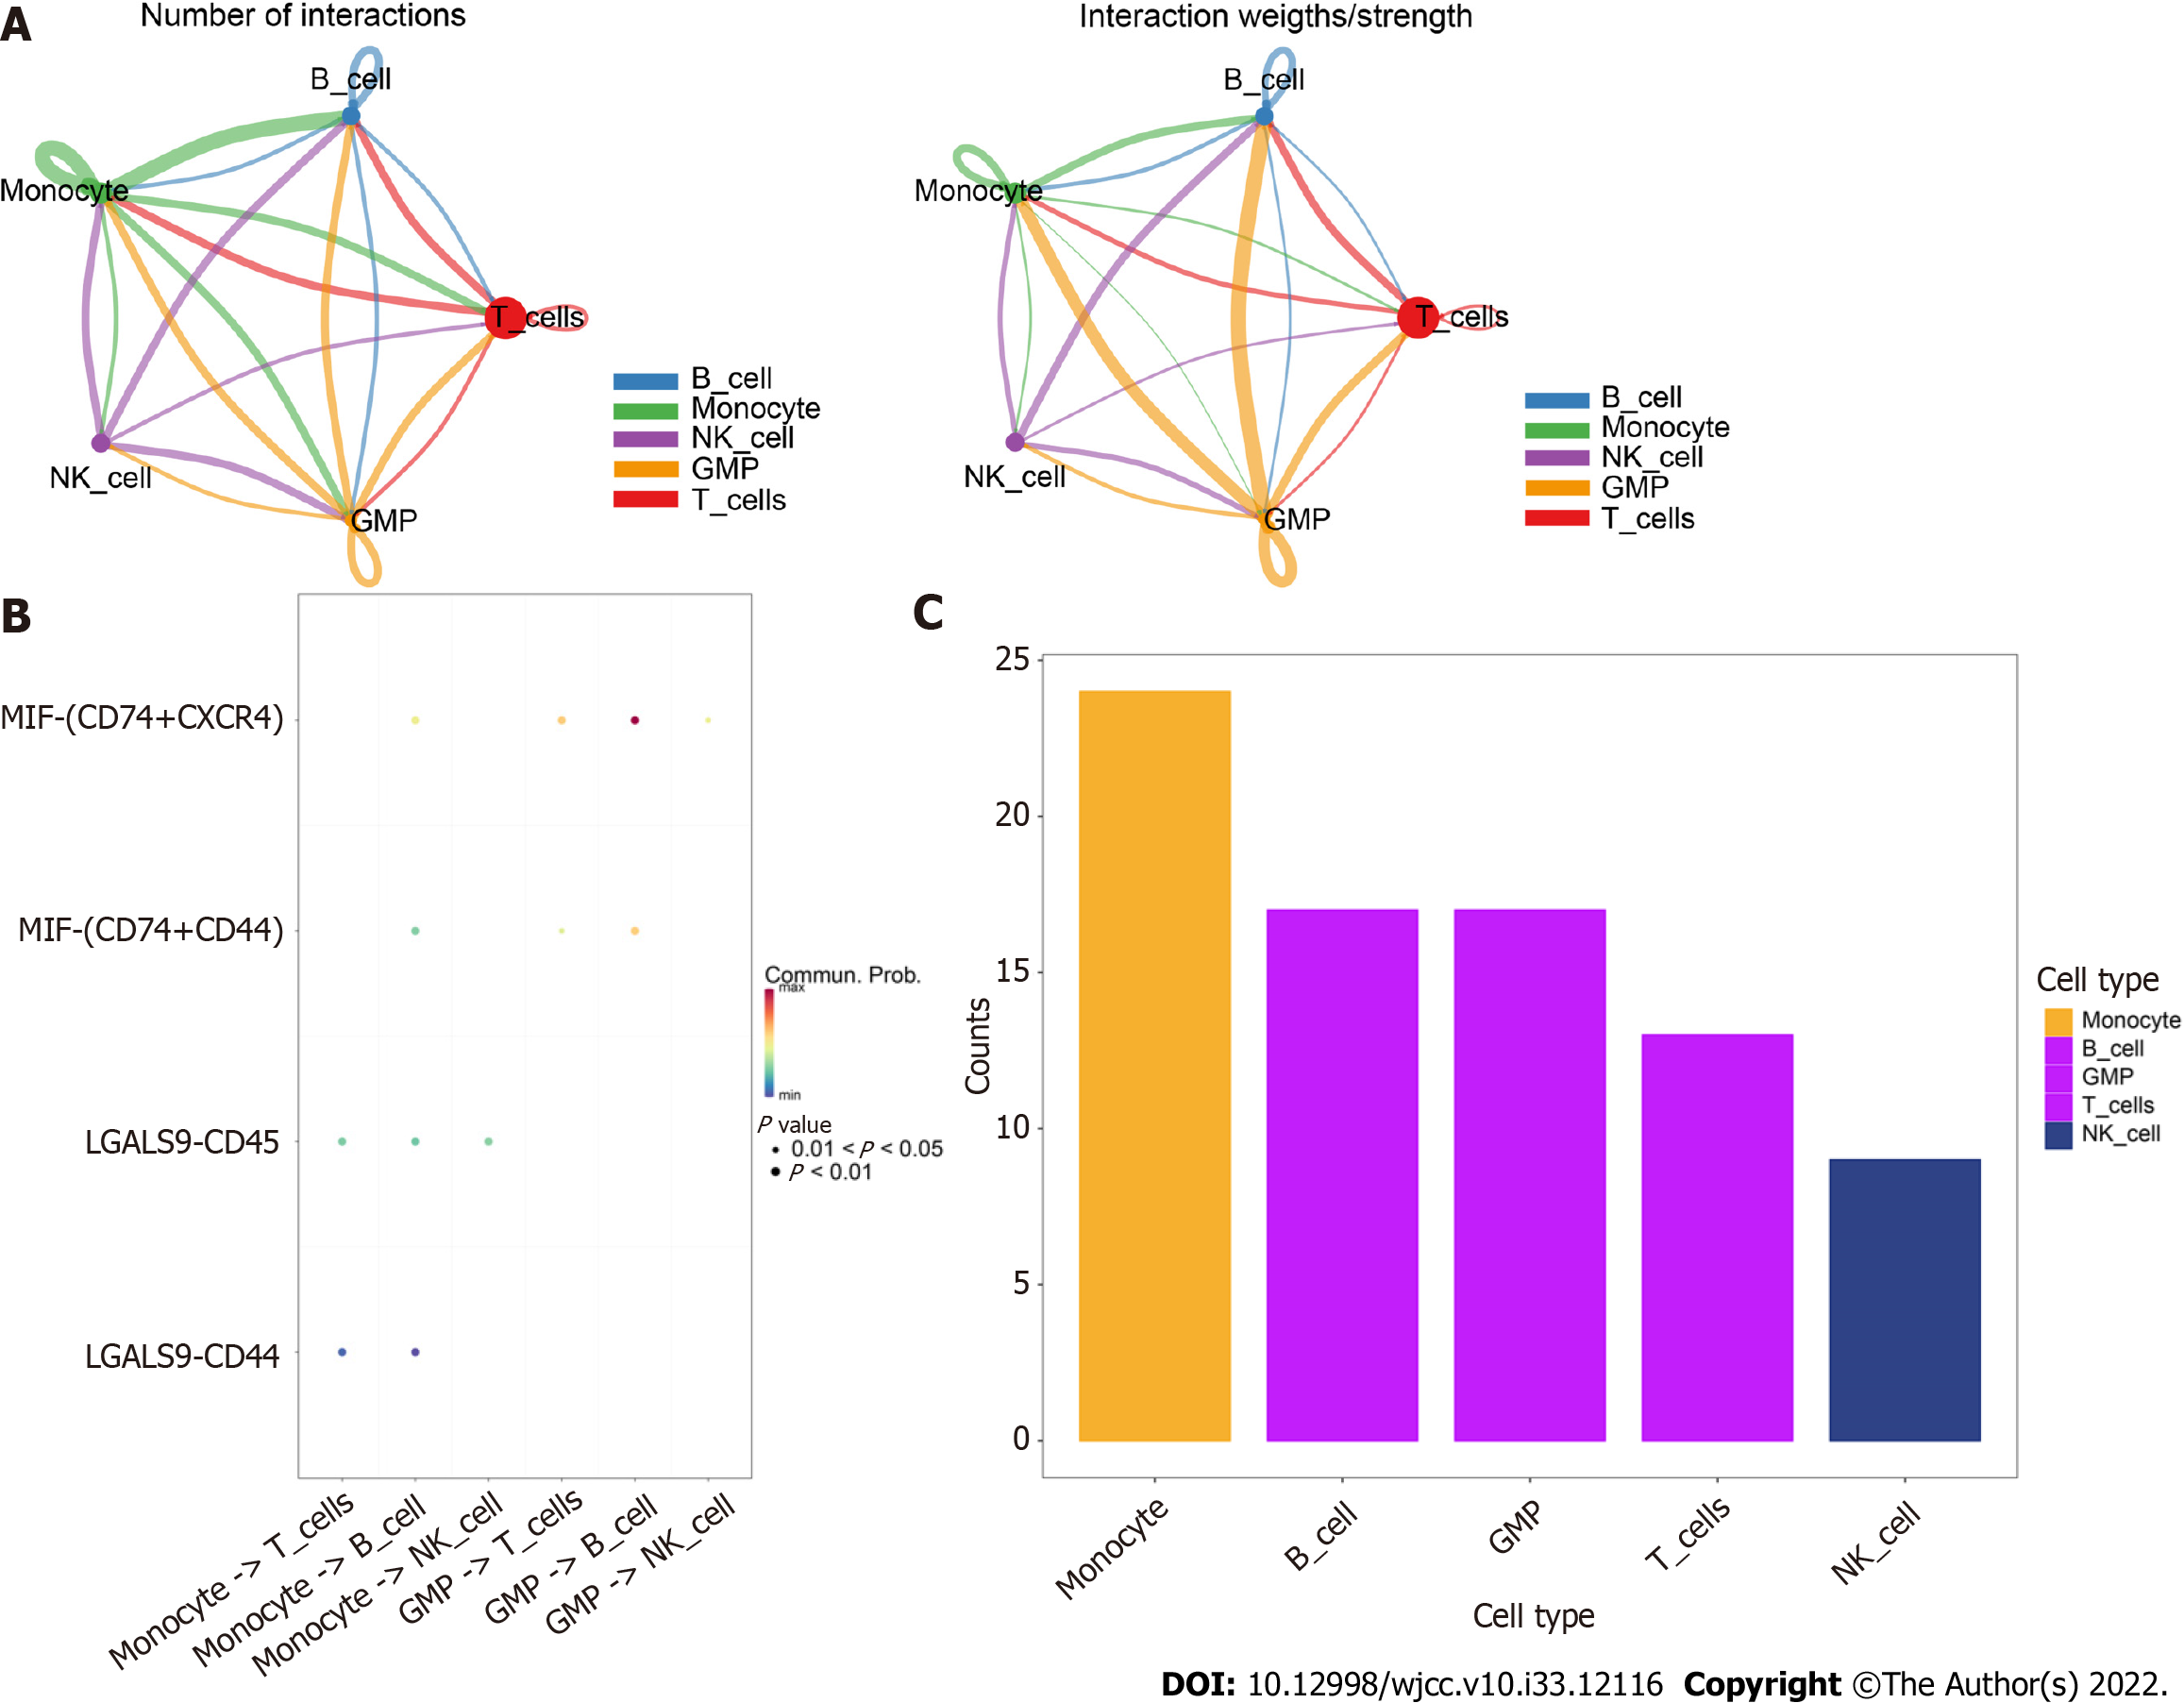
Using the software package CellChat, we analyzed the ligand−receptor relationships in the single-cell expression profiles and found complex interactions between the cell subtypes (Figure 4A). We found that monocyte −> B cell, GMP −> T cell, GMP −> B-cell and MIF-CD74+CXCR4+ cell −> MIF-CD74+CD44+ cell interactions had high scores (Figure 4B). Furthermore, we found that cells such as monocytes, B cells, and GMPs exhibited close potential interactions with other cells (Figure 4C). Therefore, we selected monocyte marker genes as the candidate gene set for the prediction model.
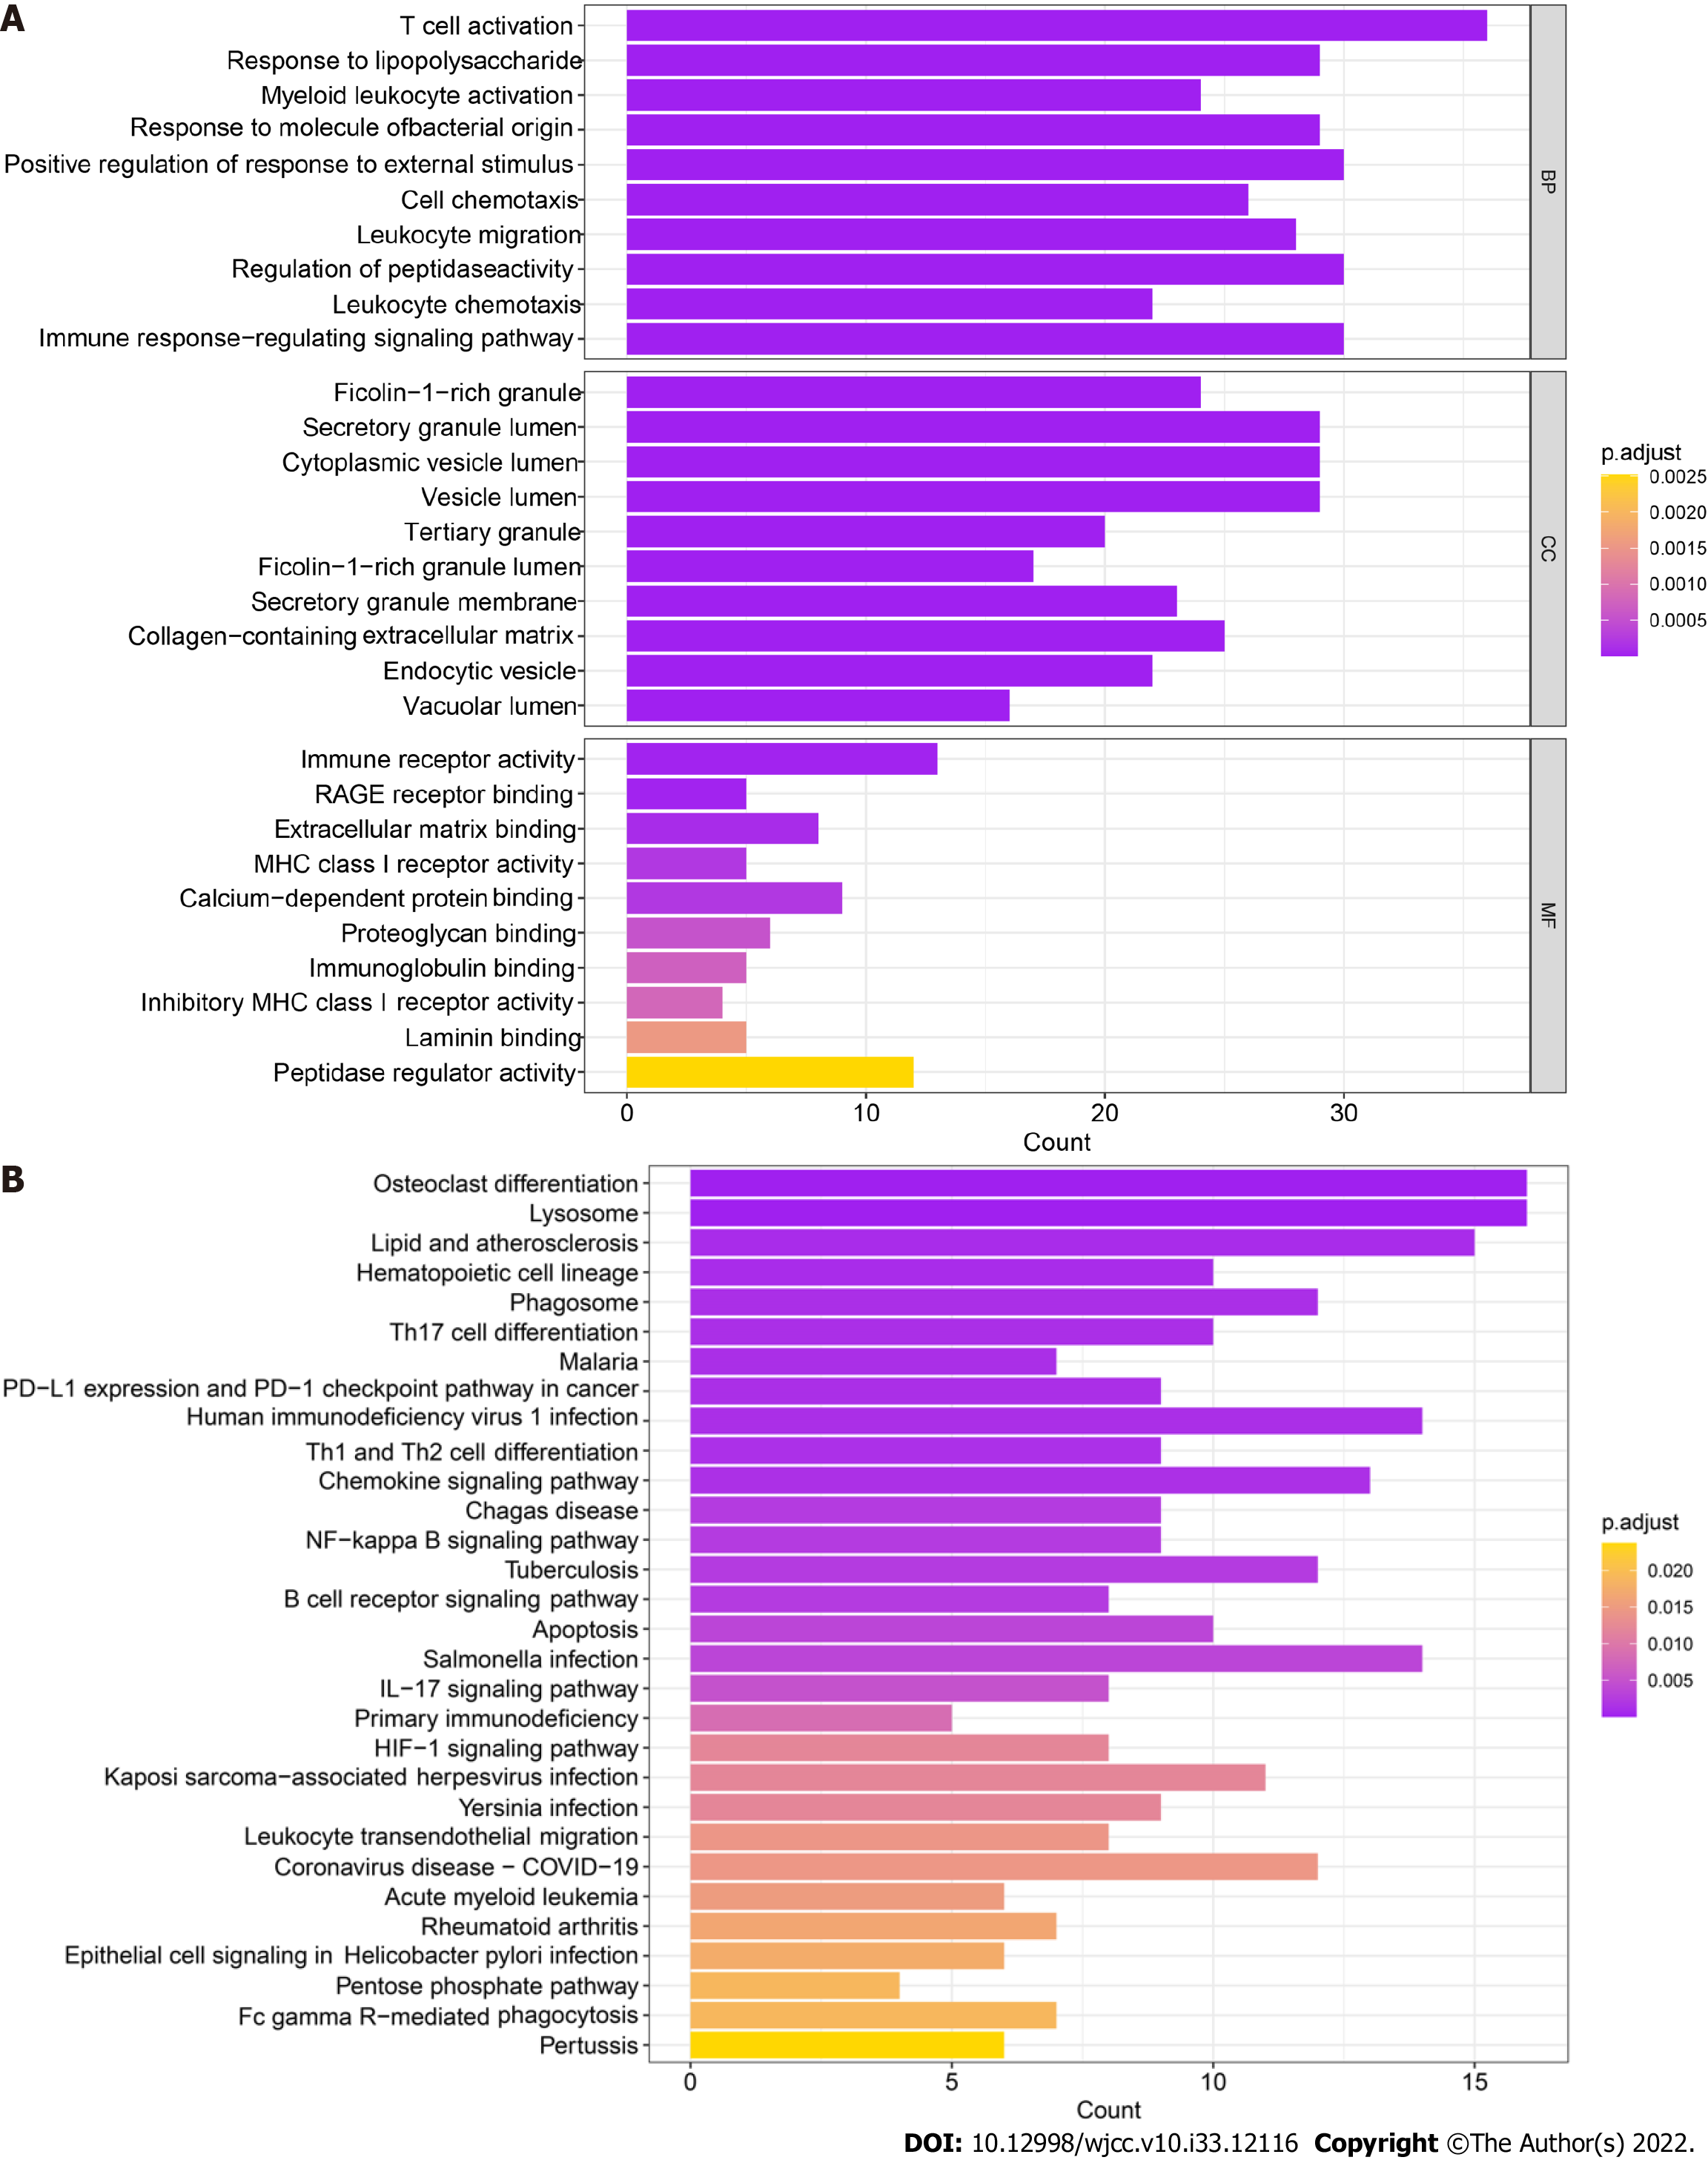
The 259 candidate gene sets were analyzed. The GO results showed that the main enriched pathway terms were cell chemotaxis, leukocyte migration, immune response-regulated signaling pathway, regulation of peptidase activity, immune receptor activity, MHC class I receptor activity, proteoglycan binding, immunoglobulin binding, inhibitory MHC class I receptor activity, and peptidase regulator activity (Figure 5A). The KEGG results showed that the main enriched pathway terms were Th17-cell differentiation, Th1- and Th2-cell differentiation, chemokine signaling pathway, NF-kappa B signaling pathway, apoptosis, primary immunodeficiency, HIF-1 signaling pathway, and IL-17 signaling pathway (Figure 5B).
We used GSE3365 as the training set and GSE126124 as the validation set and selected 259 monocyte cell markers for feature screening by LASSO regression. LASSO regression identified 43 genes as characteristic genes of UC, and a prediction model was constructed (Figure 6A-C). The results indicated that the prediction model with 43 genes had the best diagnostic efficacy, with an area under the curve (AUC) of 1 (Figure 6D-E). We further validated the diagnostic model with the GSE126124 dataset. The results showed that the model had strong stability, with an AUC of 0.8305.
To identify the core genes affecting the progression of UC, we constructed a WGCNA network based on the genes with top 5000 variance values in the GSE3365 dataset to explore relevant coexpression networks in UC. The soft threshold was set to 3 (Figure 7A, B). The gene modules were detected based on the TOM, and a total of 12 gene modules were detected (Figure 7C): black (120), blue (942), brown (797), cyan (134), green (251), magenta (82), pink (115), red (135), salmon (57), tan (59), turquoise (1832), and yellow (476). The black module had the highest correlation (cor= -0.7, P = (3e-11)) (Figure 7D). We mapped 120 genes from the black module to 43 LASSO models and obtained three common genes: RhoB, cathepsin D (CTSD), and zyxin (ZYX) (Figure 7E).
By analyzing the relationship between the core genes and immune infiltration in the GSE3365 dataset, we further explored the potential molecular mechanisms through which the core genes affect disease progression. The content of immune cells and the interactions between immune cells are shown (Figure 8A and B). The results suggested that the levels of monocytes and neutrophils were significantly higher in the UC group than in normal patients, whereas the levels of memory B cells and resting NK cells were lower in the UC group than in normal patients (Figure 8C). The three core genes were strongly correlated with immune cells levels (Figure 8D-F).
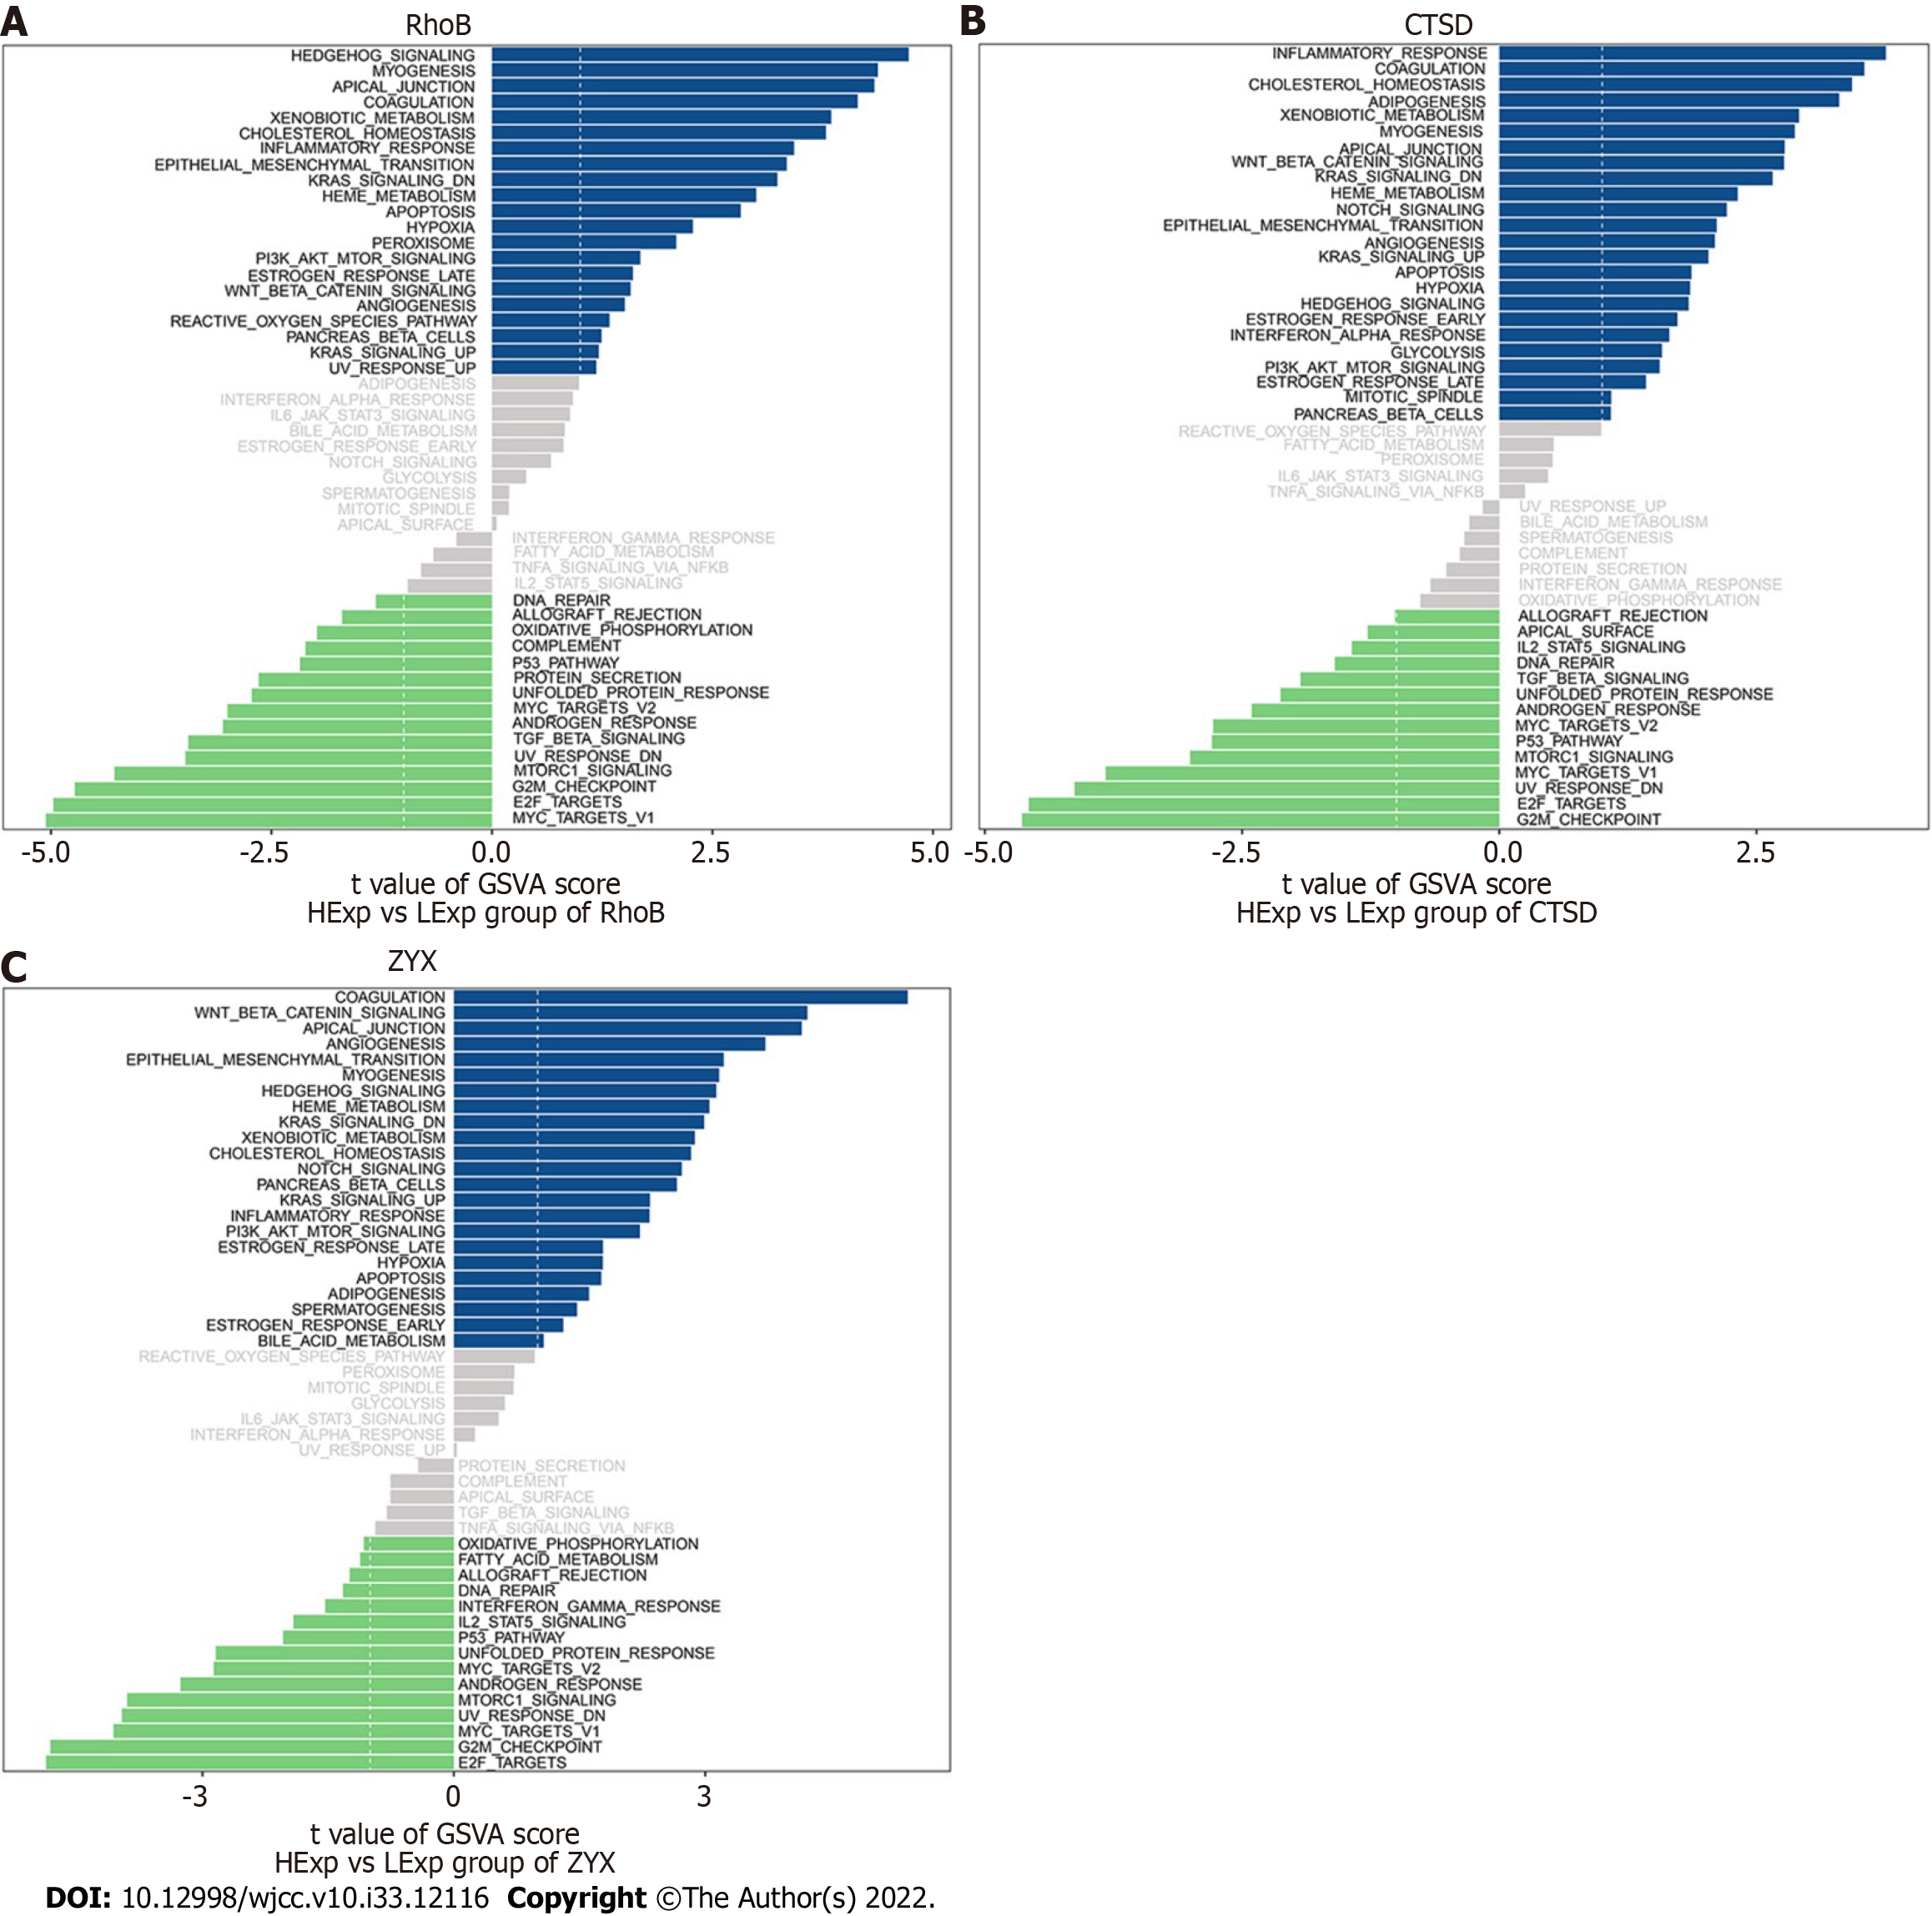
We subsequently studied the specific signaling pathways related to the three core genes to explore the potential molecular mechanisms through which the core genes affect the progression of UC. The GSVA results indicated that the three core genes with high expression were enriched in the terms KRAS signaling down, epithelial−mesenchymal transition (EMT), angiogenesis, and KRAS signaling up, whereas the three core genes with low expression were enriched in the terms transforming growth factor (TGF) beta signaling, unfolded protein response (UPR), androgen response, MYC target V2, p53 pathway, mTOR signaling, UV response down, and E2F targets, which suggests that the core genes may affect the progression of UC (Figure 9A-C).
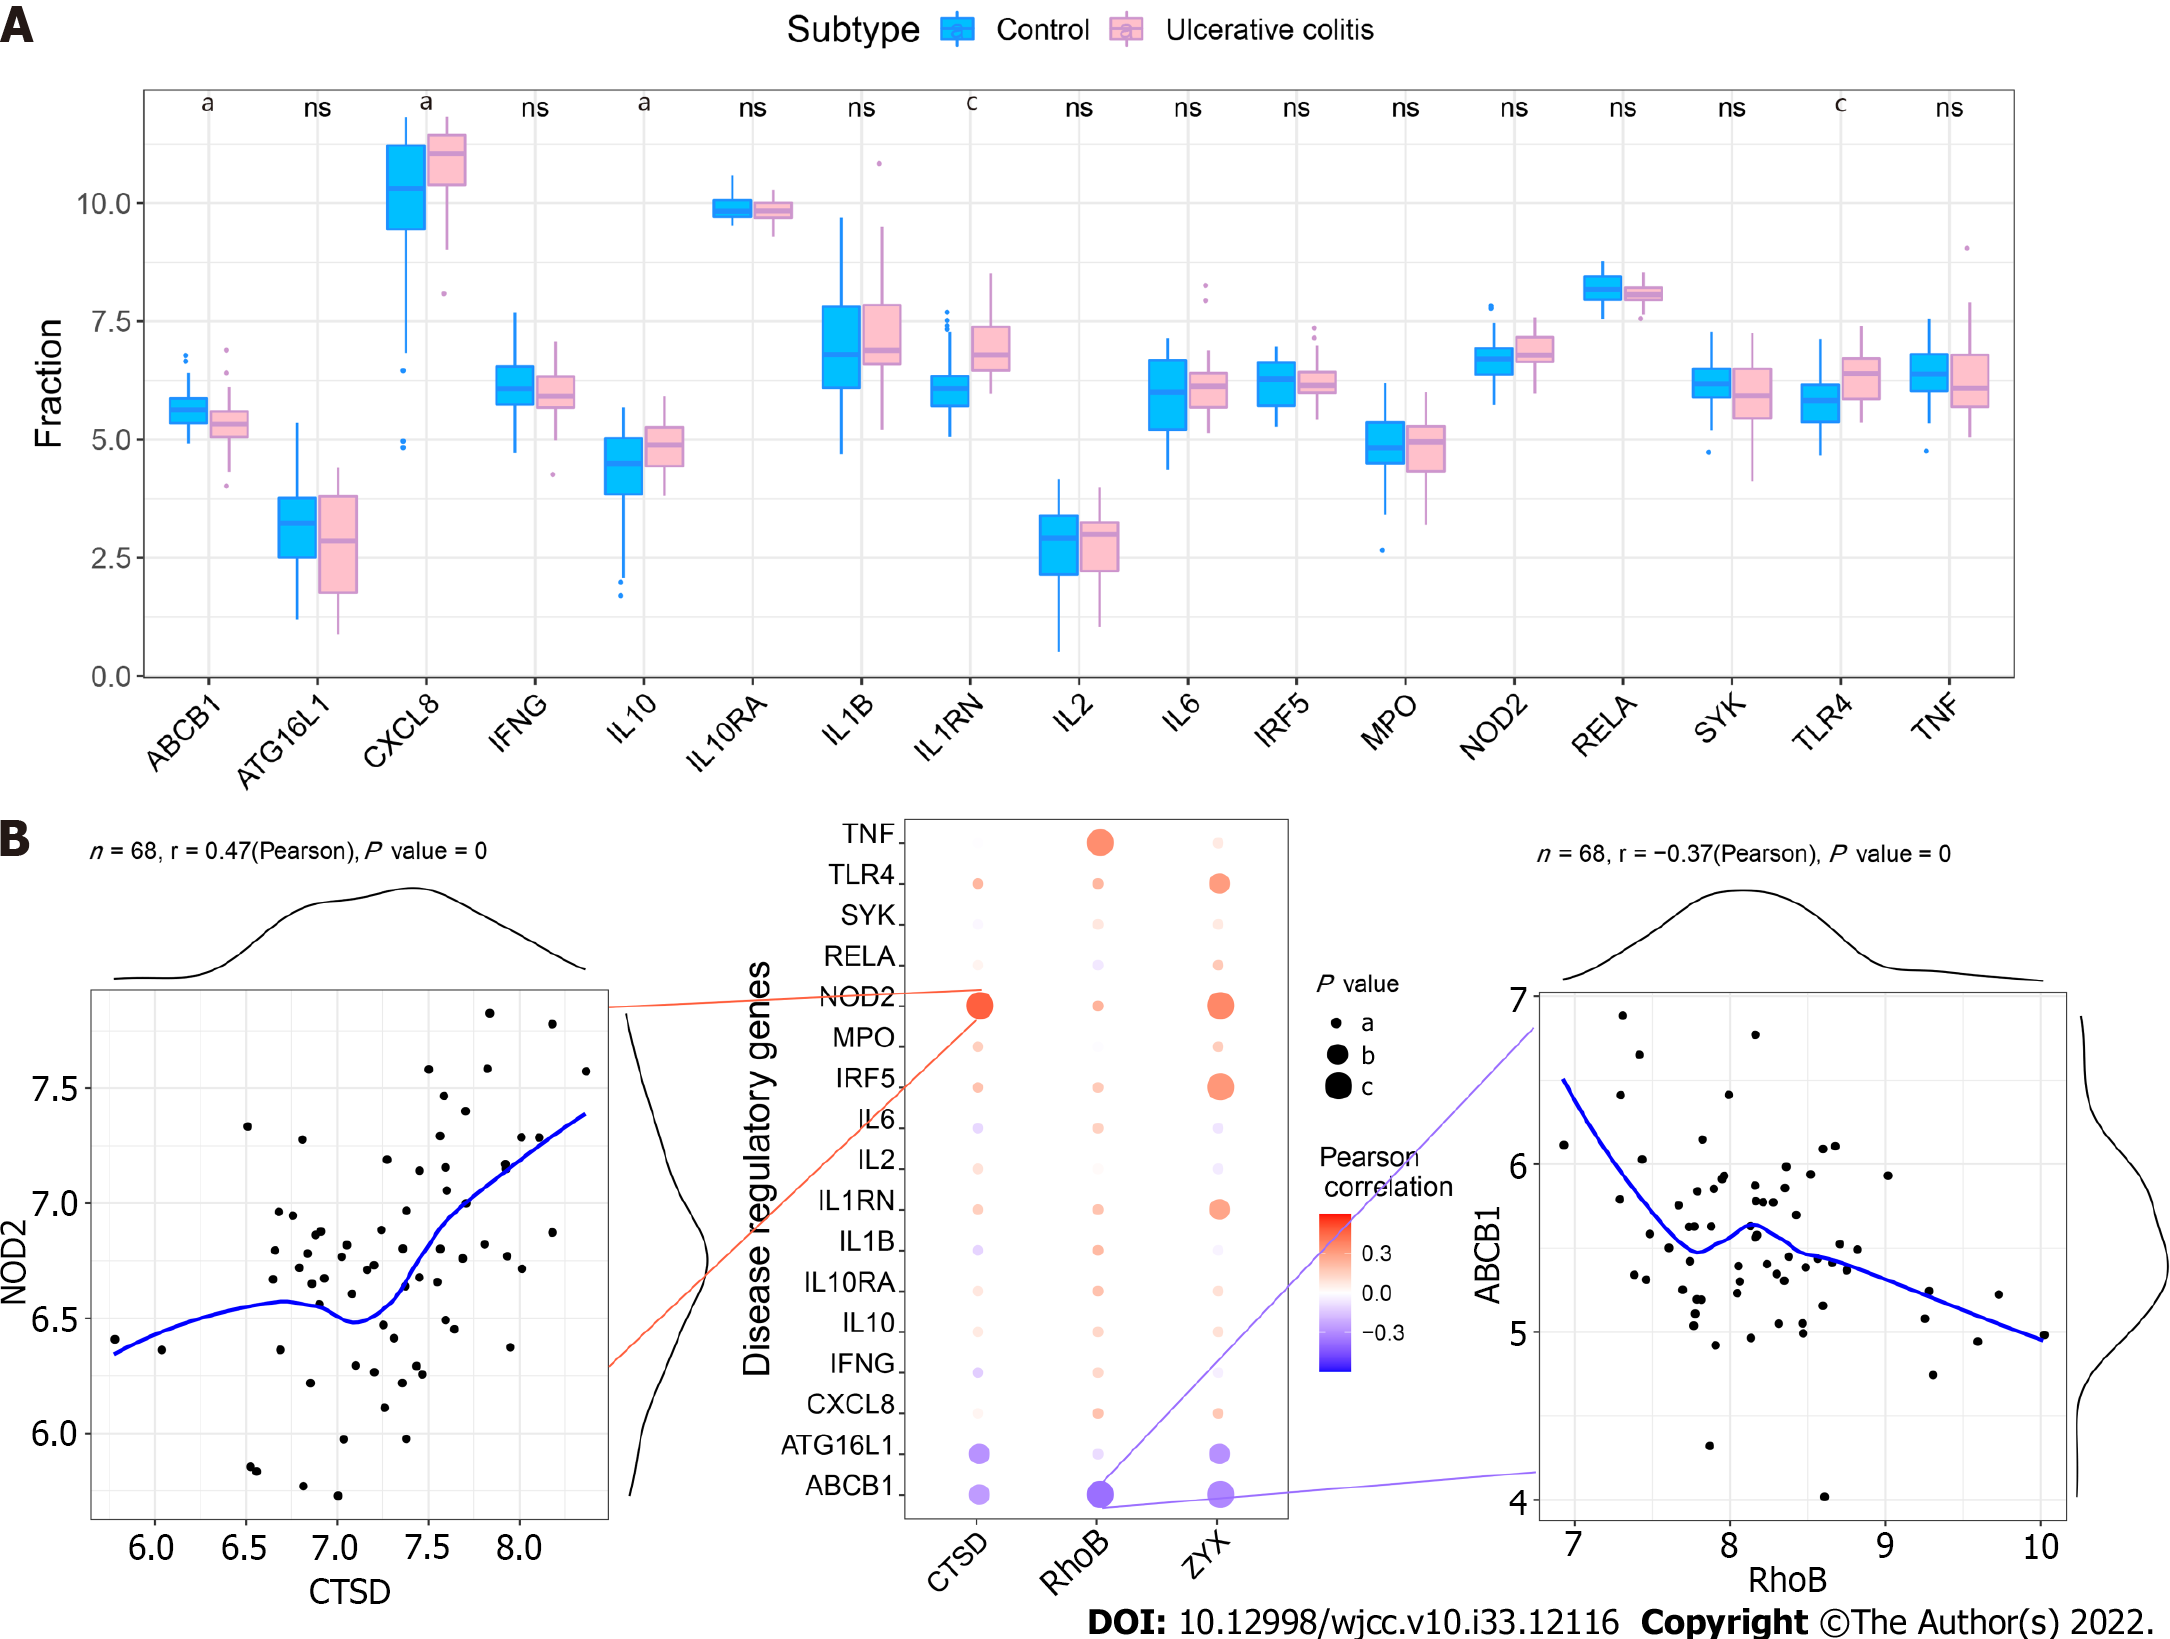
We obtained UC regulatory genes through the GeneCards database and analyzed the differences in the expression of the disease regulatory genes. The results showed that ABCB1, CXCL8, IL10, IL1RN and TLR4 exhibited significant differences between the two groups (Figure 10A). To explore the relationship between the core genes and the disease regulatory genes, we analyzed the correlations between the two gene types. The results showed that CTSD was significantly positively correlated with NOD2 (Pearson r = 0.47) and that RhoB was significantly negatively correlated with ABCB1 (Pearson r =-0.37) (Figure 10B).
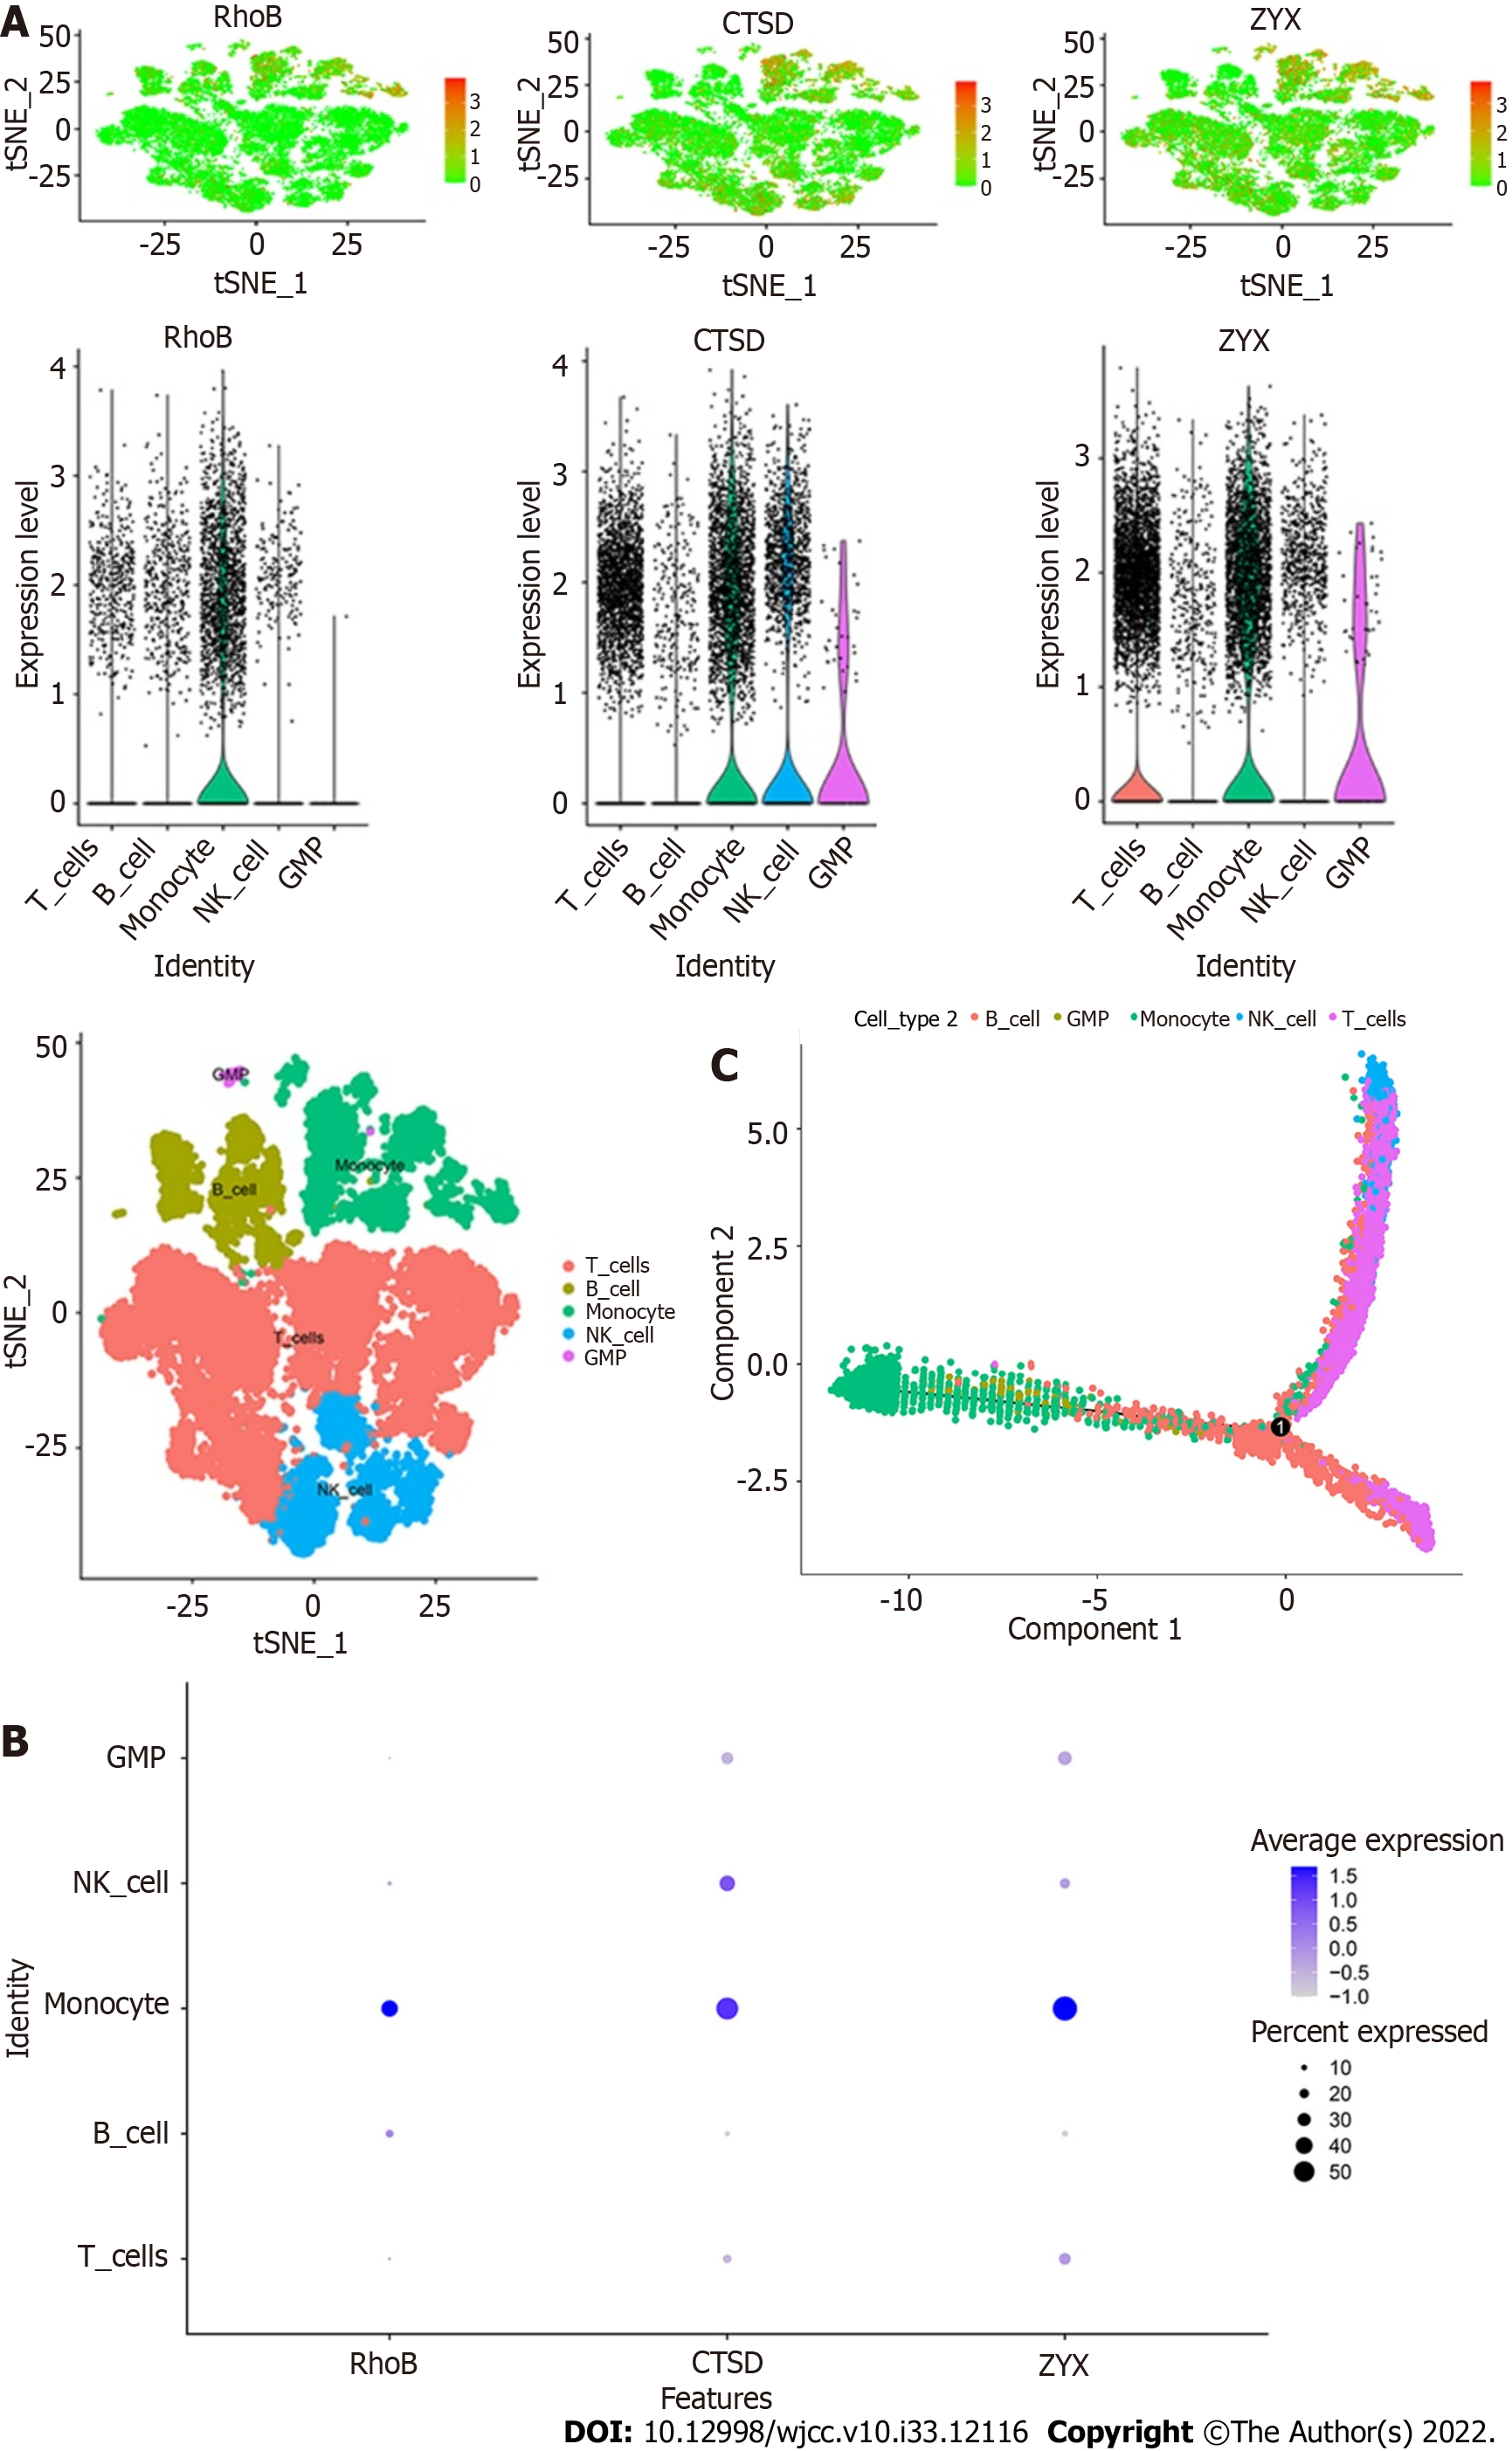
The expression of the three core genes, RhoB, CTSD, and ZYX, in the five immune cell types is shown in the figures. All three core genes were highly expressed in monocytes (Figure 11A and B). In addition, the results of the trajectory analyses of the five cell types are shown in the figures. Monocytes and GMPs were mainly concentrated on the left side, B cells were mainly concentrated on the lower half, and T cells and NK cells were mainly concentrated on the upper half (Figure 11C).
The course of UC is prolonged, and UC is difficult to cure and is recognized as a refractory disease by the World Health Organization. UC treatment faces challenges such as interindividual heterogeneity and complex complications. It is necessary to constantly improve biological treatment strategies to extend the focus from the short-term treatment response to the ultimate goal of disease clearance[12,13]. Many prognostic markers of UC have been or are being verified. Potential prognostic markers include clinical, genetic, transcriptomic (in the intestine or blood), proteomic, and flora-related prognostic markers, among others. A variety of markers for predicting the efficacy of UC can be used to predict the response of patients to different treatments. Potential markers for predicting the efficacy of UC include single genes/proteins or combinations, specific cell subsets, and in vitro imaging features[14]. Therefore, improved disease classification, a deeper understanding of the natural history of disease, optimization of the design of cohort studies and clinical trials, integration of multiomics data, clinical data, environmental factors and other information, and verification of biological mechanisms can improve the UC precision medicine strategies used in clinical practice[15].
ScRNA-seq is the most important part of the Human Cell Map project. ScRNA-seq overcomes the defects in studying intercellular specificity within tissues using traditional sequencing technology and thus enables more in-depth studies of the nature of gene expression[16]. By scRNA-seq, Smillie et al[17] identified 51 cell subsets from the intestinal mucosa of UC patients, mainly epithelial, stromal and immune cells. Among them, M-like cells, inflammatory monocytes, inflammation-associated fibroblasts (IAFs), and CD8+IL-17+ T cells were increased in UC, indicating their key role in inflammation. Inflammatory monocytes and IAFs might mediate resistance to anti-TNF therapy by expressing oncostatin-M and its receptor, respectively. The presence of intercellular interactions explains the observed changes in the proportions of cell subsets. M-like cells, IAFs and inflammation-associated monocytes are key factors in the cellular interaction networks that function during disease. Using scRNA-seq data, Chen EN et al determined that adrenomedullin is expressed in activated fibroblasts and epithelial cells of UC patients. Interferon-γ is a key upstream regulator of mast cell gene expression. The regions of UC inflammation were found to feature MRGPRX2-mediated mast cell activation, and reduced activation was observed in samples with gene variants that protect against UC. These results led to the identification of a UC activation cell module and new therapeutic targets[18]. We analyzed scRNA-seq data from PBMC samples of UC patients and extracted marker genes specific for each cell subtype. We found that monocytes, B cells, and GMP cells exhibited closer potential interactions with other cells. Ultimately, we selected monocyte marker genes as the candidate gene set for the prediction model. Monocytosis and a low lymphocyte/monocyte ratio may be effective, noninvasive and low-cost biomarkers for identifying disease activity in patients with UC[19,20]. Previous studies have shown that reduced expression of CD162 is associated with endotoxemia and decreased binding of PLTs to monocytes via membrane CD162-CD62P, which are conducive to the inflammatory response of UC patients[21]. Not surprisingly, selective granulocyte and monocyte apheresis (GMA) combined with conventional therapy appears to be more effective than conventional therapy alone in inducing and maintaining remission in patients with UC[22,23]. By constructing a WGCNA network, we identified the three core genes of the coexpression network: RhoB, CTSD and ZYX. RhoB plays an essential role in regulation of the cell cycle and apoptosis, and highly homologous Rho GTPases differentially regulate the dynamics of intestinal endothelial barrier function[24]. Yang et al[25] found that miR-21 induces degradation of RhoB mRNA in UC patients, resulting in depletion of RhoB and damage to tight junctions in intestinal epithelial cells (IECs). Macrophages produce CTSD. Hausmann et al[26] found that CTSD expression is induced in inflammation-associated intestinal macrophages and that the presence of CTSD might contribute to mucosal damage in UC. Fischbeck et al[27] showed that sphingomyelin-induced apoptosis of IECs is mediated by ceramide and CTSD activation. This activation shortens the physiological life cycle of IECs and impairs key functions of the intestinal mucosal barrier: defense and nutrient absorption. The LIM domain protein ZYX was originally identified as a tiny actin cytoskeleton protein that regulates the assembly and repair of actin filaments. Other functions of ZYX discovered in recent decades suggest that it also plays an active role in the regulation of gene expression and cell differentiation[28]. By interacting with transcription factors such as nuclear matrix protein 4, ZYX can move from focal adhesions to the nucleus, respond to stretching, and regulate gene transcription. Dysfunction of ZYX in the nucleus appears to be associated with pathogenic effects and disease[29]. In intestinal diseases, ZYX promotes colon cancer through mitosis-related phosphorylation and cyclin-dependent kinase 8-mediated Yes-associated protein activation[30].
We studied the specific signaling pathways related to the three core genes (RhoB, CTSD, and ZYX). By analyzing the enriched pathways found in samples with high and low expression of these core genes, we identified pathways that are known to be involved in many challenges in the diagnosis and treatment of UC.
A variety of gene changes in intestinal mucosal cells in patients with UC are related to inflammatory cancer transformation. Mutations in tumor-related genes in intestinal epithelial cells and organ systems can be attributed to the effects of inflammatory cytokines and reactive oxygen species. In addition, epigenetic changes and changes in miRNA levels increase inflammation and epithelial cell regeneration and exacerbate UC-related colorectal cancer. Therefore, there is a need for drugs or maintenance treatment to control inflammation more effectively, and colonoscopy screening and gene monitoring strategies need to be improved to manage dysplasia. (1) The KRAS signaling pathway and p53 signaling pathway are involved in UC-associated colorectal cancer. Patients with UC have an increased risk of dysplasia and cancer, and this risk is associated with the duration, extent and severity and/or persistence of inflammatory activity in the disease[31]. A meta-analysis showed that the cumulative incidence of UC-associated colorectal cancer is 0.1%, 2.9% and 6.7% after 10, 20 and 30 years of UC, respectively[32]. Multiple genetic changes in intestinal mucosal cells of UC patients have been associated with inflammatory-cancer transformation. Mutations in tumor-associated genes in IECs and organ systems can affect the actions of inflammatory cytokines and reactive oxygen species. Furthermore, epigenetic changes and altered levels of miRNAs increase inflammation, IEC regeneration and the rate of UC-associated colorectal cancer. Therefore, there is a need for better medications or maintenance treatment strategies to control inflammation more effectively and to improve colonoscopy screening and gene monitoring strategies to manage dysplasia; (2) UC is involved in epithelial EMT-related changes, and the TGF-β signaling pathway causes intestinal fibrosis. Intestinal fibrosis is an inevitable process in the development of UC. The pathological changes include excessive synthesis and abnormal deposition of collagen-based extracellular matrix in the intestinal tissue, which leads to intestinal stenosis and even intestinal obstruction, perforation and fistulae and eventually requires surgical treatment. Five percent of UC patients require surgery for fibrosis. The TGF-β/Smad signaling pathway is the classical pathway that influences EMT-related fibrosis and is associated with other pathways that cause EMT[33]. Blocking EMT by inhibiting the activation of the TGF-β/Smad pathway is a key strategy for the prevention and treatment of UC fibrosis; and (3) The mechanism through which endoplasmic reticulum stress (ERS)-induced autophagy interferes with damage to IECs in the pathogenesis of UC involves the UPR and the mTOR signaling pathway[34]. The efficacy of the classical immunosuppressive agent azathioprine in treating UC might be related to its ability to modulate mTORC1 signaling and induce autophagy via the UPR sensor protein kinase R-like ER kinase (PERK)[35]. Therefore, focusing on these gene targets, effectively regulating ERS autophagy, alleviating IEC damage, reducing the impairment of intestinal mucosal barrier function, and maintaining intestinal homeostasis will provide potential new targets and more efficient therapeutic options for the treatment of UC.
Immune infiltration in the microenvironment mainly involves immune cells, extracellular matrix, various growth factors, inflammatory factors and specific physicochemical characteristics that significantly affect the diagnosis and clinical treatment sensitivity of the disease. Arriola et al[36] evaluated the infiltration of CD8+ and FoxP3+ immune cells and granzyme B (GzmB) expression in colon biopsies of 20 patients with ipilimumab-related colitis. The researchers found that the counts of CD8+, FoxP3+ and GzmB+ T cells were significantly higher in patients with ipilimumab-related colitis than in healthy controls. Patients requiring infliximab for colitis had significantly higher CD8+/FoxP3+ ratios than those treated with steroids only, and the severity was related to clinical symptoms. Remission of colitis was associated with decreased CD8+ and FoxP3+ cells in patients treated with steroids and infliximab. A previous study showed that the counts of cytotoxic T cells and regulatory T (Treg) cells in the colonic mucosa of patients treated with ipilimumab were associated with clinical characteristics and could thus be used to predict disease severity and guide treatment. Lei et al[37] found that the abundances of cytotoxic T cells, exhausted T cells, type 1 regulatory T cells (Trl cells), induced regulatory T (iTreg) cells, Th1 cells, central memory T cells, DCs, B cells, monocytes and macrophages were generally higher in UC samples than in healthy control samples, whereas the abundances of naïve CD8+ T cells, Th2 cells, effector memory T cells, NKT cells, mucosal-associated invariant T cells (MAIT cells), NK cells, neutrophils and CD8+ T cells were lower in UC samples than in healthy control samples . Immune infiltration has also been used to study the interaction between sensory nerves and the immune response in colitis. These findings highlight the complexity of visceral sensory nerve immune interactions in pain relief and recurrent diseases[38].
Our study found that UC patients exhibit significantly higher numbers of monocytes and neutrophils and lower numbers of memory B cells and resting NK cells than in normal patients. The results of our study suggest that many infiltrating immune cells, including monocytes, neutrophils and inflammatory cells, are activated in the peripheral blood of UC patients, and these cells are recruited and activated by many upregulated chemokines and cytokines in the mucosa of UC patients to further promote inflammation and injury in active disease. The dysregulation of B-cell differentiation and the insufficient immune response mediated by adaptive T cells in NK cells results in nonselective phagocytosis of leukocytes, infiltration of the mucosal epithelium by a large number of antigens and disruption of immune homeostasis, which are also related to the mechanisms of recurrence of UC.
The expression of RhoB, CTSD and ZYX is also associated with the immune response. Knockdown of RhoB expression markedly decreases Toll-like receptor (TLR) ligand-induced activation of mitogen-activated protein kinases and nuclear factor-κB (NF-κB) and the production of TNF-α, IL-6 and IL-1β in macrophages stimulated with TLR ligands[39]. Yadati et al[40] found that extracellular CTSD inhibition switches the systemic immune status of mice to an anti-inflammatory profile. Podosomes consist of a protrusive actin-rich core and an adhesive integrin-rich ring that contains adaptor proteins such as vinculin and zyxin and could potentially be further exploited to study processes at the ventral plasma membrane of immune cells[41]. RhoB is related to monocytes/macrophages in human traumatic brain injury and myelodysplastic syndrome, and CTSD is related to monocytes/macrophages in Alzheimer’s disease and myocardial infarction[42-45]. These genes are potential diagnostic markers and therapeutic targets for intervention.
Through scRNA-seq, LASSO diagnostic model building and WGCNA, we identified RhoB, CTSD and ZYX as core genes of UC that are closely related to monocyte infiltration and could be used as diagnostic markers and molecular targets for UC therapeutic intervention.
Single-cell RNA sequencing (scRNA-seq) can be used to rapidly obtain the precise gene expression patterns of thousands of cells in the intestine, analyze the characteristics of cells with the same phenotype, and provide new insights into the growth and development of intestinal organs, the clonal evolution of cells, and immune cell changes. These findings can provide new ideas for the diagnosis and treatment of intestinal diseases.
To reveal diagnostic markers of ulcerative colitis (UC) with the aim of providing experimental research ideas and a theoretical basis for the discovery of new UC molecular mechanisms and therapeutic drugs.
To identify clinical phenotypes and biomarkers that could predict the response of UC patients to specific therapeutic drugs and thus aid the diagnosis and treatment of UC.
Using the Gene Expression Omnibus database, through scRNA-seq analysis, least absolute shrinkage and selection operator (LASSO) diagnostic model building and weighted gene correlation network analysis (WGCNA), we analyzed peripheral blood cell subtypes of patients with UC by scRNA-seq combined with bulk RNA sequencing (RNA-seq) to reveal the core genes of UC.
After processing the scRNA-seq data, we obtained data from approximately 24340 cells and identified 17-cell types. Through intercellular communication analysis, we selected monocyte marker genes as the candidate gene set for the prediction model. Construction of a WGCNA coexpression network identified RhoB, cathepsin D (CTSD) and zyxin (ZYX) as core genes. Immune infiltration analysis showed that these three core genes were strongly correlated with immune cells. Functional enrichment analysis showed that the differentially expressed genes were closely related to immune and inflammatory responses, which are associated with many challenges with the diagnosis and treatment of UC.
Through scRNA-seq, LASSO diagnostic model building and WGCNA, we identified RhoB, CTSD and ZYX as core genes of UC that are closely related to monocyte infiltration and could be used as diagnostic markers and potential molecular targets for UC therapeutic intervention.
Single-cell RNA-seq combined with bulk RNA-seq analysis of peripheral blood reveals the characteristics and key immune cell genes of UC.
Provenance and peer review: Unsolicited article; Externally peer reviewed.
Peer-review model: Single blind
Specialty type: Gastroenterology and hepatology
Country/Territory of origin: China
Peer-review report’s scientific quality classification
Grade A (Excellent): 0
Grade B (Very good): B, B
Grade C (Good): 0
Grade D (Fair): 0
Grade E (Poor): 0
P-Reviewer: Petrovic S, Serbia; Sitkin S, Russia S-Editor: Ma YJ L-Editor: A P-Editor: Zhao S
| 1. | Lasa JS, Olivera PA, Danese S, Peyrin-Biroulet L. Efficacy and safety of biologics and small molecule drugs for patients with moderate-to-severe ulcerative colitis: a systematic review and network meta-analysis. Lancet Gastroenterol Hepatol. 2022;7:161-170. [RCA] [PubMed] [DOI] [Full Text] [Cited by in Crossref: 267] [Cited by in RCA: 227] [Article Influence: 75.7] [Reference Citation Analysis (0)] |
| 2. | Keefer L, Bedell A, Norton C, Hart AL. How Should Pain, Fatigue, and Emotional Wellness Be Incorporated Into Treatment Goals for Optimal Management of Inflammatory Bowel Disease? Gastroenterology. 2022;162:1439-1451. [RCA] [PubMed] [DOI] [Full Text] [Cited by in Crossref: 10] [Cited by in RCA: 51] [Article Influence: 17.0] [Reference Citation Analysis (0)] |
| 3. | Yang L, Song X, Chen Y, Li Y, Gu Y, Wang X, Zhu L, Zhi M, Ouyang C, Guo H. Treatment Decision-making in Chinese Inflammatory Bowel Disease Patients. Inflamm Bowel Dis. 2022;28:S76-S84. [RCA] [PubMed] [DOI] [Full Text] [Cited by in Crossref: 2] [Cited by in RCA: 2] [Article Influence: 0.7] [Reference Citation Analysis (0)] |
| 4. | Le Berre C, Ricciuto A, Peyrin-Biroulet L, Turner D. Evolving Short- and Long-Term Goals of Management of Inflammatory Bowel Diseases: Getting It Right, Making It Last. Gastroenterology. 2022;162:1424-1438. [RCA] [PubMed] [DOI] [Full Text] [Cited by in Crossref: 9] [Cited by in RCA: 40] [Article Influence: 13.3] [Reference Citation Analysis (0)] |
| 5. | Rubin DT, Ananthakrishnan AN, Siegel CA, Sauer BG, Long MD. ACG Clinical Guideline: Ulcerative Colitis in Adults. Am J Gastroenterol. 2019;114:384-413. [RCA] [PubMed] [DOI] [Full Text] [Cited by in Crossref: 870] [Cited by in RCA: 1041] [Article Influence: 173.5] [Reference Citation Analysis (0)] |
| 6. | Raine T, Danese S. Breaking Through the Therapeutic Ceiling: What Will It Take? Gastroenterology. 2022;162:1507-1511. [RCA] [PubMed] [DOI] [Full Text] [Cited by in Crossref: 8] [Cited by in RCA: 80] [Article Influence: 26.7] [Reference Citation Analysis (0)] |
| 7. | Chapuy L, Sarfati M. Single-Cell Protein and RNA Expression Analysis of Mononuclear Phagocytes in Intestinal Mucosa and Mesenteric Lymph Nodes of Ulcerative Colitis and Crohn's Disease Patients. Cells. 2020;9. [RCA] [PubMed] [DOI] [Full Text] [Full Text (PDF)] [Cited by in Crossref: 10] [Cited by in RCA: 11] [Article Influence: 2.2] [Reference Citation Analysis (0)] |
| 8. | Li G, Zhang B, Hao J, Chu X, Wiestler M, Cornberg M, Xu CJ, Liu X, Li Y. Identification of Novel Population-Specific Cell Subsets in Chinese Ulcerative Colitis Patients Using Single-Cell RNA Sequencing. Cell Mol Gastroenterol Hepatol. 2021;12:99-117. [RCA] [PubMed] [DOI] [Full Text] [Full Text (PDF)] [Cited by in Crossref: 5] [Cited by in RCA: 23] [Article Influence: 5.8] [Reference Citation Analysis (0)] |
| 9. | Devlin JC, Axelrad J, Hine AM, Chang S, Sarkar S, Lin JD, Ruggles KV, Hudesman D, Cadwell K, Loke P. Single-Cell Transcriptional Survey of Ileal-Anal Pouch Immune Cells From Ulcerative Colitis Patients. Gastroenterology. 2021;160:1679-1693. [RCA] [PubMed] [DOI] [Full Text] [Cited by in Crossref: 15] [Cited by in RCA: 54] [Article Influence: 13.5] [Reference Citation Analysis (0)] |
| 10. | Gryglewski A, Richter P, Szczepanik M. Changes in γδT Cells in Peripheral Blood of Patients with Ulcerative Colitis Exacerbations. Arch Immunol Ther Exp (Warsz). 2021;69:18. [RCA] [PubMed] [DOI] [Full Text] [Full Text (PDF)] [Cited by in Crossref: 1] [Cited by in RCA: 5] [Article Influence: 1.3] [Reference Citation Analysis (0)] |
| 11. | Furukawa S, Ikeda Y, Yagi S, Miyake T, Shiraishi K, Tange K, Hashimoto Y, Mori K, Ninomiya T, Suzuki S, Shibata N, Murakami H, Ohashi K, Hasebe A, Tomida H, Yamamoto Y, Takeshita E, Hiasa Y. Association Between Peripheral Blood Monocyte Count and Mucosal Healing in Japanese Patients With Ulcerative Colitis. Clin Transl Gastroenterol. 2021;12:e00429. [RCA] [PubMed] [DOI] [Full Text] [Full Text (PDF)] [Cited by in Crossref: 6] [Cited by in RCA: 10] [Article Influence: 2.5] [Reference Citation Analysis (0)] |
| 12. | Colombel JF. Disease Clearance in Inflammatory Bowel Disease. Gastroenterol Hepatol (N Y). 2021;17:233-235. [PubMed] |
| 13. | Danese S, Roda G, Peyrin-Biroulet L. Evolving therapeutic goals in ulcerative colitis: towards disease clearance. Nat Rev Gastroenterol Hepatol. 2020;17:1-2. [RCA] [PubMed] [DOI] [Full Text] [Cited by in Crossref: 48] [Cited by in RCA: 96] [Article Influence: 19.2] [Reference Citation Analysis (0)] |
| 14. | Verstockt B, Parkes M, Lee JC. How Do We Predict a Patient's Disease Course and Whether They Will Respond to Specific Treatments? Gastroenterology. 2022;162:1383-1395. [RCA] [PubMed] [DOI] [Full Text] [Cited by in Crossref: 13] [Cited by in RCA: 39] [Article Influence: 13.0] [Reference Citation Analysis (0)] |
| 15. | Lamb CA, Saifuddin A, Powell N, Rieder F. The Future of Precision Medicine to Predict Outcomes and Control Tissue Remodeling in Inflammatory Bowel Disease. Gastroenterology. 2022;162:1525-1542. [RCA] [PubMed] [DOI] [Full Text] [Cited by in Crossref: 31] [Cited by in RCA: 38] [Article Influence: 12.7] [Reference Citation Analysis (0)] |
| 16. | Armand EJ, Li J, Xie F, Luo C, Mukamel EA. Single-Cell Sequencing of Brain Cell Transcriptomes and Epigenomes. Neuron. 2021;109:11-26. [RCA] [PubMed] [DOI] [Full Text] [Cited by in Crossref: 117] [Cited by in RCA: 157] [Article Influence: 39.3] [Reference Citation Analysis (0)] |
| 17. | Smillie CS, Biton M, Ordovas-Montanes J, Sullivan KM, Burgin G, Graham DB, Herbst RH, Rogel N, Slyper M, Waldman J, Sud M, Andrews E, Velonias G, Haber AL, Jagadeesh K, Vickovic S, Yao J, Stevens C, Dionne D, Nguyen LT, Villani AC, Hofree M, Creasey EA, Huang H, Rozenblatt-Rosen O, Garber JJ, Khalili H, Desch AN, Daly MJ, Ananthakrishnan AN, Shalek AK, Xavier RJ, Regev A. Intra- and Inter-cellular Rewiring of the Human Colon during Ulcerative Colitis. Cell. 2019;178:714-730.e22. [RCA] [PubMed] [DOI] [Full Text] [Cited by in Crossref: 1042] [Cited by in RCA: 865] [Article Influence: 144.2] [Reference Citation Analysis (0)] |
| 18. | Chen E, Chuang LS, Giri M, Villaverde N, Hsu NY, Sabic K, Joshowitz S, Gettler K, Nayar S, Chai Z, Alter IL, Chasteau CC, Korie UM, Dzedzik S, Thin TH, Jain A, Moscati A, Bongers G, Duerr RH, Silverberg MS, Brant SR, Rioux JD, Peter I, Schumm LP, Haritunians T, McGovern DP, Itan Y, Cho JH. Inflamed Ulcerative Colitis Regions Associated With MRGPRX2-Mediated Mast Cell Degranulation and Cell Activation Modules, Defining a New Therapeutic Target. Gastroenterology. 2021;160:1709-1724. [RCA] [PubMed] [DOI] [Full Text] [Cited by in Crossref: 24] [Cited by in RCA: 64] [Article Influence: 16.0] [Reference Citation Analysis (0)] |
| 19. | Cherfane CE, Gessel L, Cirillo D, Zimmerman MB, Polyak S. Monocytosis and a Low Lymphocyte to Monocyte Ratio Are Effective Biomarkers of Ulcerative Colitis Disease Activity. Inflamm Bowel Dis. 2015;21:1769-1775. [RCA] [PubMed] [DOI] [Full Text] [Cited by in Crossref: 60] [Cited by in RCA: 57] [Article Influence: 5.7] [Reference Citation Analysis (0)] |
| 20. | Okba AM, Amin MM, Abdelmoaty AS, Ebada HE, Kamel AH, Allam AS, Sobhy OM. Neutrophil/Lymphocyte ratio and lymphocyte/monocyte ratio in ulcerative colitis as non-invasive biomarkers of disease activity and severity. Auto Immun Highlights. 2019;10:4. [RCA] [PubMed] [DOI] [Full Text] [Full Text (PDF)] [Cited by in Crossref: 21] [Cited by in RCA: 46] [Article Influence: 7.7] [Reference Citation Analysis (0)] |
| 21. | Zamora C, Canto E, Nieto JC, Garcia-Planella E, Gordillo J, Ortiz MA, Suarez-Calvet X, Perea L, Julia G, Juarez C, Vidal S. Inverse Association Between Circulating Monocyte-Platelet Complexes and Inflammation in Ulcerative Colitis Patients. Inflamm Bowel Dis. 2018;24:818-828. [RCA] [PubMed] [DOI] [Full Text] [Cited by in Crossref: 13] [Cited by in RCA: 8] [Article Influence: 1.1] [Reference Citation Analysis (0)] |
| 22. | Kiss S, Németh D, Hegyi P, Földi M, Szakács Z, Erőss B, Tinusz B, Hegyi PJ, Sarlós P, Alizadeh H. Granulocyte and monocyte apheresis as an adjunctive therapy to induce and maintain clinical remission in ulcerative colitis: a systematic review and meta-analysis. BMJ Open. 2021;11:e042374. [RCA] [PubMed] [DOI] [Full Text] [Full Text (PDF)] [Cited by in Crossref: 7] [Cited by in RCA: 2] [Article Influence: 0.5] [Reference Citation Analysis (0)] |
| 23. | Matsuda K, Ohno K, Okada Y, Yagi T, Tsukamoto M, Fukushima Y, Horiuchi A, Shimada R, Ozawa T, Hayama T, Tsuchiya T, Tamura J, Iinuma H, Nozawa K, Aoyagi H, Isono A, Abe K, Kodashima S, Yamamoto T, Kawasaki Y, Tamura Y, Sasajima Y, Kondo F, Hashiguchi Y. Adsorptive Granulocyte and Monocyte Apheresis Is Effective in Ulcerative Colitis Patients Both with and without Concomitant Prednisolone. Inflamm Intest Dis. 2020;5:36-41. [RCA] [PubMed] [DOI] [Full Text] [Cited by in Crossref: 2] [Cited by in RCA: 3] [Article Influence: 0.6] [Reference Citation Analysis (0)] |
| 24. | Pronk MCA, van Bezu JSM, van Nieuw Amerongen GP, van Hinsbergh VWM, Hordijk PL. RhoA, RhoB and RhoC differentially regulate endothelial barrier function. Small GTPases. 2019;10:466-484. [RCA] [PubMed] [DOI] [Full Text] [Full Text (PDF)] [Cited by in Crossref: 30] [Cited by in RCA: 38] [Article Influence: 4.8] [Reference Citation Analysis (0)] |
| 25. | Yang Y, Ma Y, Shi C, Chen H, Zhang H, Chen N, Zhang P, Wang F, Yang J, Zhu Q, Liang Y, Wu W, Gao R, Yang Z, Zou Y, Qin H. Overexpression of miR-21 in patients with ulcerative colitis impairs intestinal epithelial barrier function through targeting the Rho GTPase RhoB. Biochem Biophys Res Commun. 2013;434:746-752. [RCA] [PubMed] [DOI] [Full Text] [Cited by in Crossref: 101] [Cited by in RCA: 118] [Article Influence: 9.8] [Reference Citation Analysis (0)] |
| 26. | Hausmann M, Obermeier F, Schreiter K, Spottl T, Falk W, Schölmerich J, Herfarth H, Saftig P, Rogler G. Cathepsin D is up-regulated in inflammatory bowel disease macrophages. Clin Exp Immunol. 2004;136:157-167. [RCA] [PubMed] [DOI] [Full Text] [Cited by in Crossref: 38] [Cited by in RCA: 48] [Article Influence: 2.3] [Reference Citation Analysis (0)] |
| 27. | Fischbeck A, Leucht K, Frey-Wagner I, Bentz S, Pesch T, Kellermeier S, Krebs M, Fried M, Rogler G, Hausmann M, Humpf HU. Sphingomyelin induces cathepsin D-mediated apoptosis in intestinal epithelial cells and increases inflammation in DSS colitis. Gut. 2011;60:55-65. [RCA] [PubMed] [DOI] [Full Text] [Cited by in Crossref: 64] [Cited by in RCA: 68] [Article Influence: 4.9] [Reference Citation Analysis (0)] |
| 28. | Martynova NY, Parshina EA, Zaraisky AG. Cytoskeletal protein Zyxin in embryonic development: from controlling cell movements and pluripotency to regulating embryonic patterning. FEBS J. 2021. [RCA] [PubMed] [DOI] [Full Text] [Cited by in Crossref: 3] [Cited by in RCA: 3] [Article Influence: 1.5] [Reference Citation Analysis (0)] |
| 29. | Wang YX, Wang DY, Guo YC, Guo J. Zyxin: a mechanotransductor to regulate gene expression. Eur Rev Med Pharmacol Sci. 2019;23:413-425. [RCA] [PubMed] [DOI] [Full Text] [Cited by in RCA: 19] [Reference Citation Analysis (0)] |
| 30. | Zhou J, Zeng Y, Cui L, Chen X, Stauffer S, Wang Z, Yu F, Lele SM, Talmon GA, Black AR, Chen Y, Dong J. Zyxin promotes colon cancer tumorigenesis in a mitotic phosphorylation-dependent manner and through CDK8-mediated YAP activation. Proc Natl Acad Sci U S A. 2018;115:E6760-E6769. [RCA] [PubMed] [DOI] [Full Text] [Cited by in Crossref: 21] [Cited by in RCA: 40] [Article Influence: 5.7] [Reference Citation Analysis (0)] |
| 31. | Magro F, Gionchetti P, Eliakim R, Ardizzone S, Armuzzi A, Barreiro-de Acosta M, Burisch J, Gecse KB, Hart AL, Hindryckx P, Langner C, Limdi JK, Pellino G, Zagórowicz E, Raine T, Harbord M, Rieder F; European Crohn’s and Colitis Organisation [ECCO]. Third European Evidence-based Consensus on Diagnosis and Management of Ulcerative Colitis. Part 1: Definitions, Diagnosis, Extra-intestinal Manifestations, Pregnancy, Cancer Surveillance, Surgery, and Ileo-anal Pouch Disorders. J Crohns Colitis. 2017;11:649-670. [RCA] [PubMed] [DOI] [Full Text] [Cited by in Crossref: 1446] [Cited by in RCA: 1298] [Article Influence: 162.3] [Reference Citation Analysis (0)] |
| 32. | Choi CH, Rutter MD, Askari A, Lee GH, Warusavitarne J, Moorghen M, Thomas-Gibson S, Saunders BP, Graham TA, Hart AL. Forty-Year Analysis of Colonoscopic Surveillance Program for Neoplasia in Ulcerative Colitis: An Updated Overview. Am J Gastroenterol. 2015;110:1022-1034. [RCA] [PubMed] [DOI] [Full Text] [Full Text (PDF)] [Cited by in Crossref: 172] [Cited by in RCA: 211] [Article Influence: 21.1] [Reference Citation Analysis (0)] |
| 33. | Lovisa S, Genovese G, Danese S. Role of Epithelial-to-Mesenchymal Transition in Inflammatory Bowel Disease. J Crohns Colitis. 2019;13:659-668. [RCA] [PubMed] [DOI] [Full Text] [Cited by in Crossref: 39] [Cited by in RCA: 95] [Article Influence: 15.8] [Reference Citation Analysis (0)] |
| 34. | Qiao D, Zhang Z, Zhang Y, Chen Q, Chen Y, Tang Y, Sun X, Tang Z, Dai Y. Regulation of Endoplasmic Reticulum Stress-Autophagy: A Potential Therapeutic Target for Ulcerative Colitis. Front Pharmacol. 2021;12:697360. [RCA] [PubMed] [DOI] [Full Text] [Full Text (PDF)] [Cited by in Crossref: 4] [Cited by in RCA: 35] [Article Influence: 8.8] [Reference Citation Analysis (0)] |
| 35. | Kökten T, Gibot S, Lepage P, D'Alessio S, Hablot J, Ndiaye NC, Busby-Venner H, Monot C, Garnier B, Moulin D, Jouzeau JY, Hansmannel F, Danese S, Guéant JL, Muller S, Peyrin-Biroulet L. TREM-1 Inhibition Restores Impaired Autophagy Activity and Reduces Colitis in Mice. J Crohns Colitis. 2018;12:230-244. [RCA] [PubMed] [DOI] [Full Text] [Cited by in Crossref: 36] [Cited by in RCA: 64] [Article Influence: 9.1] [Reference Citation Analysis (0)] |
| 36. | Arriola E, Wheater M, Lopez MA, Thomas G, Ottensmeier C. Evaluation of immune infiltration in the colonic mucosa of patients with ipilimumab-related colitis. Oncoimmunology. 2016;5:e1209615. [RCA] [PubMed] [DOI] [Full Text] [Full Text (PDF)] [Cited by in Crossref: 14] [Cited by in RCA: 16] [Article Influence: 1.8] [Reference Citation Analysis (0)] |
| 37. | Lei Y, Chen Y, Lin Z, Tian D, Han P. Comprehensive analysis of key biomarkers, immune infiltration and potential therapeutic agents for ulcerative colitis. Life Sci. 2020;260:118437. [RCA] [PubMed] [DOI] [Full Text] [Cited by in Crossref: 2] [Cited by in RCA: 7] [Article Influence: 1.4] [Reference Citation Analysis (0)] |
| 38. | Campaniello MA, Mavrangelos C, Eade S, Harrington AM, Blackshaw LA, Brierley SM, Smid SD, Hughes PA. Acute colitis chronically alters immune infiltration mechanisms and sensory neuro-immune interactions. Brain Behav Immun. 2017;60:319-332. [RCA] [PubMed] [DOI] [Full Text] [Cited by in Crossref: 15] [Cited by in RCA: 16] [Article Influence: 2.0] [Reference Citation Analysis (0)] |
| 39. | Liu S, Huang L, Lin Z, Hu Y, Chen R, Wang L, Shan Y. RhoB induces the production of proinflammatory cytokines in TLR-triggered macrophages. Mol Immunol. 2017;87:200-206. [RCA] [PubMed] [DOI] [Full Text] [Cited by in Crossref: 12] [Cited by in RCA: 21] [Article Influence: 2.6] [Reference Citation Analysis (0)] |
| 40. | Yadati T, Houben T, Bitorina A, Oligschlaeger Y, Gijbels MJ, Mohren R, Lütjohann D, Khurana P, Goyal S, Kulkarni A, Theys J, Cillero-Pastor B, Shiri-Sverdlov R. Inhibition of Extracellular Cathepsin D Reduces Hepatic Lipid Accumulation and Leads to Mild Changes in Inflammationin NASH Mice. Front Immunol. 2021;12:675535. [RCA] [PubMed] [DOI] [Full Text] [Full Text (PDF)] [Cited by in Crossref: 4] [Cited by in RCA: 13] [Article Influence: 3.3] [Reference Citation Analysis (0)] |
| 41. | Joosten B, Willemse M, Fransen J, Cambi A, van den Dries K. Super-Resolution Correlative Light and Electron Microscopy (SR-CLEM) Reveals Novel Ultrastructural Insights Into Dendritic Cell Podosomes. Front Immunol. 2018;9:1908. [RCA] [PubMed] [DOI] [Full Text] [Full Text (PDF)] [Cited by in Crossref: 34] [Cited by in RCA: 34] [Article Influence: 4.9] [Reference Citation Analysis (0)] |
| 42. | Brabeck C, Beschorner R, Conrad S, Mittelbronn M, Bekure K, Meyermann R, Schluesener HJ, Schwab JM. Lesional expression of RhoA and RhoB following traumatic brain injury in humans. J Neurotrauma. 2004;21:697-706. [RCA] [PubMed] [DOI] [Full Text] [Cited by in Crossref: 38] [Cited by in RCA: 46] [Article Influence: 2.2] [Reference Citation Analysis (0)] |
| 43. | DeWard AD, Leali K, West RA, Prendergast GC, Alberts AS. Loss of RhoB expression enhances the myelodysplastic phenotype of mammalian diaphanous-related Formin mDia1 knockout mice. PLoS One. 2009;4:e7102. [RCA] [PubMed] [DOI] [Full Text] [Full Text (PDF)] [Cited by in Crossref: 15] [Cited by in RCA: 19] [Article Influence: 1.2] [Reference Citation Analysis (0)] |
| 44. | Tian L, Zhang K, Tian ZY, Wang T, Shang DS, Li B, Liu DX, Fang WG, Wang ZY, Chen YH. Decreased expression of cathepsin D in monocytes is related to the defective degradation of amyloid-β in Alzheimer's disease. J Alzheimers Dis. 2014;42:511-520. [RCA] [PubMed] [DOI] [Full Text] [Cited by in Crossref: 20] [Cited by in RCA: 31] [Article Influence: 3.1] [Reference Citation Analysis (0)] |
| 45. | Chen Q, Yin Q, Song J, Liu C, Chen H, Li S. Identification of monocyte-associated genes as predictive biomarkers of heart failure after acute myocardial infarction. BMC Med Genomics. 2021;14:44. [RCA] [PubMed] [DOI] [Full Text] [Full Text (PDF)] [Cited by in Crossref: 17] [Cited by in RCA: 21] [Article Influence: 5.3] [Reference Citation Analysis (0)] |


