Copyright
©The Author(s) 2022.
World J Clin Cases. Jul 26, 2022; 10(21): 7577-7584
Published online Jul 26, 2022. doi: 10.12998/wjcc.v10.i21.7577
Published online Jul 26, 2022. doi: 10.12998/wjcc.v10.i21.7577
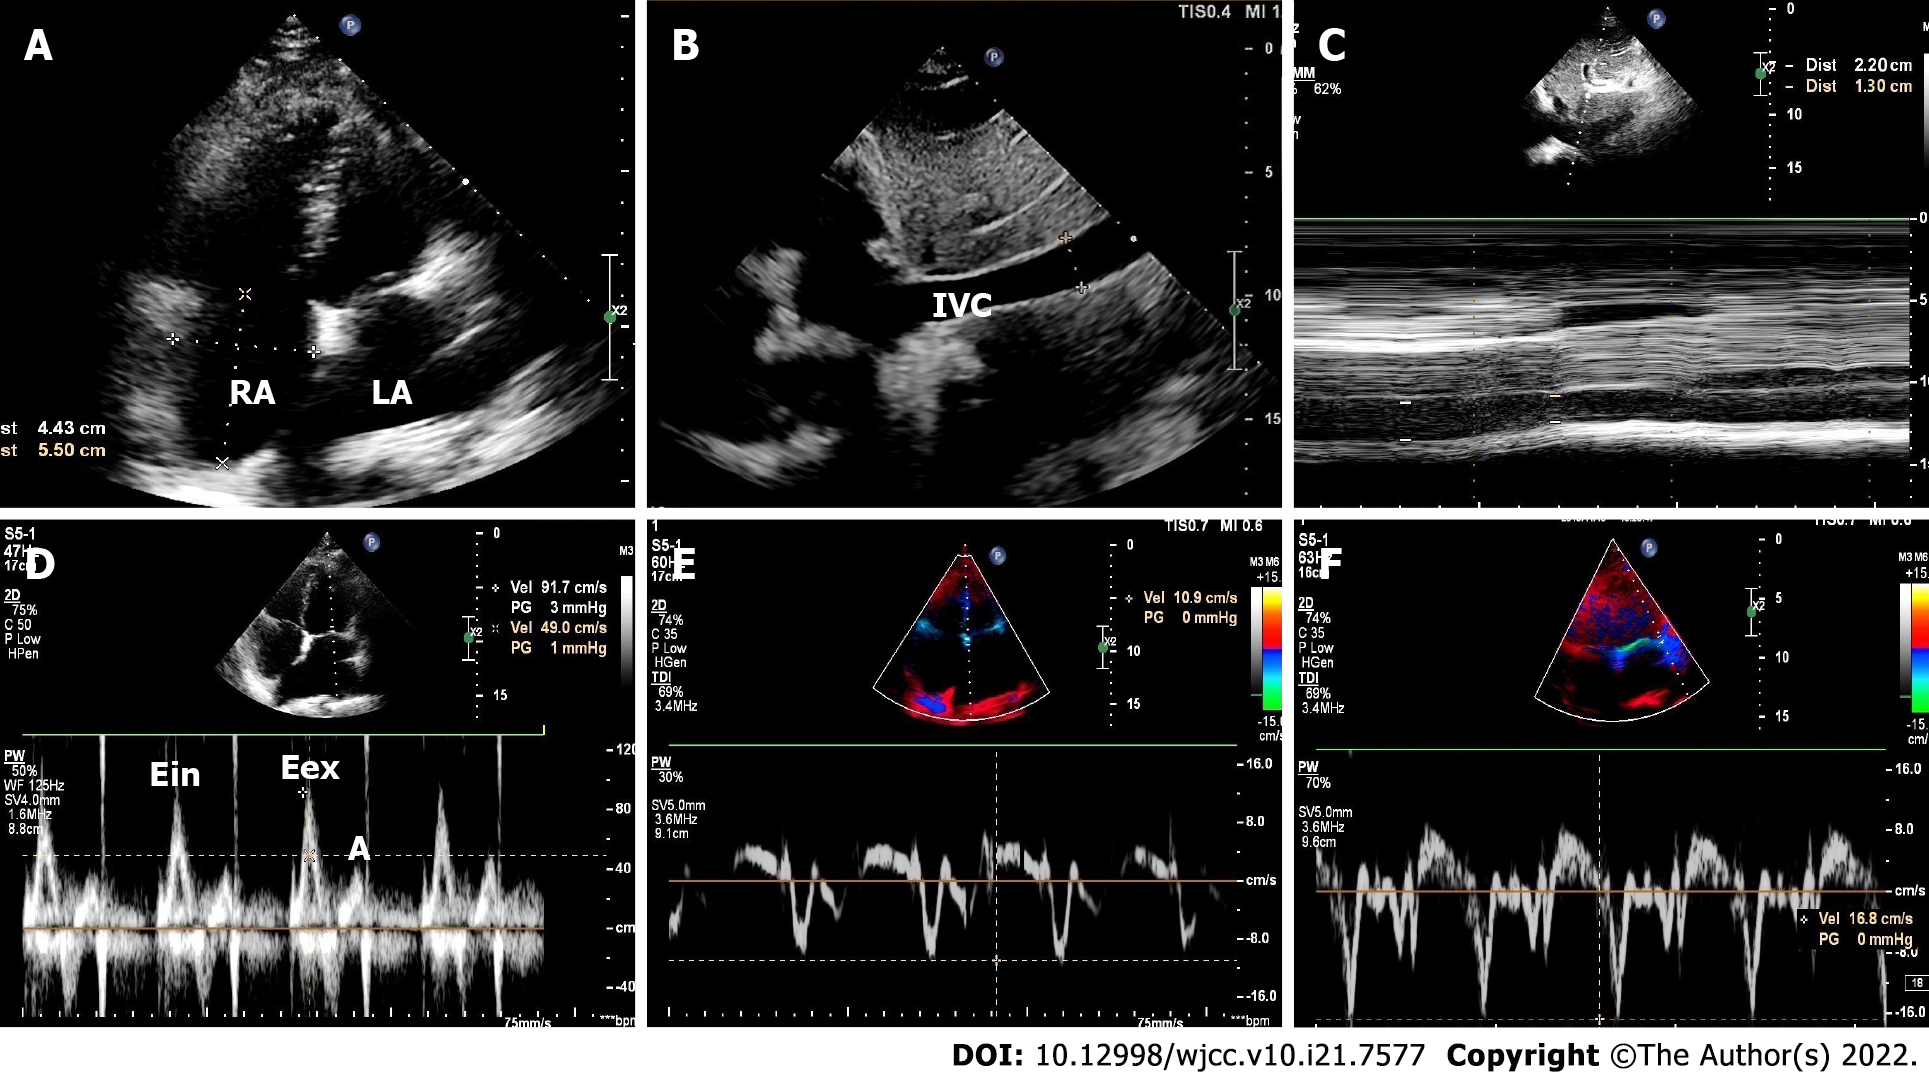
Figure 3 The follow-up echocardiography 1 wk after pericardectomy.
A: The diameters of the left and right atriam were 5.4 cm × 6.1 cm and 4.4 cm × 5.5 cm, respectively. The localized pericardial effusion disappeared; B and C: The diameter of the inferior vena cava (2.2 cm) and aspiratory variation were still lower than 50% (41%). The calculated right atrial pressure was lower than that before pericardectomy (12 mmHg); D: Pulsed-wave Doppler of the mitral valve showed that the peak mitral E and A inflow velocities were 92 cm/s and 49 cm/s, respectively. Respiratory variation in the peak mitral inflow velocity (E) was 15% (peak E velocity during expiration and inspiration were 92 cm/s and 78 cm/s, respectively); E and F: Tissue Doppler imaging revealed that the medial mitral e’ velocity (10.9 cm/s) was lower than the lateral mitral e’ velocity (16.8 cm/s). IVC: Inferior vena cava; LA: Left atrium; RA: Right atrium.
- Citation: Chen JL, Mei DE, Yu CG, Zhao ZY. Pseudomonas aeruginosa-related effusive-constrictive pericarditis diagnosed with echocardiography: A case report. World J Clin Cases 2022; 10(21): 7577-7584
- URL: https://www.wjgnet.com/2307-8960/full/v10/i21/7577.htm
- DOI: https://dx.doi.org/10.12998/wjcc.v10.i21.7577


