Copyright
©The Author(s) 2021.
World J Clin Cases. Mar 6, 2021; 9(7): 1563-1579
Published online Mar 6, 2021. doi: 10.12998/wjcc.v9.i7.1563
Published online Mar 6, 2021. doi: 10.12998/wjcc.v9.i7.1563
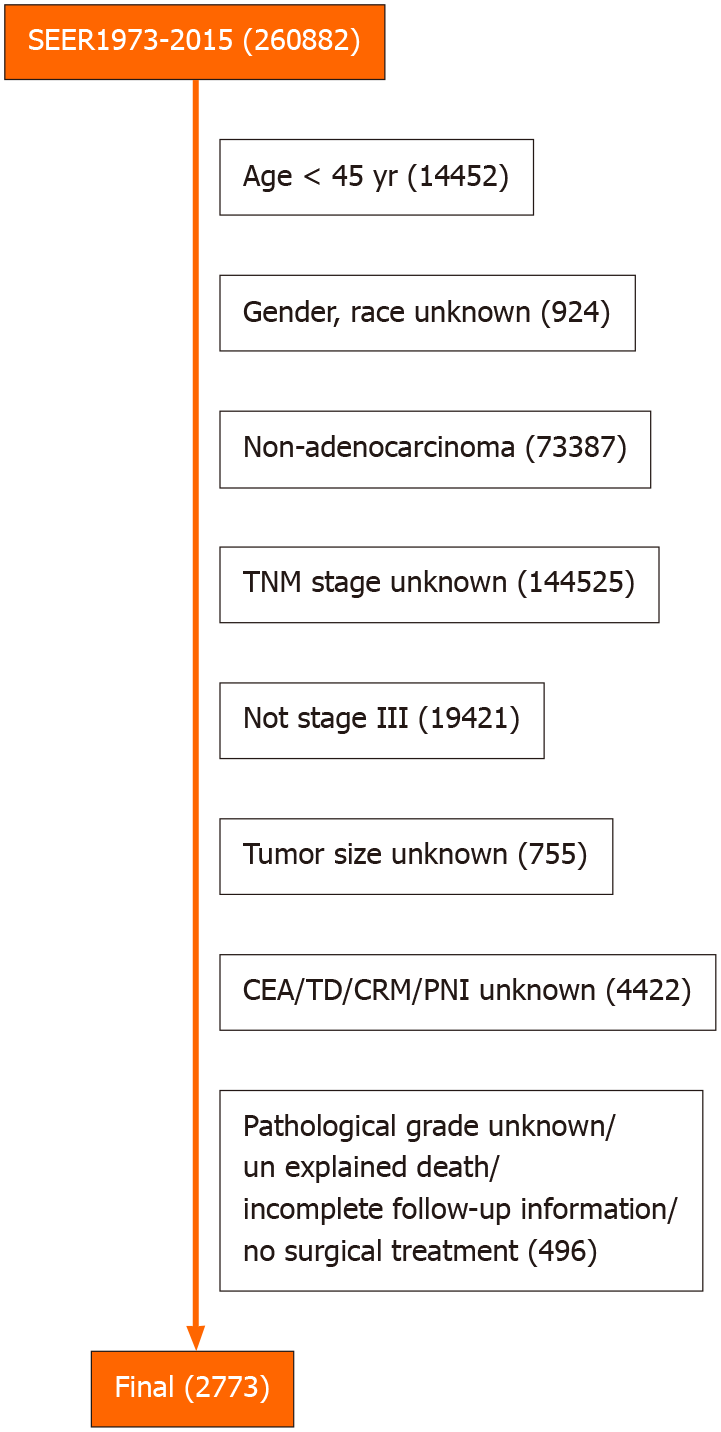
Figure 1 Flow diagram.
From the 260882 patients with rectal cancer in the Surveillance, Epidemiology, and End Results Program database, a total of 2773 eligible patients were screened. TNM: Tumor-node-metastases; CEA: Carcinoembryonic antigen; TD: Tumor engraftment; CRM: Circumferential resection margin; PNI: Perineural invasion.
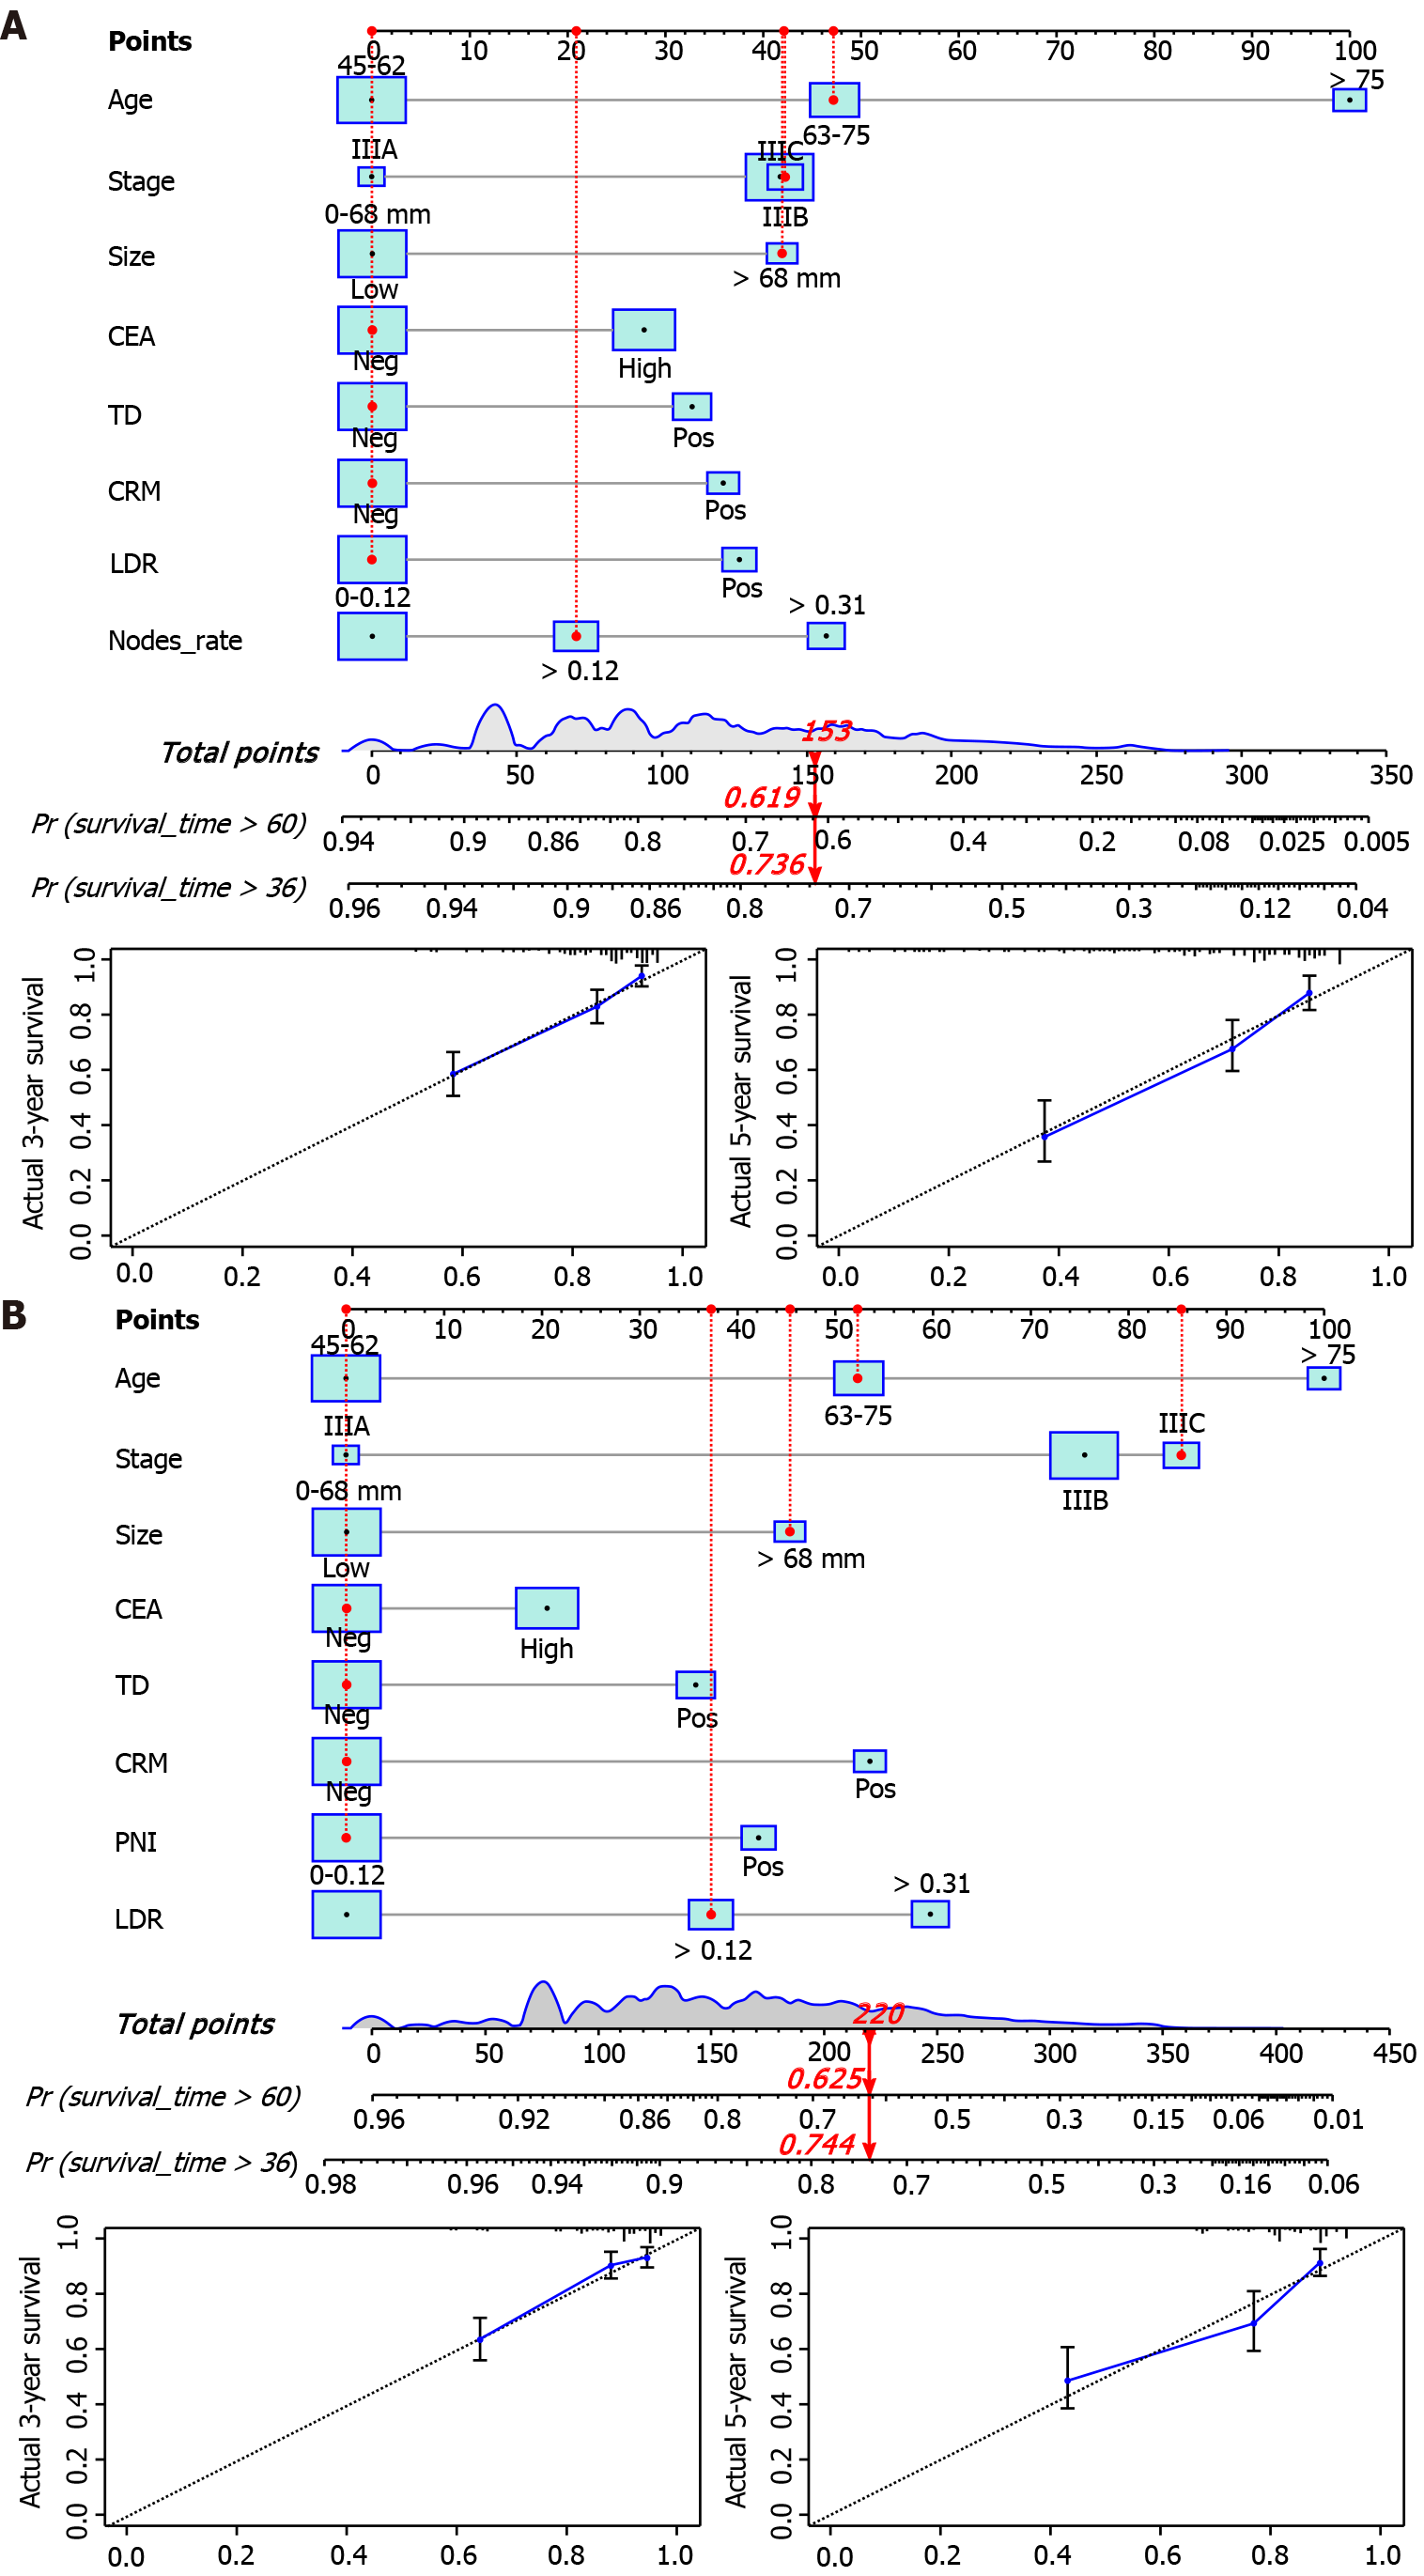
Figure 2 Overall survival nomogram, cancer-specific survival nomogram and verification cohorts calibration curve.
The total score obtained by summing the individual scores of the predictors was used to predict the 3- and 5-year survival rates of the patients. The calibration curve showed a high degree of agreement between the predicted and actual values of the overall survival (OS) nomogram and the cancer-specific survival (CSS) nomogram. A: OS nomogram and calibration curve B: CSS nomogram and calibration curve. (Example: 70-year-old male patient with rectal adenocarcinoma, tumor size 80 mm, circumferential resection margin (-), tumor engraftment (-), carcinoembryonic antigen (-), perineural invasion (-), clinical stage IIIC, LNR: 0.18. The red indicator line in the figure represents the score of patients: OS total score 153, 3-year OS: 0.619, 5-year OS: 0.736; CSS total score 220, 3-year CSS: 0.744, 5-year CSS: 0.625). CEA: Carcinoembryonic antigen; TD: Tumor engraftment; CRM: Circumferential resection margin; PNI: Perineural invasion; LDR: Low-dose-rate.
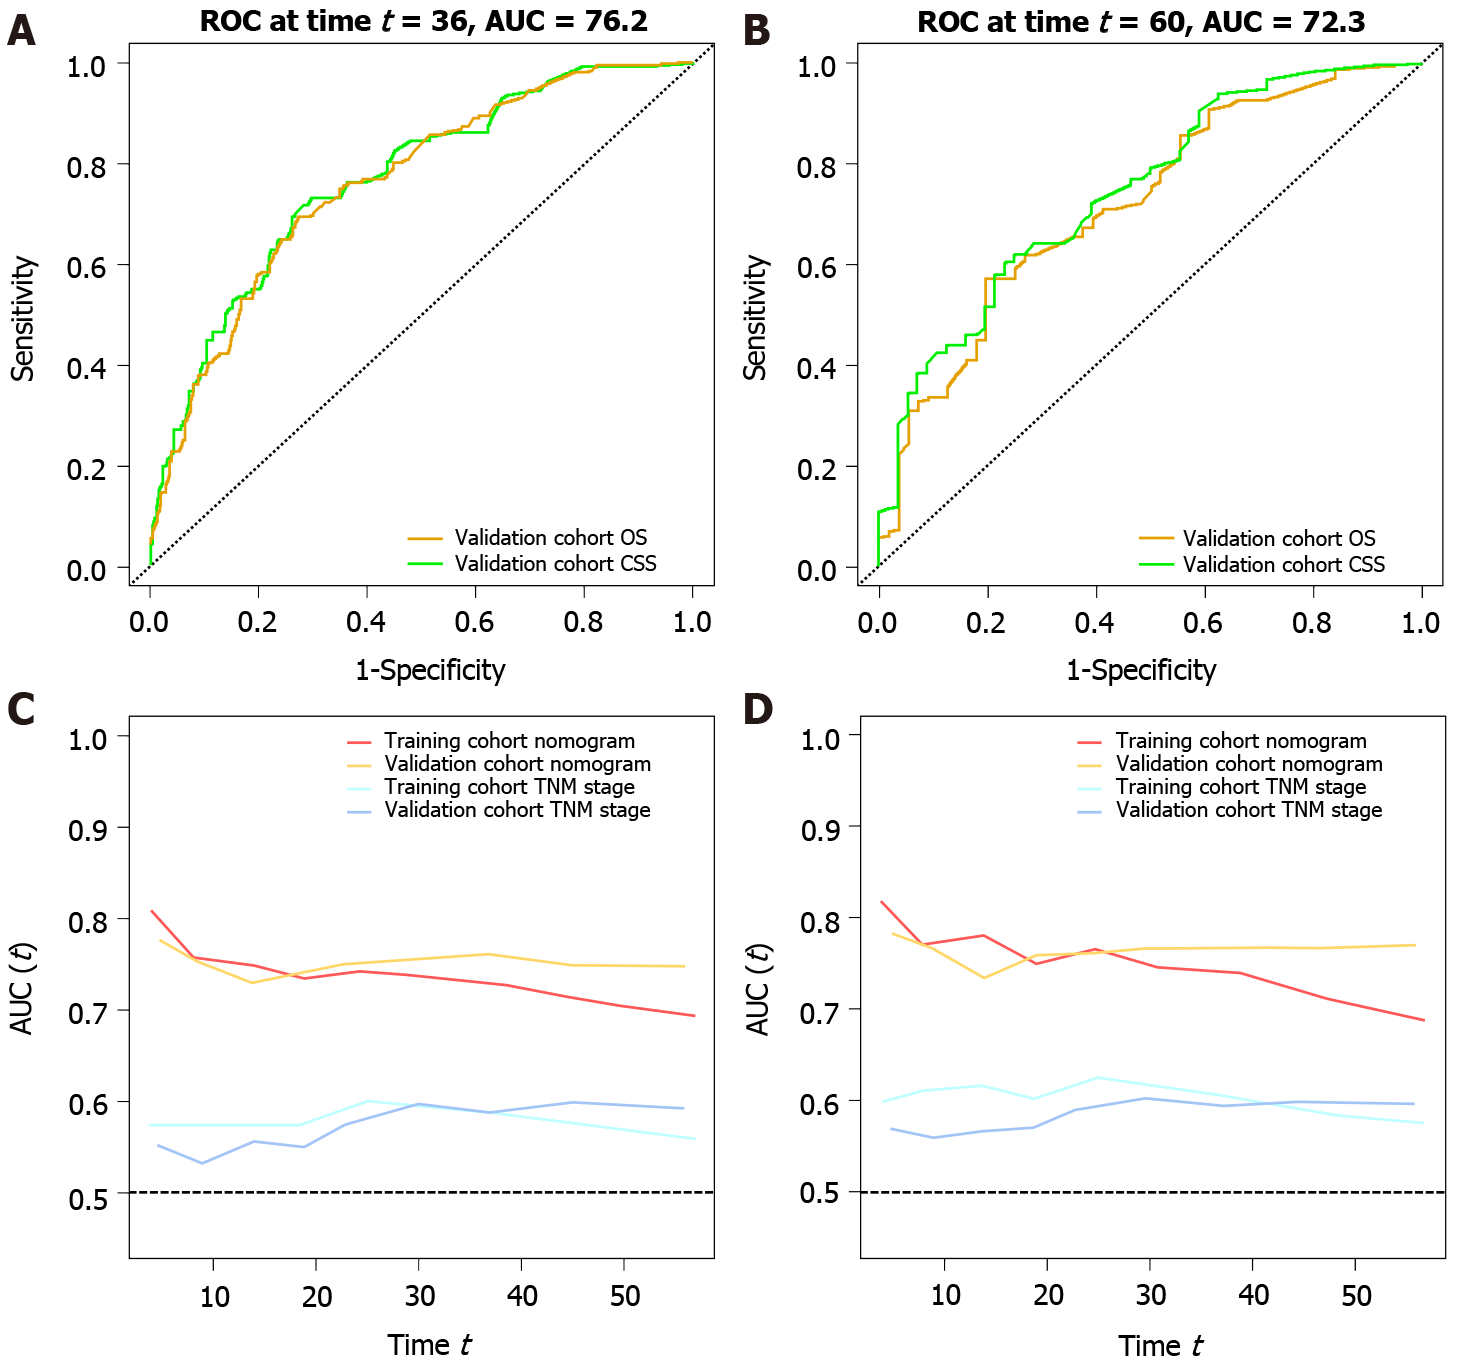
Figure 3 Receiver operating characteristic and time-dependent area under the curve.
Receiver operating characteristic (ROC) values for the validation cohort are shown in the figure. Area under the curve (AUC) values of the nomogram vs tumor-node-metastases (TNM) stage based on temporal changes are shown. In the training and validation cohorts, the AUC of the nomogram was higher than that of TNM stage. A: Validation cohort overall survival (OS), 3-year survival ROC of cancer-specific survival (CSS) (OS AUC: 0.762; CSS AUC: 0.770); B: Validation cohort OS, 5-year survival ROC of CSS (OS AUC: 0.722; CSS AUC: 0.744); C: Time-dependent AUC curve of OS between the training cohort and validation cohort (nomogram and TNM stage); D: Time-dependent AUC curve of CSS between the training cohort and validation cohort (nomogram and TNM stage). ROC: Receiver operating characteristic; AUC: Area under the curve; OS: Overall survival; CCS: Cancer-specific survival; TNM: Tumor-node-metastases.
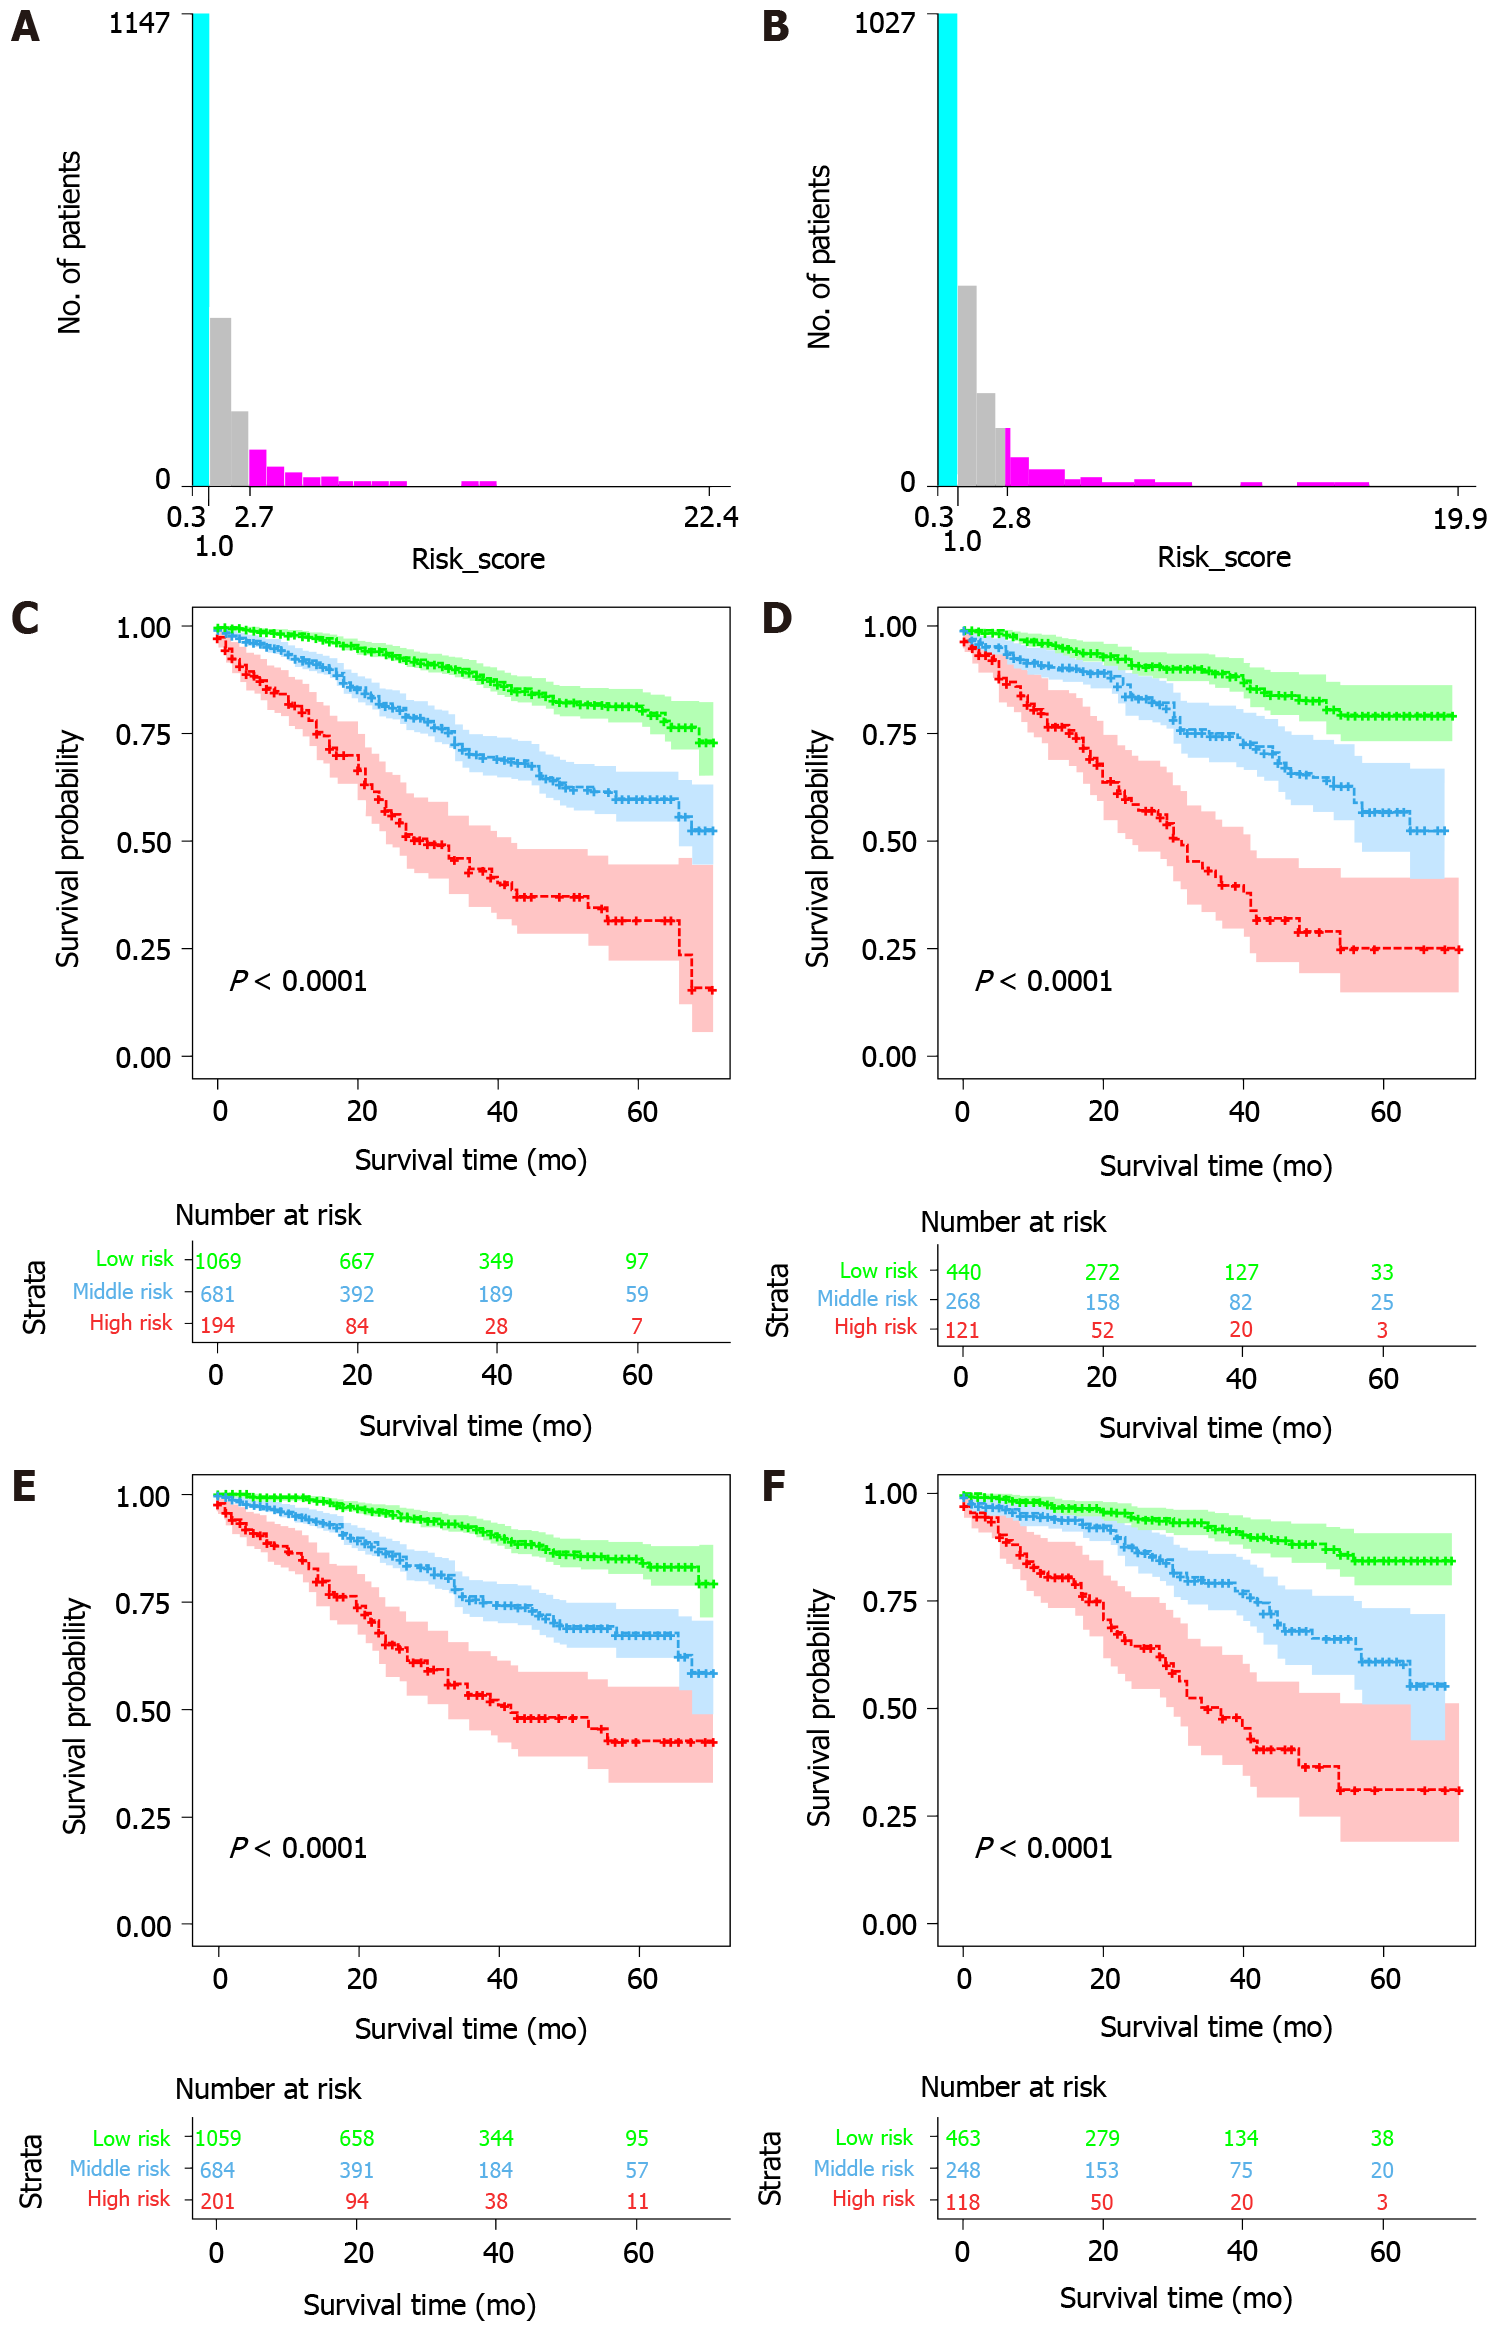
Figure 4 Kaplan-Meier survival curves for low-, medium-, and high-risk groups based on risk scores.
The optimal overall survival (OS) risk score cutoffs were 1 and 2.7. Cancer-specific survival (CSS) risk score cutoffs were 1 and 2.8. Significant differences in OS and CSS were observed between low-risk, intermediate-risk, and high-risk patients in the training and validation cohorts. A: OS risk score cutoff value; B: CSS risk score cutoff value; C: Risk-stratified survival curve for OS in the training cohort; D: Risk-stratified survival curve for OS in the validation cohort; E: Risk-stratified survival curve for CSS in the training cohort; F: Risk-stratified survival curve for CSS in the validation cohort.
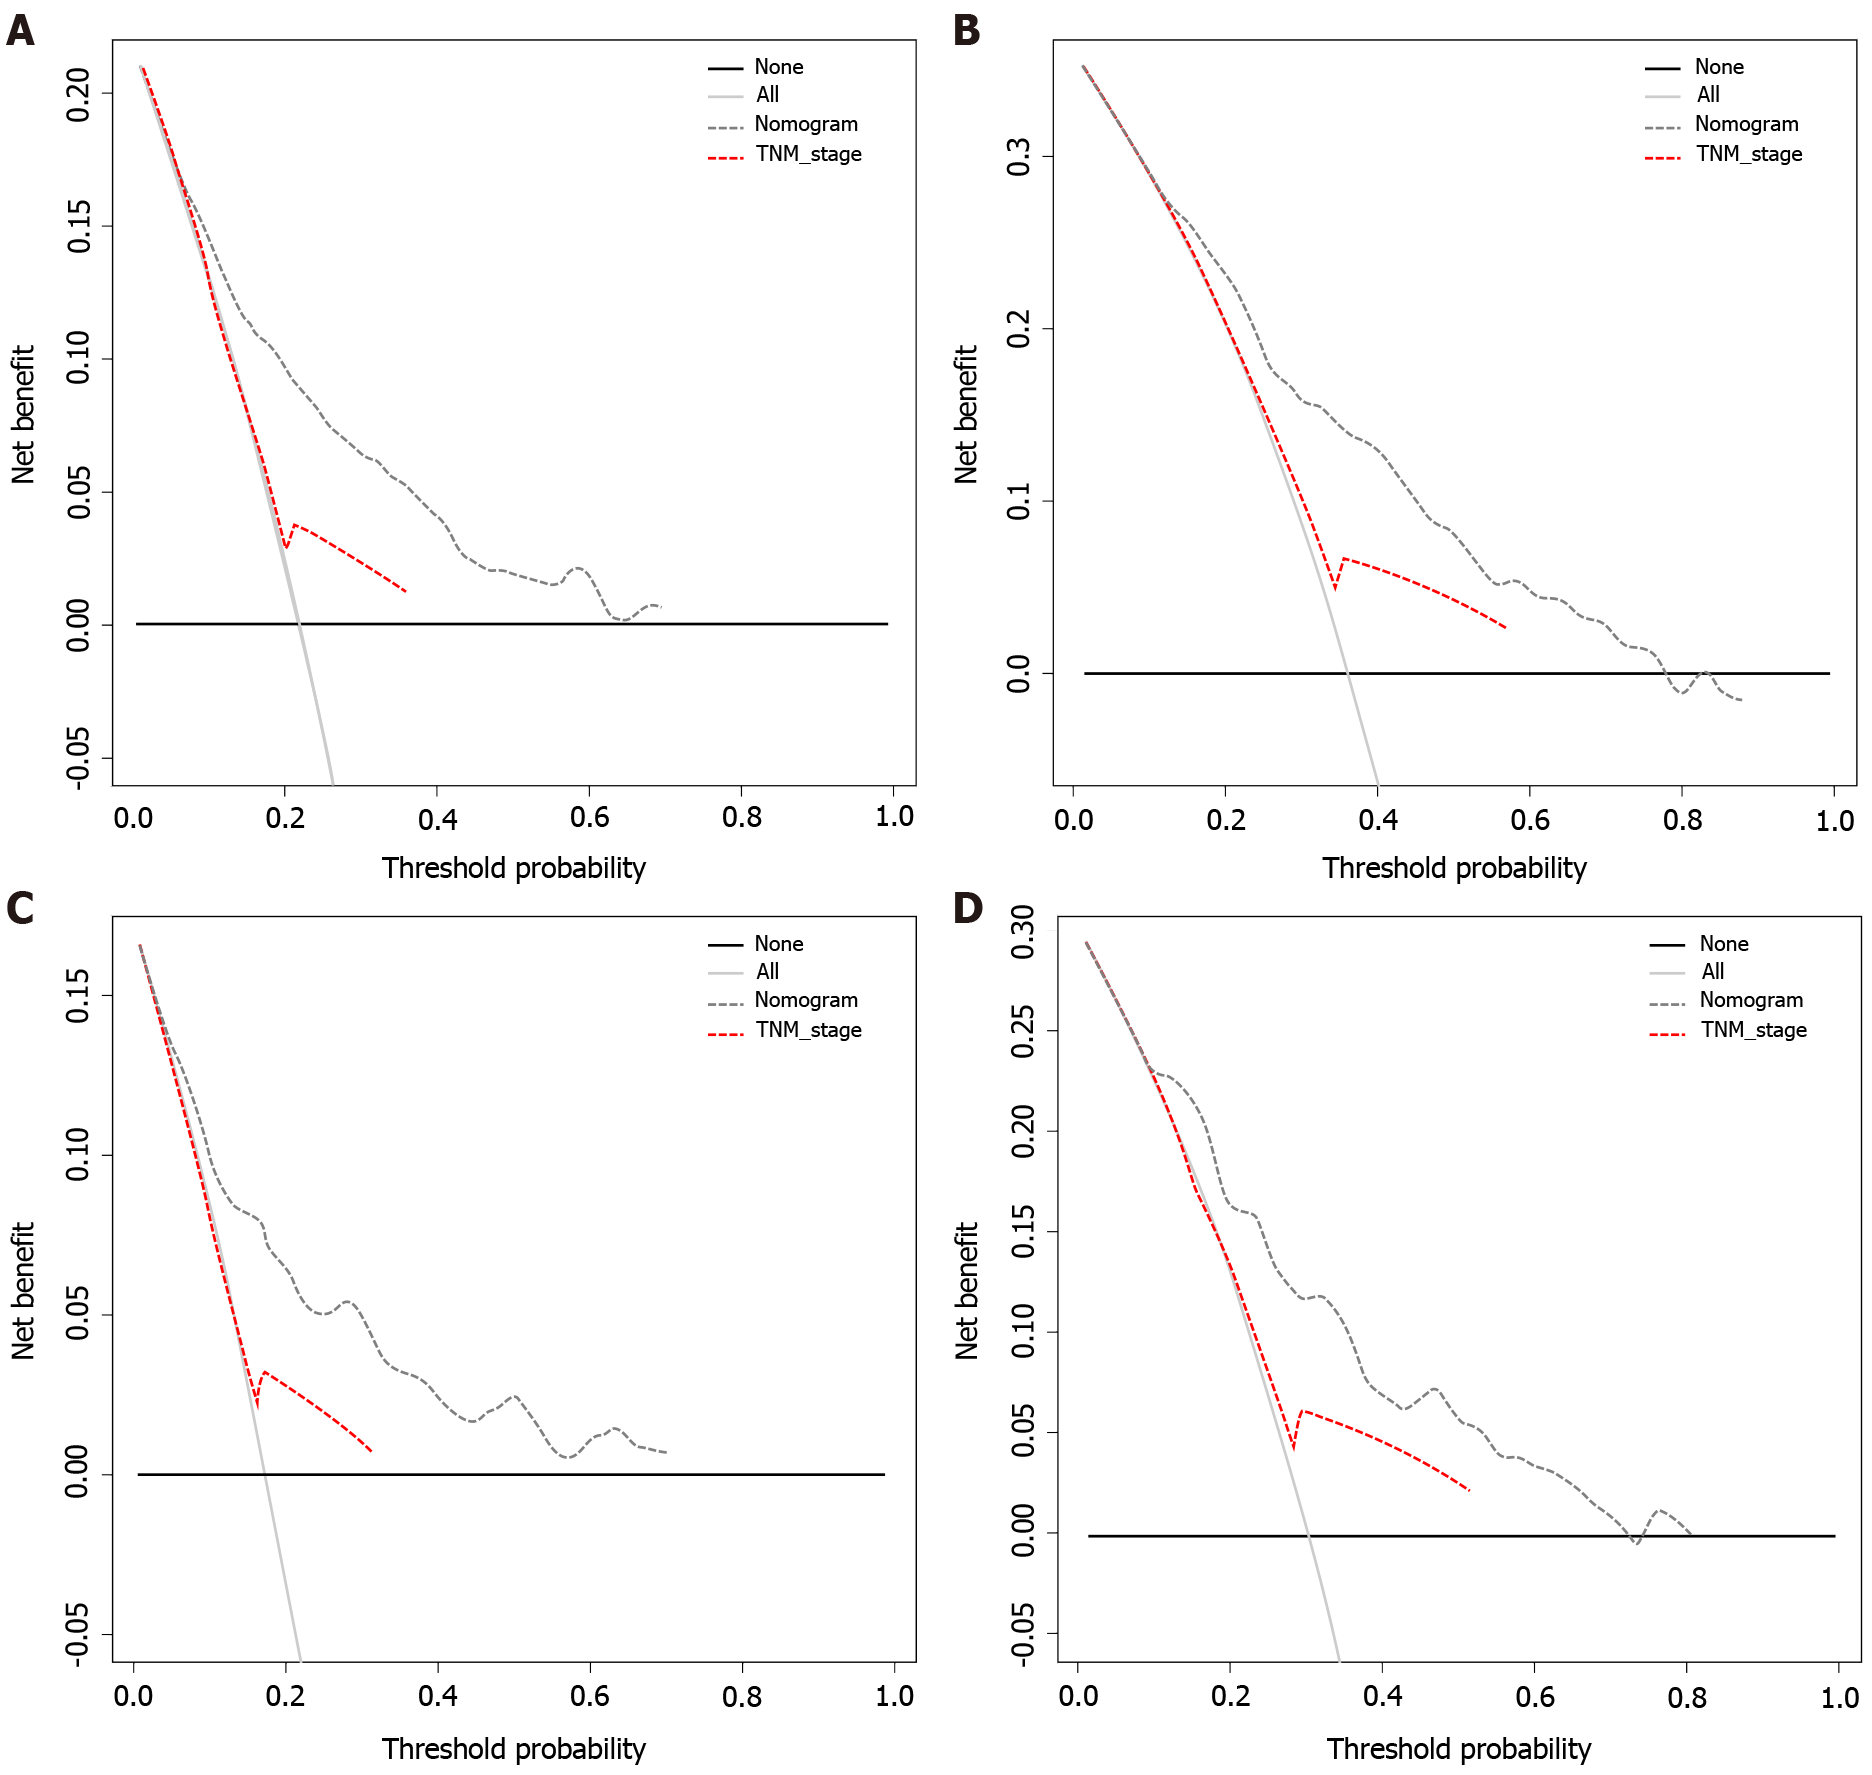
Figure 5 Decision curve analysis.
Plot net benefit vs threshold probability. The net benefit was calculated by subtracting the proportion of all false-positive patients from the proportion of true positives, weighing the relative harm of abandoning treatment against the adverse consequences of unnecessary treatment. The gray and black lines indicate the net benefit of treating all patients and no patient strategies, respectively. Dashed lines represent the nomograms. The results showed that the nomograms had good decision power in the validation cohort. A: 3 Year overall survival (OS) decision curve analysis (DCA); B: 5 Year OS DCA; C: 3 Year CSS DCA; D: 5 Year CSS DCA. TNM: Tumor-node-metastases.
- Citation: Liu H, Li Y, Qu YD, Zhao JJ, Zheng ZW, Jiao XL, Zhang J. Construction of a clinical survival prognostic model for middle-aged and elderly patients with stage III rectal adenocarcinoma . World J Clin Cases 2021; 9(7): 1563-1579
- URL: https://www.wjgnet.com/2307-8960/full/v9/i7/1563.htm
- DOI: https://dx.doi.org/10.12998/wjcc.v9.i7.1563


