Copyright
©The Author(s) 2021.
World J Clin Cases. Mar 6, 2021; 9(7): 1554-1562
Published online Mar 6, 2021. doi: 10.12998/wjcc.v9.i7.1554
Published online Mar 6, 2021. doi: 10.12998/wjcc.v9.i7.1554
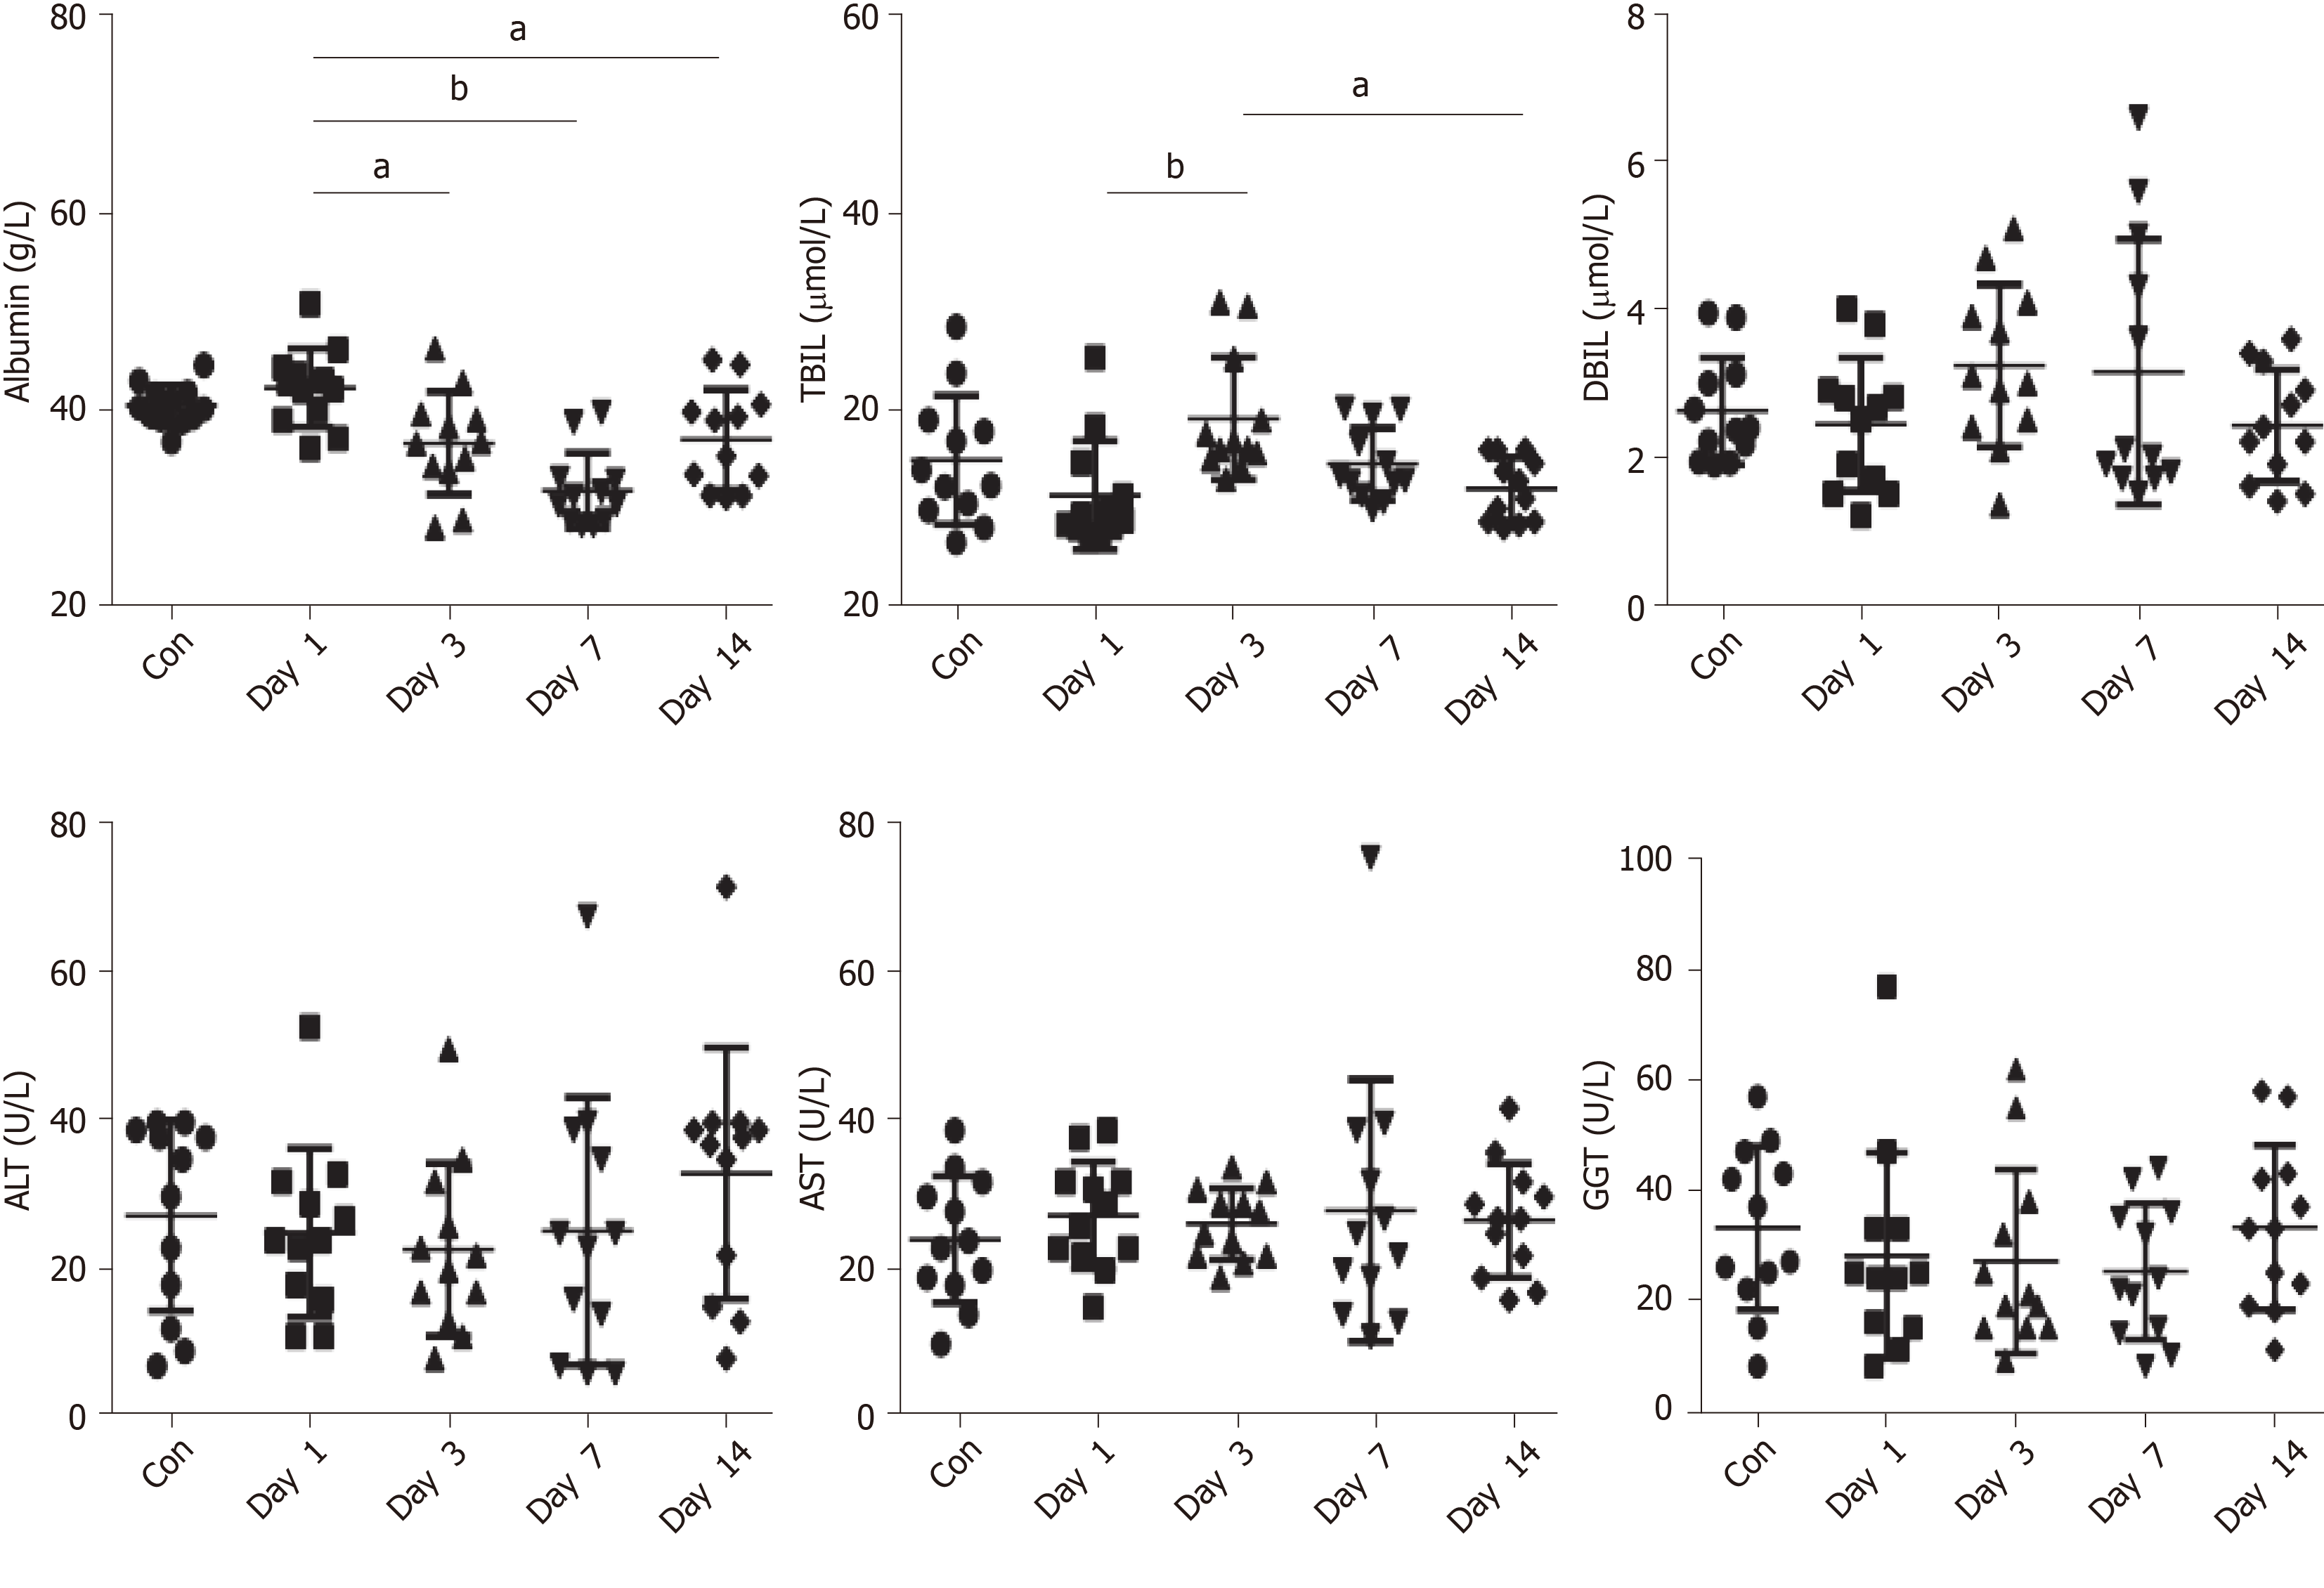
Figure 1 Liver function indexes.
The control group was compared with Day 1 group by Student t-test. Different time of disease group using analysis of variance and the LSD post hoc test. Data are shown as mean ± standard deviation, n = 12. aP < 0.01, bP < 0.001. Con: Control group; Day 1-Day 14: Disease group. ALT: Alanine aminotransferase; AST: Aspartate aminotransferase; DBIL: Direct bilirubin; GGT: γ-glutamyltransferase; TBIL: Total bilirubin.
- Citation: Lin H, Wu LJ, Guo SQ, Chen RL, Fan JR, Ke B, Pan ZQ. Dynamic monitoring of serum liver function indexes in patients with COVID-19. World J Clin Cases 2021; 9(7): 1554-1562
- URL: https://www.wjgnet.com/2307-8960/full/v9/i7/1554.htm
- DOI: https://dx.doi.org/10.12998/wjcc.v9.i7.1554


