Copyright
©The Author(s) 2021.
World J Clin Cases. Mar 6, 2021; 9(7): 1532-1542
Published online Mar 6, 2021. doi: 10.12998/wjcc.v9.i7.1532
Published online Mar 6, 2021. doi: 10.12998/wjcc.v9.i7.1532
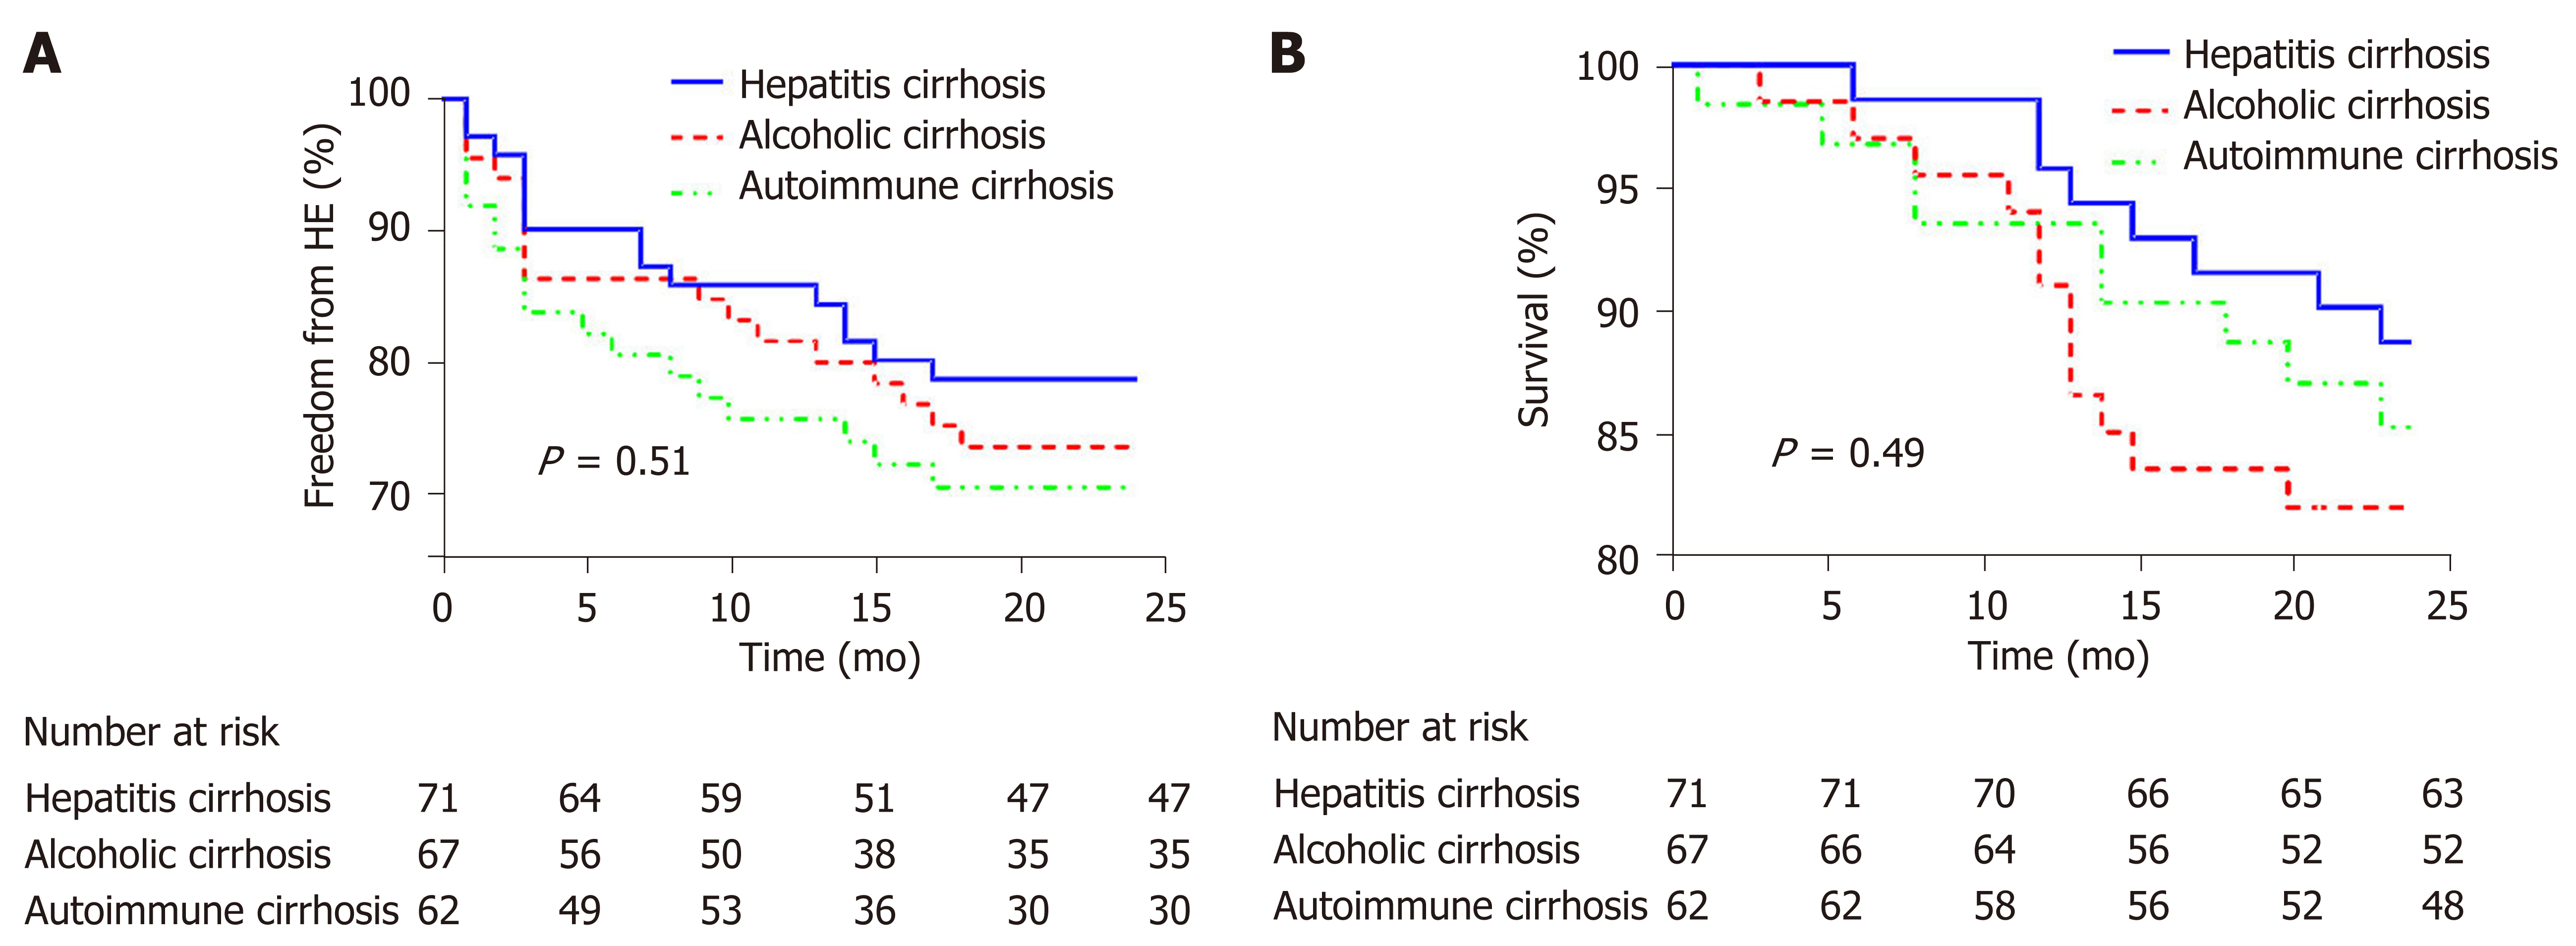
Figure 1 Incidence of hepatic encephalopathy and survival in the three patient groups.
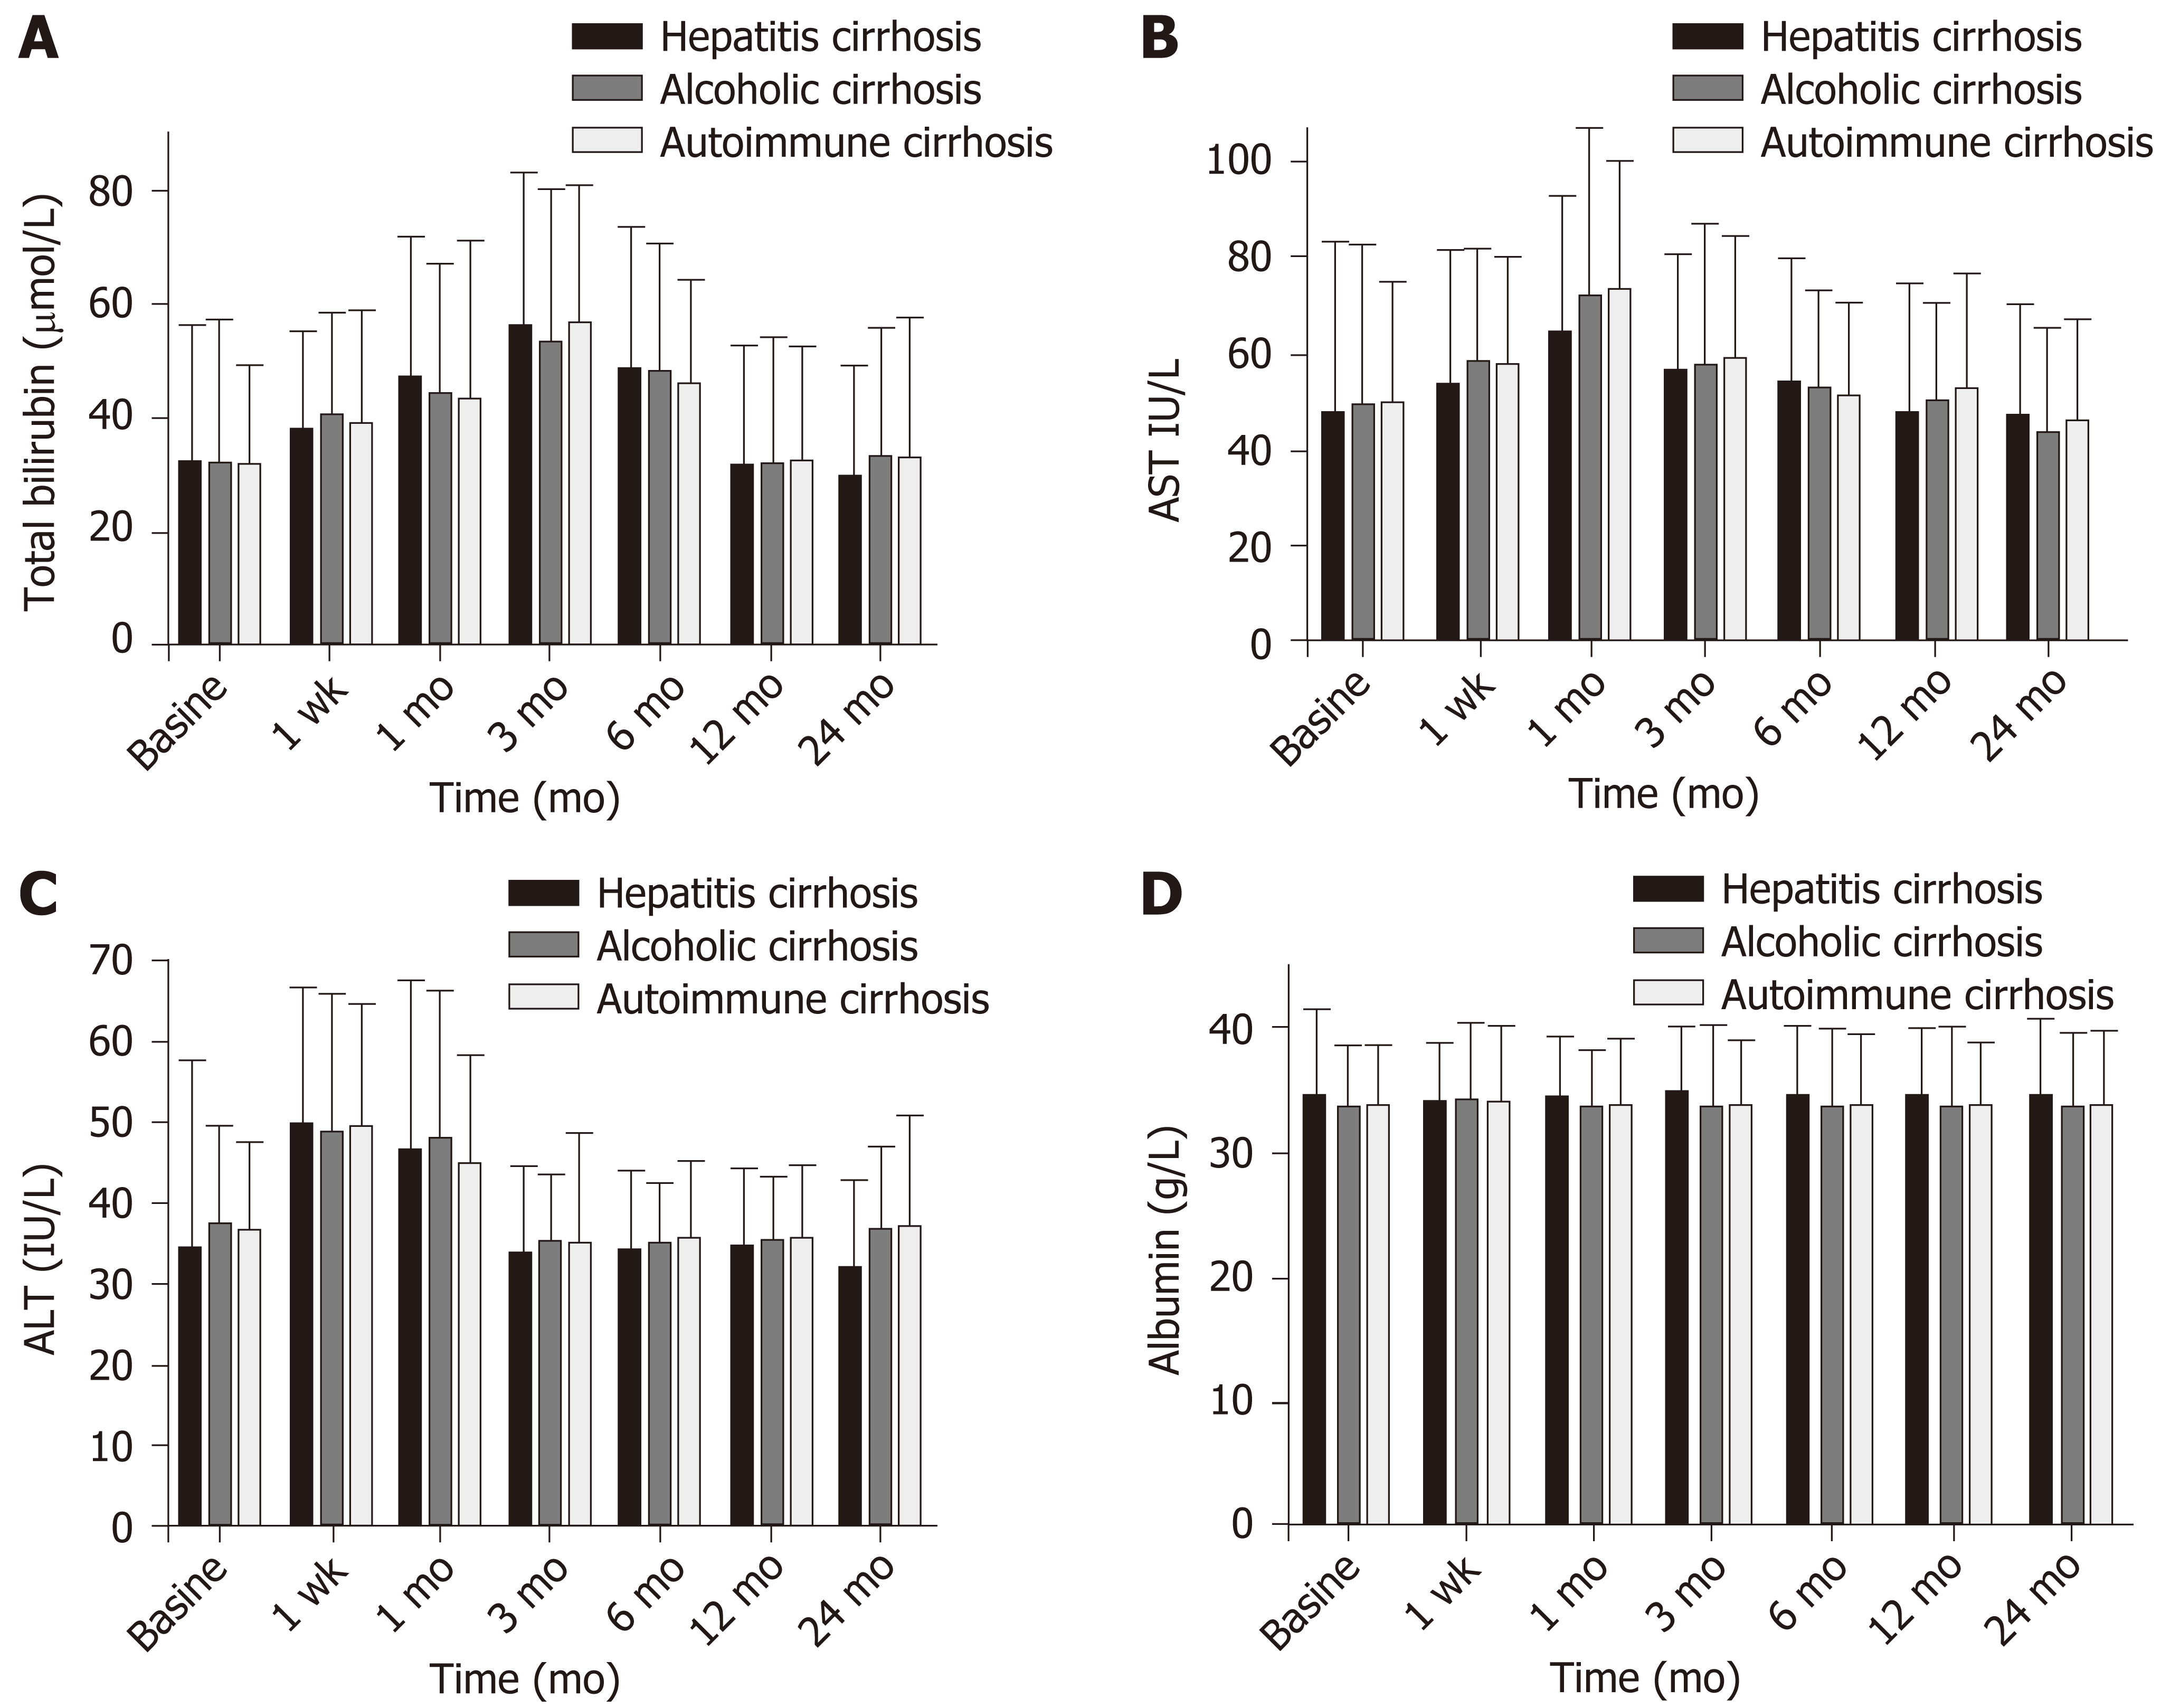
Figure 2 Comparison of liver function before and after surgery among the three groups.
A: Total bilirubin; B: Aspartate aminotransferase; C: Alanine aminotransferase; D: Albumin. AST: Aspartate aminotransferase; ALT: Alanine aminotransferase.
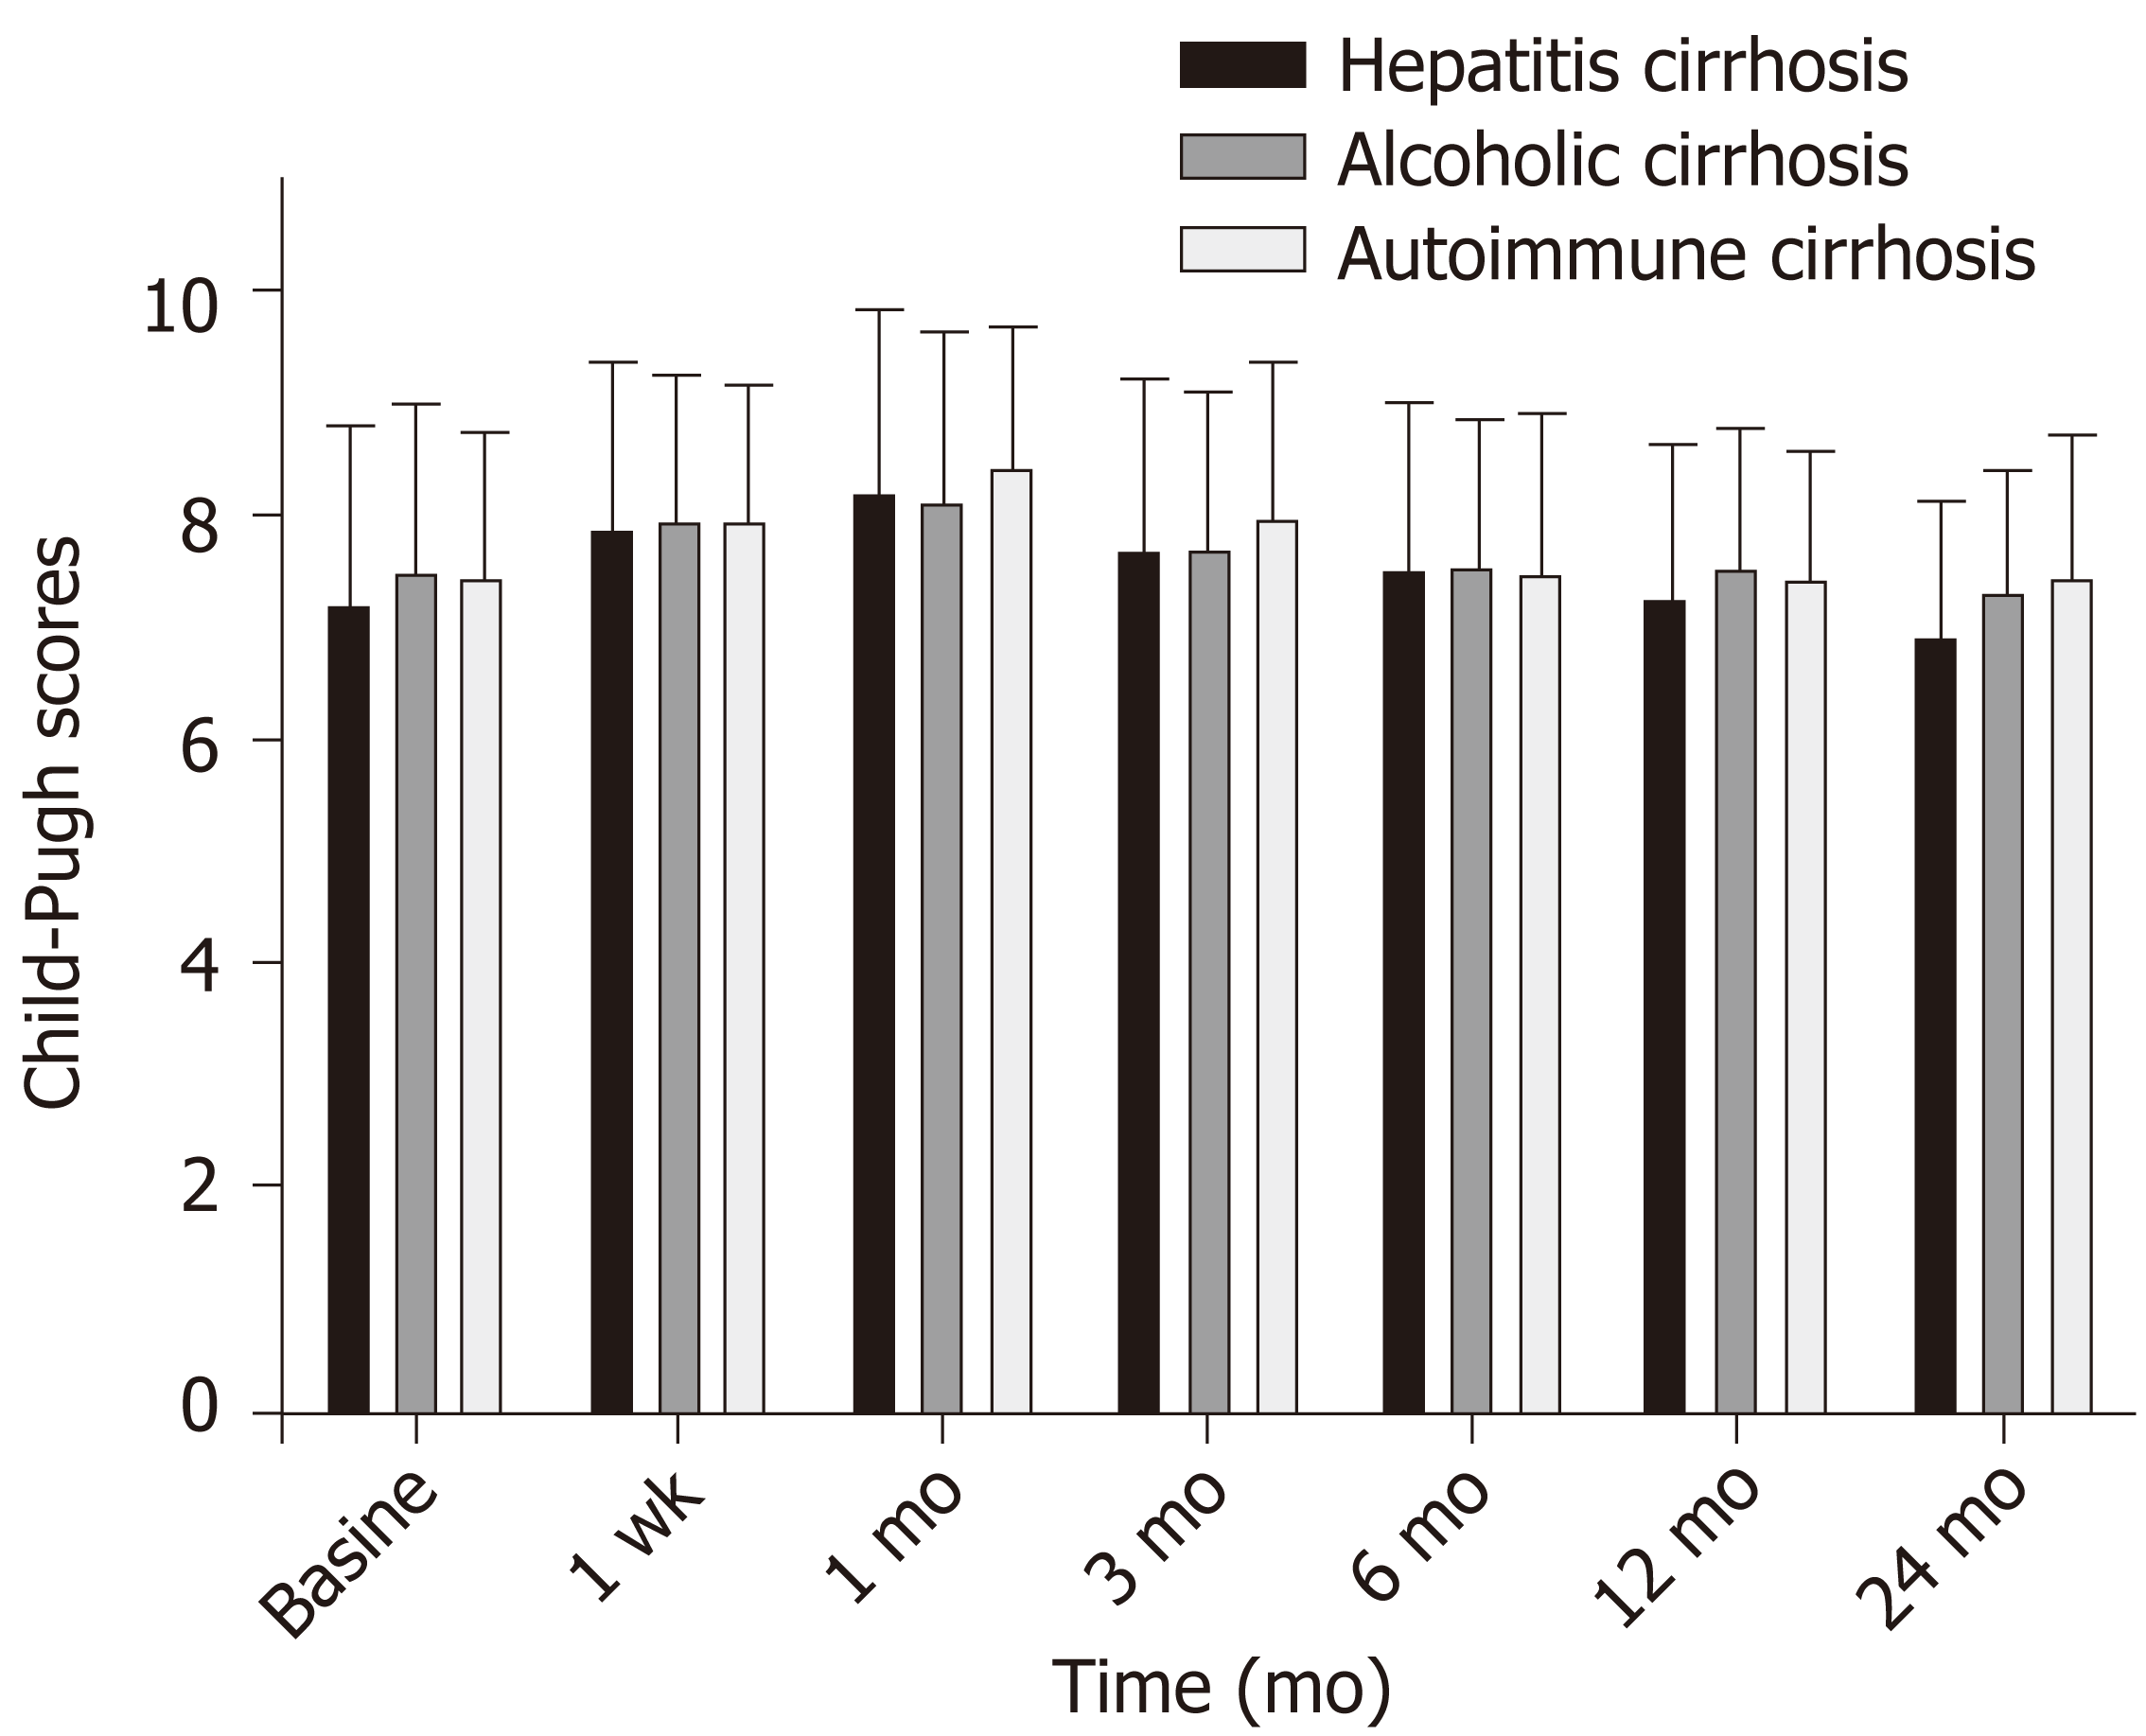
Figure 3 Preoperative and postoperative Child-Pugh scores and ratios in the three patient groups.
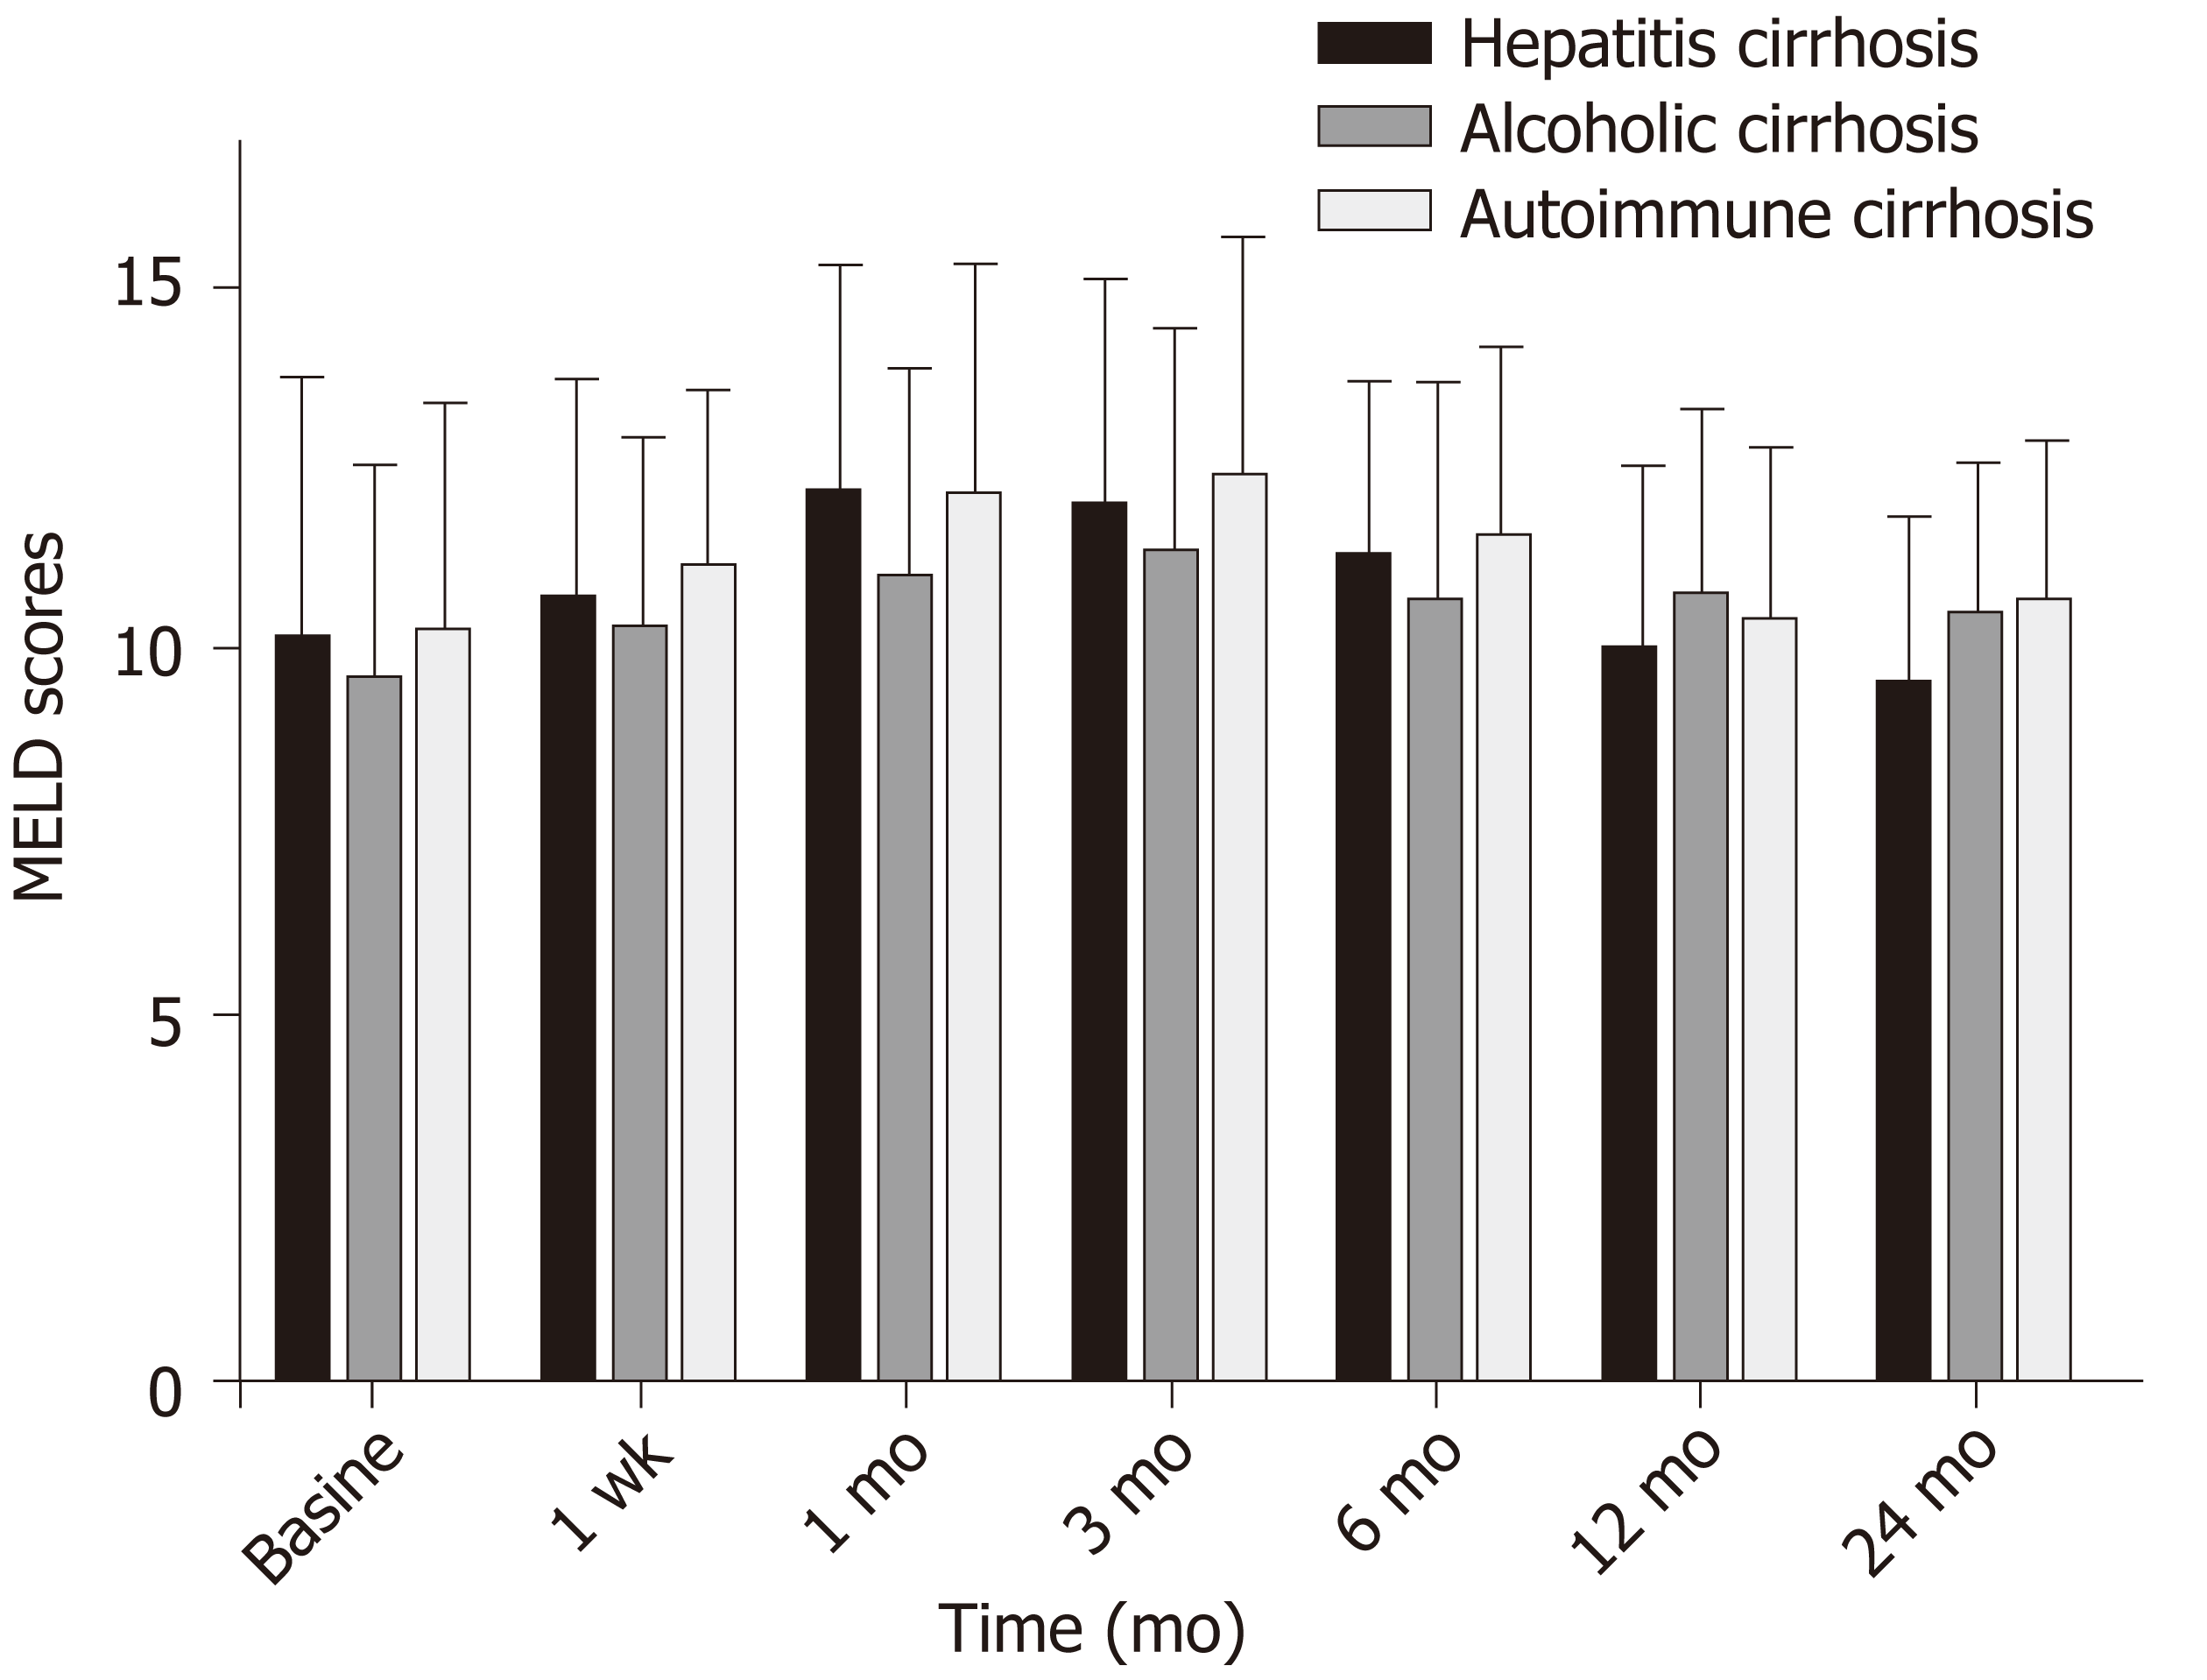
Figure 4 Changes in preoperative and postoperative model for end-stage liver disease scores in the three patient groups.
MELD: Model for end-stage liver disease.
- Citation: Yao X, Zhou H, Huang S, Tang SH, Qin JP. Effects of transjugular intrahepatic portosystemic shunt using the Viatorr stent on hepatic reserve function in patients with cirrhosis. World J Clin Cases 2021; 9(7): 1532-1542
- URL: https://www.wjgnet.com/2307-8960/full/v9/i7/1532.htm
- DOI: https://dx.doi.org/10.12998/wjcc.v9.i7.1532


