Copyright
©The Author(s) 2021.
World J Clin Cases. Feb 26, 2021; 9(6): 1353-1358
Published online Feb 26, 2021. doi: 10.12998/wjcc.v9.i6.1353
Published online Feb 26, 2021. doi: 10.12998/wjcc.v9.i6.1353
Figure 1 Plain X-ray and magnetic resonance imaging of the pelvis in a patient with bone epithelioid hemangioendothelioma.
A: Bone destruction of the proximal femur on the left side; B: T1-weighted image showing the lesion in the left proximal femur side with low signal; C: T2-weighted image showing an obvious hyperintense signal in the left proximal femur.
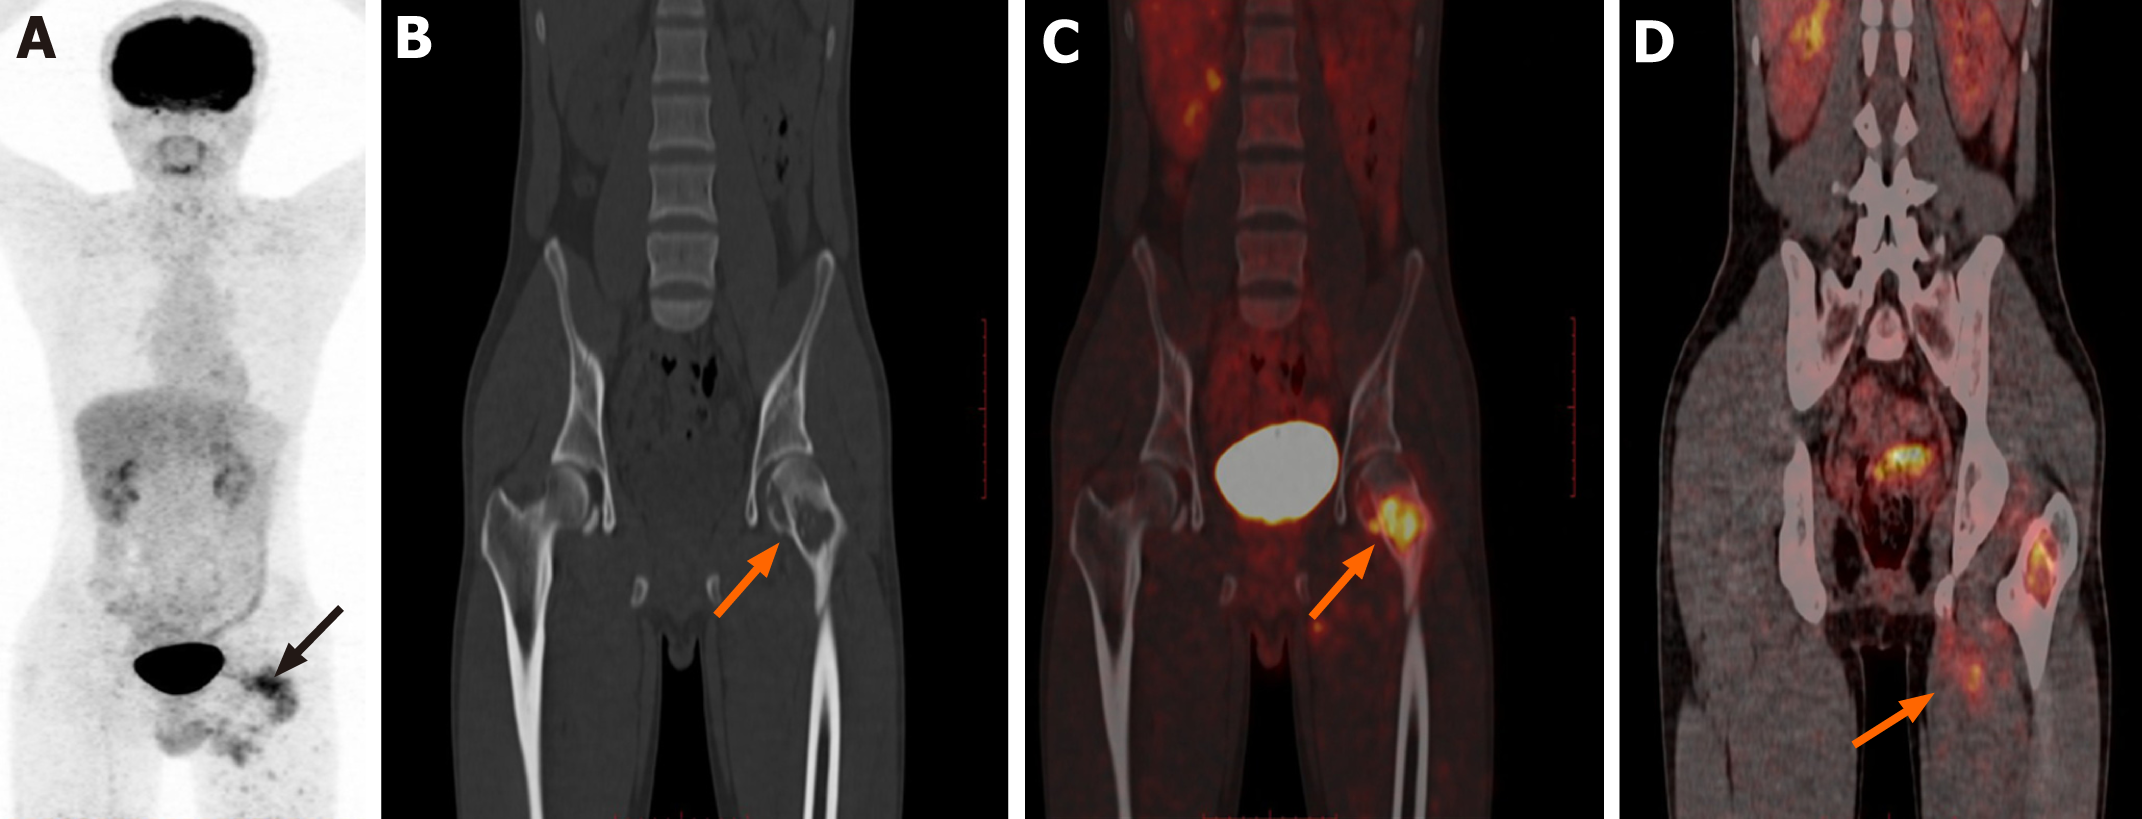
Figure 2 18F-deoxyglucose positron emission tomography/computed tomography imaging.
A: Positron emission tomography maximum density projection shows intense metabolic foci in the left femoral region; B-D: Computed tomography and positron emission tomography/computed tomography fusion images showing visible bone crest in the area of osteolytic lesions in the left femur, increased metabolism (maximum standardized uptake value: 4.2), and involvement of surrounding muscles.
Figure 3 Histopathological images (× 400).
A: Hematoxylin and eosin stained section showing spindle-shaped mesenchymal tissue hyperplasia with scattered epithelioid cells; B: Immunohistochemical staining with the EN-vision technique showing positivity for CD31; C: Immunohistochemical staining with the EN-vision technique showing positivity for ERG.
- Citation: Zhao HG, Zhang KW, Hou S, Dai YY, Xu SB. Femoral epithelioid hemangioendothelioma detected with magnetic resonance imaging and positron emission tomography/computed tomography: A case report. World J Clin Cases 2021; 9(6): 1353-1358
- URL: https://www.wjgnet.com/2307-8960/full/v9/i6/1353.htm
- DOI: https://dx.doi.org/10.12998/wjcc.v9.i6.1353


